A Rhode Island map has to explain much more than the straight state borders visible on a small national map. Connecticut forms the western edge, Massachusetts meets Rhode Island on the north and east, and a deeply indented coast opens toward Rhode Island Sound. In the center, water separates peninsulas and islands, while Block Island sits well south of the mainland.
The downloadable collection presents that geography in three matching portrait images: a pastel county map, a black and white county map, and an outline version without county names. Each WebP preview measures 1200 × 1612 pixels. The Rhode Island map set keeps the complete state outline, the five county divisions, the major offshore shape of Block Island, and the surrounding state context on one page.
The labeled maps identify Providence, Kent, Washington, Bristol, and Newport counties. They also label Connecticut, Massachusetts, Rhode Island Sound, and Block Island. Roads, city points, highways, terrain, and live navigation information are not included. This makes the files most useful as county-level reference graphics, worksheet bases, presentation figures, and simple regional comparison maps.
Rhode Island’s compact size does not produce a compact coastline. The central bay system divides the eastern and western sides into narrow shores, islands, and projecting land. A useful layout must therefore preserve small coastal openings without letting the large northern and western county areas dominate the page. The supplied portrait composition gives the coast room while keeping Block Island visible below the mainland.
Table of Contents
Rhode Island map Overview
Begin with the two simple state borders. The west side runs beside Connecticut, and most of the upper boundary meets Massachusetts. The eastern edge is more complicated because parts of Rhode Island extend around bays and waterways toward Massachusetts. The contrast between straight inland lines and irregular coastal edges is the main shape to notice.
Providence County occupies the broad northern section on the map. Kent County forms a central-western band below it, and Washington County covers most of the southern and southwestern mainland. Bristol appears as a small northeastern division beside the bay, while Newport occupies the eastern coastal and island area. These positions are easier to understand spatially than from a five-name list.
The map uses county names as geographic identifiers rather than marking county seats or municipal boundaries. Providence on this page is the county label, not a point symbol for the city. That distinction matters when the image is used in a lesson or presentation: the map answers “which county area is this?” but not “where is the city center?”
Included Map Styles
All three images share the same 1200 × 1612 portrait frame, so one version can replace another without changing a document’s basic layout:
- Color county map: five pastel fills separate the county areas and blue water clarifies the coastal openings.
- Black and white county map: county and context labels remain, while white land areas reduce color and ink use.
- Outline map: the state and county lines remain, but county, neighbor, island, and sound labels are removed.
Use the color image when viewers need immediate county separation. Choose black and white when the labels must stay visible in a monochrome report or handout. Select the outline when readers will supply names, colors, numbers, or other annotations. The three versions are raster images, not editable vector paths, so detailed alterations should be made in a raster or page-layout editor.
Color Rhode Island County Map
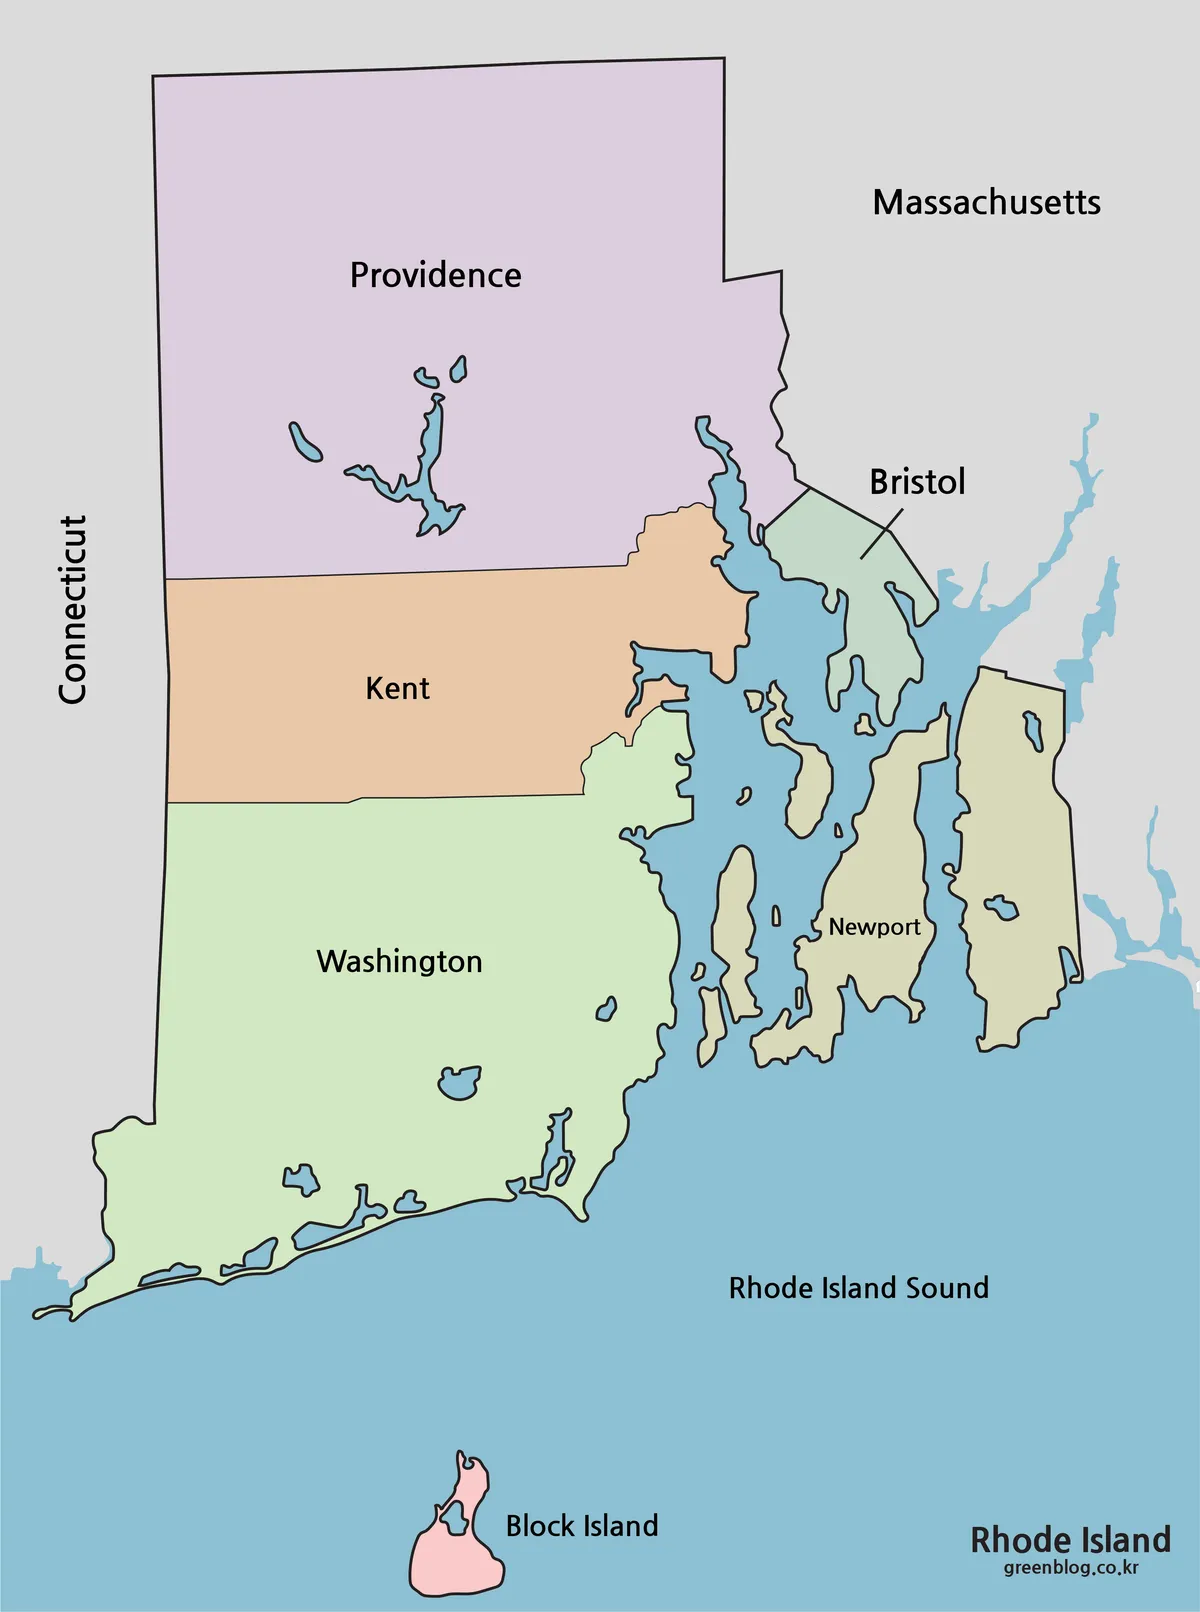
The color Rhode Island map assigns a different pale fill to each county. This is particularly helpful around Bristol and Newport, where water and narrow landforms interrupt the boundary pattern. Blue is reserved for water, making the central channels, offshore gaps, and the open area of Rhode Island Sound visually distinct from the county fills.
Providence, Kent, and Washington have enough space for names to sit directly within their areas. Bristol uses a short leader line because its shape is smaller and more constrained. Newport is labeled over its eastern coastal area. The neighboring state names sit outside Rhode Island, preventing them from being mistaken for county labels.
This version works well as the first image in a slide sequence. It can introduce the five-part layout before a later slide adds statistics or highlights one county. It is also the clearest version for a small blog figure, provided the image is not reduced so far that the Bristol leader line and smaller island shapes disappear.
Black and White Printable Version
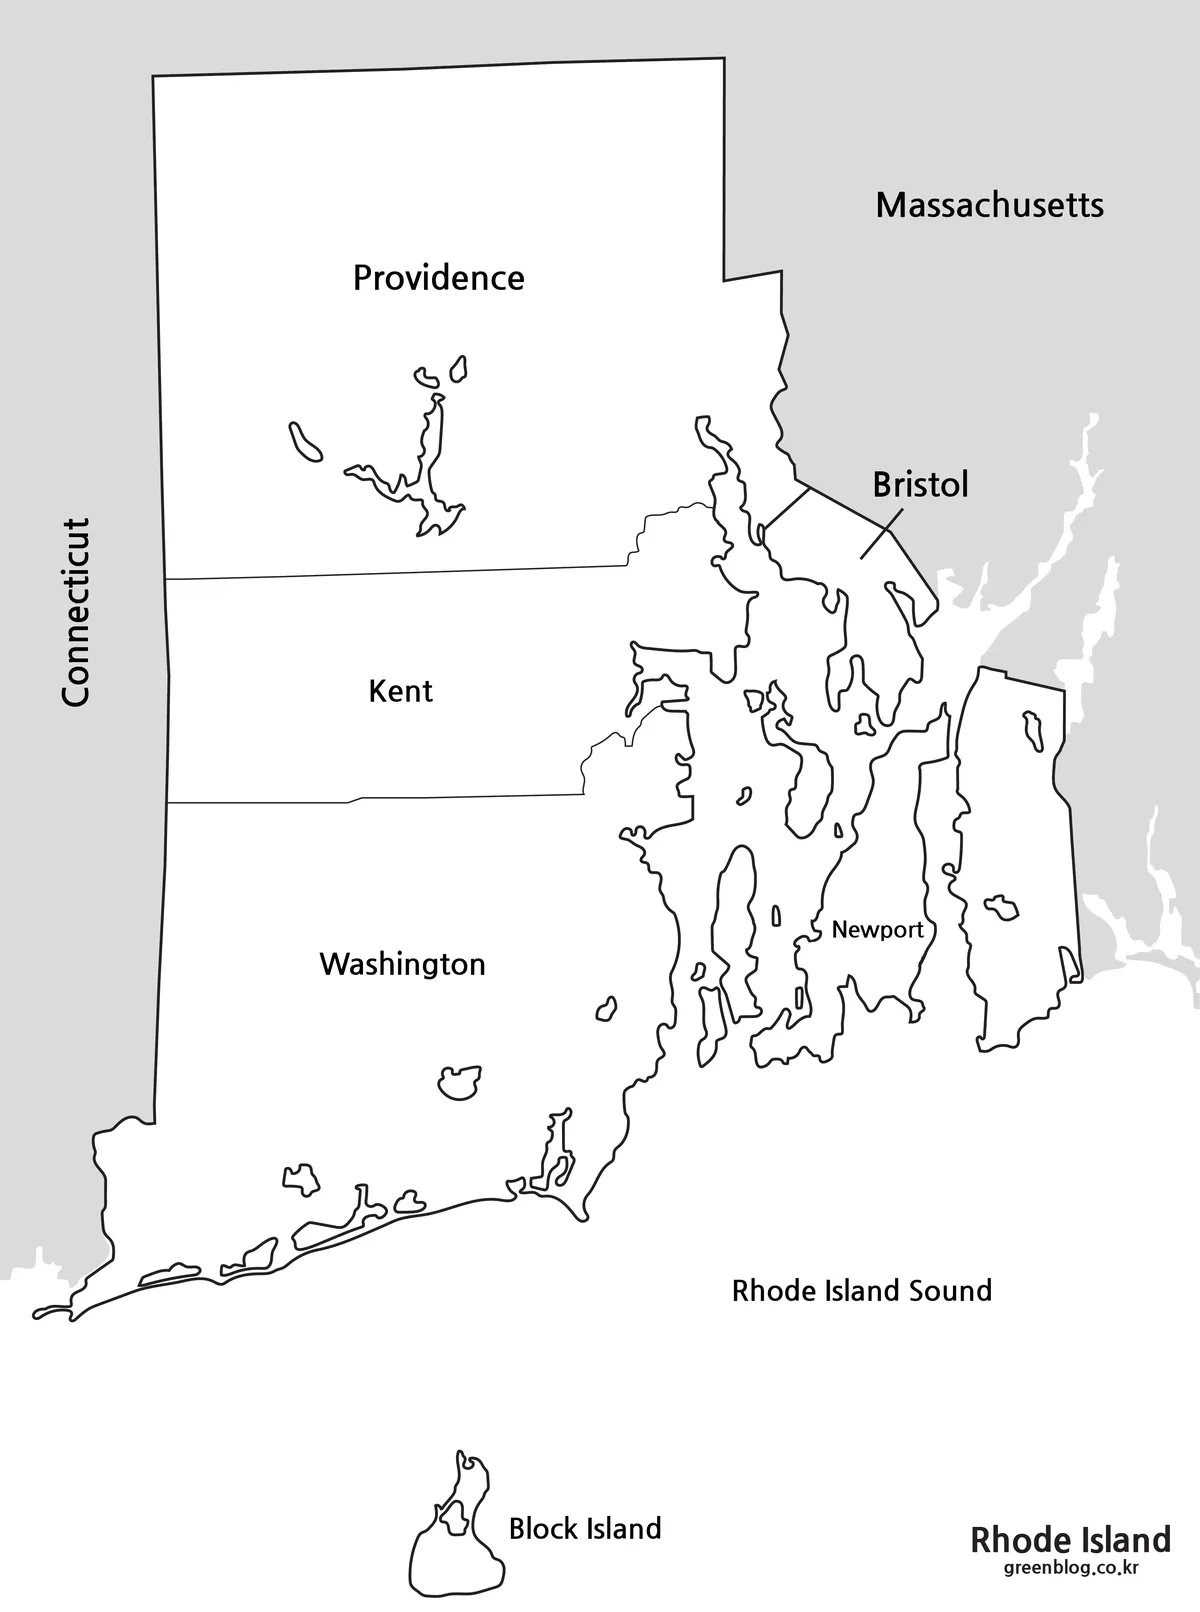
The black and white Rhode Island map retains the five county names and the external geographic labels while removing the pastel fills. Black outlines define the land and internal county borders; pale gray distinguishes the surrounding land beyond the state. This restrained contrast helps the state remain readable without placing a dark block of ink in the middle of a text-heavy page.
Before printing a large batch, preview the page at the intended size. The image is portrait-oriented, and adding wide margins or a long header can shrink the coastal detail. A test page is especially useful for checking the narrow water gaps and the leader line beside Bristol. Keep the original aspect ratio to prevent the coastline and Block Island from appearing stretched.
This version can serve as an answer sheet for a county-naming exercise based on the outline map. It can also accompany a report where readers need county context but color is unavailable. Handwritten arrows or circles remain easy to see against the white county areas.
Blank Rhode Island Outline Map for Editing
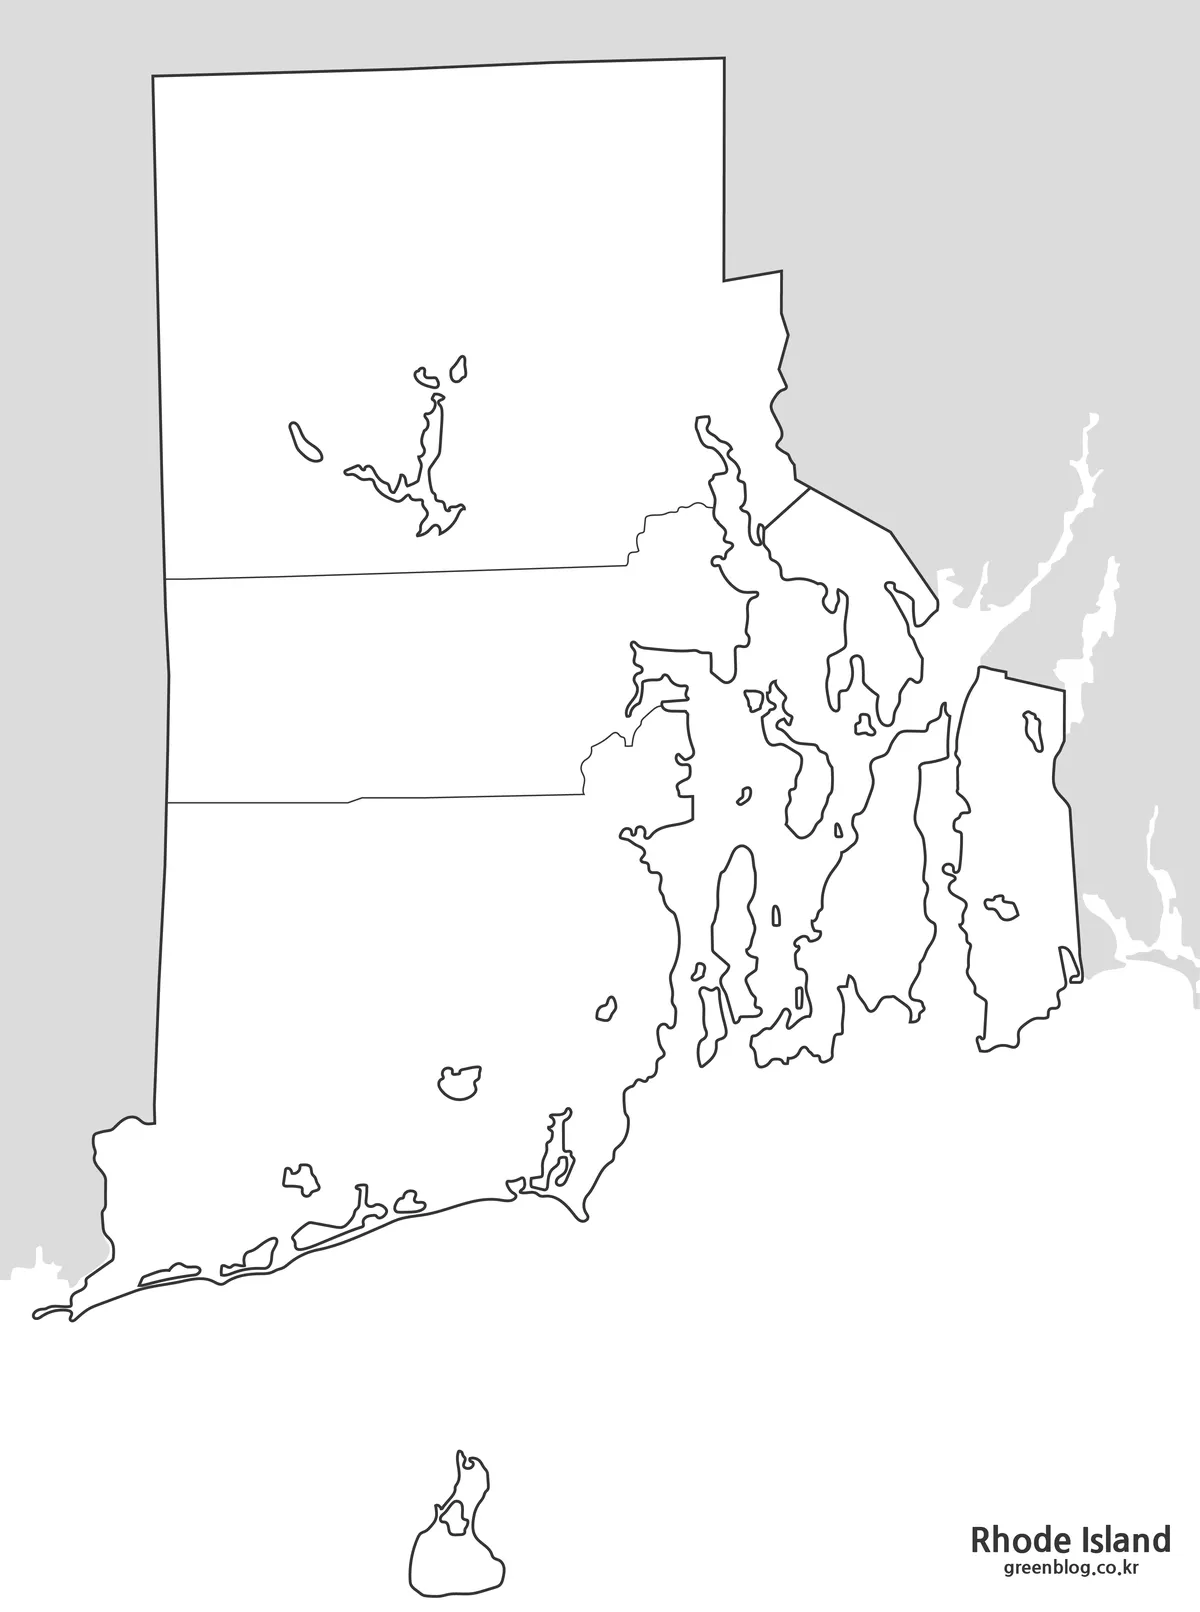
The outline Rhode Island map removes the county names, neighboring-state names, Block Island label, and sound label. It preserves the outer state boundary, five county areas, coastal openings, and the main offshore shapes. The small “Rhode Island” imprint at the lower right remains part of the published image, so this is an unlabeled working map rather than a completely text-free canvas.
For a worksheet, place the five county names in a separate word bank and ask students to match them to the shapes. For a data graphic, use consistent fills and add a legend explaining what the colors represent. For a presentation, number selected areas and reveal the answers on the next slide using the labeled version.
The county lines are not road routes, and the coastline alone cannot show safe travel paths. Any arrows added for a trip or movement diagram should be described as schematic. The outline is best used to communicate broad location, sequence, comparison, or classification rather than street-level directions.
Rhode Island County Layout
The five labeled divisions are:
- Providence County in the north
- Kent County across the central west
- Washington County across the south and southwest
- Bristol County in the small northeastern bay area
- Newport County along the eastern coast and islands
The western portions of Providence, Kent, and Washington create a simple north-to-south stack. The eastern side breaks that pattern because bays, islands, and narrow coastal land separate Bristol and Newport from the broad western blocks. This is why a county map offers more value than a plain state silhouette: it shows how water influences the apparent arrangement of the internal divisions.
Block Island is drawn separately below the mainland so its offshore position remains clear. The large gap is geographic, not an omitted part of the county layout. When cropping or resizing the graphic, retain the lower section of the page; otherwise the island and the label that identifies it on the two reference maps will be lost.
Practical Uses for the Map
The three versions support different stages of the same project. Introduce the state with the color map, switch to black and white for a printable reference, and use the outline for reader participation. Because the geometry and dimensions match, the sequence stays visually stable when used in slides, worksheets, or a multi-page handout.
- Compare Rhode Island’s five counties by position and shape.
- Identify the Connecticut and Massachusetts sides of the state.
- Practice labeling counties, Block Island, and Rhode Island Sound.
- Create a simple county-based data or presentation graphic.
- Explain why the eastern coastline is more fragmented than the west.
Do not crop the image tightly to the mainland. The surrounding labels establish direction, and the lower margin holds Block Island. On a landscape slide, scale the complete portrait image and use the remaining space for a legend or notes. On a printed page, avoid reducing it merely to make room for decorative elements; the county names and small coastal forms carry the actual reference value.
Frequently Asked Questions
What is included in the Rhode Island map collection?
The collection includes a color map, a black and white map, and an outline map.
Can I print the Rhode Island map in A3 size?
Yes. The map is prepared for A3 high-resolution printing, making it suitable for handouts, posters, and presentation materials.
Is the outline map blank?
Yes. The outline version removes color and keeps the main boundary and county lines, making it useful for editing, coloring, and custom labels.
What can I use the Rhode Island map for?
It can be used for classroom worksheets, blog graphics, travel explanations, presentation slides, regional comparison materials, and infographic projects.
Does the Rhode Island map show county boundaries?
Yes. The county map version includes Rhode Island’s county boundary structure.
Map File Information
This download contains the three Rhode Island map styles displayed on the page.
- Included Versions: color labeled, black and white labeled, and unlabeled outline
Additional Resources
- Rhode Island Geographic Information System — the state planning division’s official gateway to RIGIS information and geographic data.
Related Maps
Green Map creates custom-edited map images using open geographic data sources such as geoBoundaries, Natural Earth, OpenStreetMap, and government open data. These maps are edited visual materials, not raw data files, and are provided for education, documents, presentations, and graphic reference.