A Fukushima Prefecture Map has to make room for 59 municipalities across a prefecture that stretches from the Aizu interior to the Pacific coast. Most names fit inside their boundaries, but five compact municipalities south of Sukagawa are identified by numbers and decoded in a separate box. That small design choice is one of the most important features to understand before using the labeled maps.
The numbered places are Kagamiishi, Yabuki, Izumizaki, Nakajima, and Asakawa. They appear as 1 through 5, respectively, around the narrow cluster between Sukagawa, Shirakawa, Ishikawa, and Tanagura. Without the key, these shapes could be mistaken for unlabeled gaps. The color and monochrome versions retain the same numbering, while the blank outline removes both the numbers and the legend.
Fukushima lies in southern Tohoku and contains 13 cities, 31 towns, and 15 villages. Its municipalities are often discussed through three broad geographic areas: Aizu in the west, Nakadori through the central corridor, and Hamadori along the east. The Fukushima Prefecture Map does not draw those three areas as a separate layer, but municipal position makes their west-to-east arrangement readable.
The collection contains a pastel administrative map, a labeled black-and-white version, and an unlabeled boundary outline. All three previews measure 1200 × 1050 pixels and use identical municipal geometry. Their shared portrait-like layout keeps the long western and coastal sections visible while leaving enough room for neighboring-prefecture labels around the edge.
Table of Contents
Fukushima Prefecture Map Overview
The labeled versions identify all 59 municipalities, including the 13 cities of Fukushima, Aizuwakamatsu, Koriyama, Iwaki, Shirakawa, Sukagawa, Kitakata, Soma, Nihonmatsu, Tamura, Minamisoma, Date, and Motomiya. Town and village names fill the remaining divisions, with the five smallest labels moved to the numbered key for clarity.
Six neighboring prefectures provide orientation: Miyagi, Yamagata, Niigata, Gunma, Tochigi, and Ibaraki. The blue eastern edge on the color version represents the Pacific coast, although the ocean name is not printed. No roads, railways, elevations, rivers, travel routes, or distance scale are included, so the resource is an administrative reference rather than a navigation map.
Understanding Fukushima’s Regional Layout
Western Fukushima is dominated on the map by large municipal shapes. Hinoemata occupies the far southwestern corner beside Gunma and Tochigi, while Tadami and Minamiaizu cover broad areas farther north and east. Aizuwakamatsu forms a tall central-western division, and the very small village of Yugawa is tucked among Aizubange, Kitakata, Bandai, and Aizuwakamatsu.
The central section contains Fukushima City in the north, Koriyama near the middle, and Shirakawa toward the south. Smaller municipalities cluster around these cities, producing a denser pattern than in the far west. On a Fukushima Prefecture Map, this contrast explains why Kori, Kunimi, Iino, Otama, Miharu, and the five numbered places need more careful label placement.
Hamadori forms the coastal side. Soma and Shinchi occupy the northeast, Minamisoma extends below them, and Iwaki creates the largest coastal shape in the southeast. Between Minamisoma and Iwaki, a narrow sequence of municipalities includes Namie, Futaba, Okuma, Tomioka, Naraha, and Hirono, with Katsurao and Kawauchi situated inland from portions of that coast.
These patterns make the three regional names useful as geographic shorthand, but they should not be counted as municipal units. The visible boundaries represent cities, towns, and villages. Aizu, Nakadori, and Hamadori help organize the prefecture conceptually; they are not an additional set of 59 labeled polygons on the supplied artwork.
Color Administrative Map
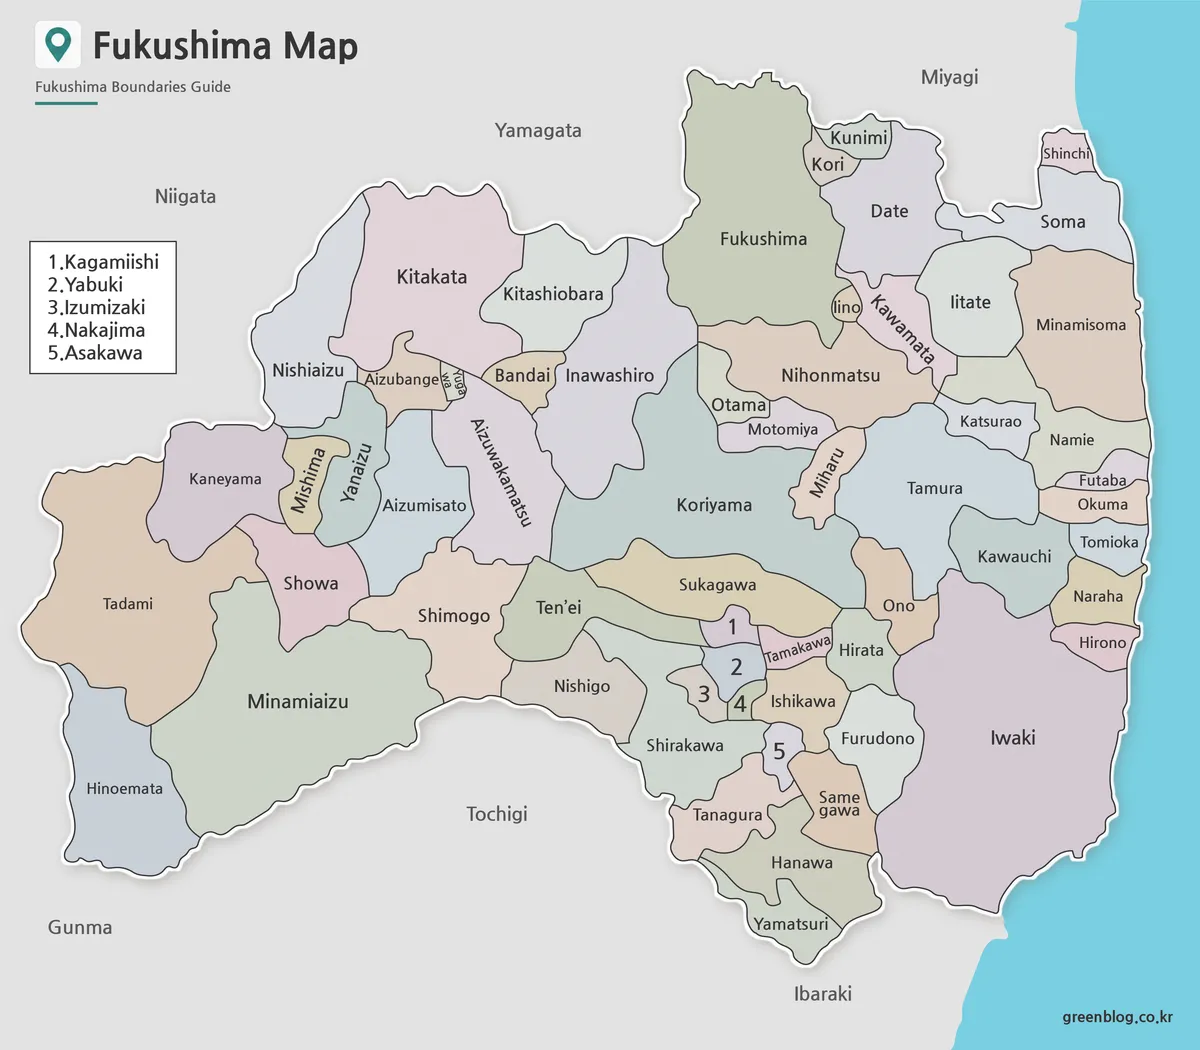
The color Fukushima Prefecture Map assigns contrasting pastel fills to adjacent municipalities. The palette is categorical: it separates boundaries but does not represent population, elevation, evacuation status, land use, or political data. The coastal water is blue, neighboring prefectures are gray, and the mapped municipalities remain light enough for their black labels to stay legible.
This version is best when readers must distinguish adjoining areas quickly. It makes the narrow coastal municipalities and the tight southern cluster easier to follow during a presentation, while large western divisions remain visually separate. The boxed 1–5 key sits in the open margin near Niigata rather than covering municipal geometry.
Teachers can use the colors to ask students which municipalities touch the coast, which meet a neighboring prefecture, or which surround a selected city. Because the fills carry no thematic values, they should not be interpreted as regional categories. Any statistical overlay needs its own legend and source.
Black and White Printable Map
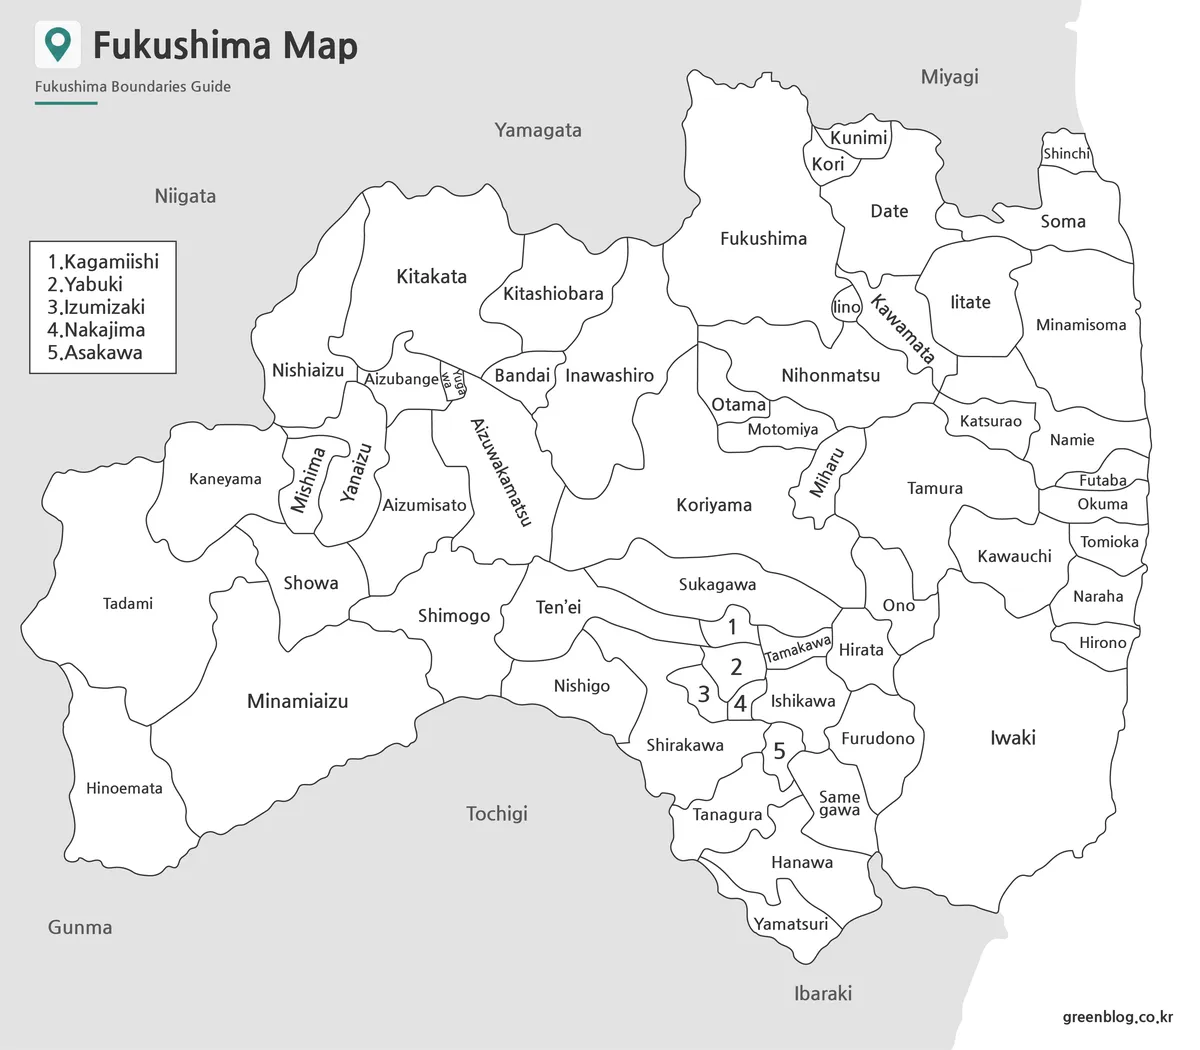
The monochrome Fukushima Prefecture Map keeps every label and boundary while replacing municipal fills with white. It is the most practical choice for low-ink worksheets, report appendices, and answer sheets. The lack of color also leaves room for readers to shade selected municipalities by hand without losing the original names.
The crowded locations still require attention. Kagamiishi, Yabuki, Izumizaki, Nakajima, and Asakawa remain numbered rather than written inside their polygons. Samegawa is split across two lines, and labels such as Kawamata and Aizuwakamatsu follow narrow shapes at an angle. Those arrangements are part of the image, not evidence of missing municipalities.
This version can serve as the labeled reference for an exercise conducted on the blank map. Students may transfer names, group municipalities into the three broad geographic areas, or mark those that border another prefecture. Route planning and terrain interpretation still require separate sources because the image includes neither transport lines nor physical relief.
Blank Outline Map for Editing
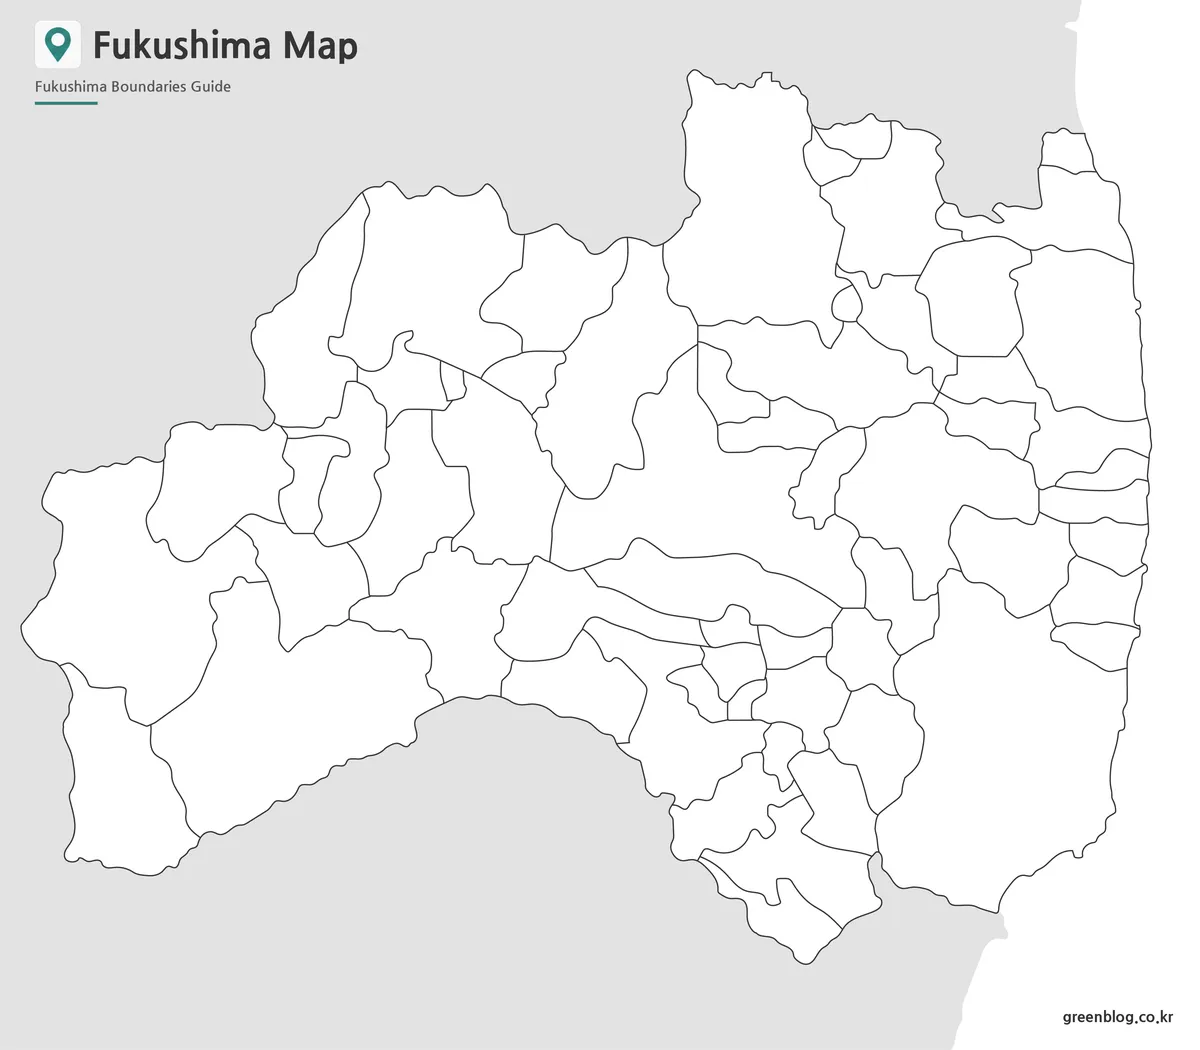
The blank Fukushima Prefecture Map removes all place names, the numbered key, neighboring labels, and colored fills. It retains the prefectural silhouette and municipal lines, including the very small shapes in northern and southern clusters. Users therefore need the labeled version nearby if the task requires all 59 names to be placed accurately.
A labeling sequence can begin with the largest anchors: Iwaki on the southeast coast, Fukushima in the north-central area, Koriyama in the center, and Hinoemata at the southwest corner. From there, learners can fill in the coastal chain and the compact areas around Sukagawa and Shirakawa. This approach is easier than trying to identify every small polygon without spatial reference points.
The outline also supports color-coding, classroom quizzes, presentation overlays, and sourced data projects. It is a raster image rather than a confirmed layered vector file, so digital edits should be made on a separate layer or in a document program that preserves the original base. Administrative changes should be checked against a current source before publication.
Designed for Practical Projects
Choose the color version for immediate visual separation, the monochrome map when labels must remain in a printable document, and the outline when the reader will add information. A useful workflow is to show the color reference, distribute the blank activity, and reserve the black-and-white version as an answer guide.
For A3 printing, keep the 1200:1050 proportion and preview the page margins before printing. A fit-to-page setting helps protect the labels for Miyagi, Ibaraki, and Gunma near the outer edge. If the five-number key or narrow municipal names appear too small, print one test sheet rather than assuming that every office or home printer handles the same margins.
The Fukushima Prefecture Map collection is most useful for municipal reference, regional comparison, lessons, handouts, and simple infographic bases. Its value comes from showing all local-government shapes on one page without roads or physical detail competing for space. For topography, live navigation, or authoritative boundary verification, pair it with a dedicated current mapping service.
Frequently Asked Questions
Can I print the Fukushima Prefecture Map in A3 size?
Yes. Every version in this collection was prepared in high resolution for A3 printing, making it suitable for classroom handouts, reports, presentation boards, and reference materials.
Does the outline map include place names?
No. The outline version contains only municipal boundary lines, giving you a clean base for annotations, color-coding, graphic editing, or educational worksheets.
Which map version should I choose?
The color map is best for identifying municipalities quickly, the black and white version is ideal for printed documents and reports, and the outline map works well for editing, custom graphics, and infographic projects.
Map File Information
Download three matching Fukushima municipal maps for labeled reference, monochrome printing, or custom annotation.
- Included Versions: Color labeled, black-and-white labeled, and blank outline maps
- Printable Size: A3
- File Type: JPG / ZIP
- Intended Use: Lessons, reports, presentations, and municipal labeling activities
Related Maps
Additional Resources
- Geospatial Information Authority of Japan Maps — Explore Japan’s national mapping service for current topographic and geographic reference.
Green Map creates custom-edited map images using open geographic data sources such as geoBoundaries, Natural Earth, OpenStreetMap, and government open data. These maps are edited visual materials, not raw data files, and are provided for education, documents, presentations, and graphic reference.