Jefferson County’s 2025 land-cover pattern is split mainly between shrubland and working farmland. Shrubland accounts for 49.31% and agriculture for 35.19%, while the Mud Lake wetland complex creates a conspicuous blue-green area amid those much larger classes. Development is most concentrated toward the southeast around Rigby.
The page includes four views: general land cover, forest and farmland, impervious and developed surfaces, and a 1985-to-2025 class comparison. The four original JPG maps are also provided together in one ZIP for printing, county comparison, education, and presentation use.
Table of Contents
A broad farm grid breaks up the shrubland across the north and southeast
Much of Jefferson County has a regular field-and-road pattern that is easy to distinguish from the more irregular shrub-covered ground. Large agricultural blocks occupy the northwest, central-west, northeast, and southeast. Between them, shrubland forms broad brown areas, especially across the west and central-east portions of the county.
University of Idaho Extension in Jefferson County focuses on crop production, forage and livestock, pasture management, farm business management, and small-acreage farming. That local program supports the importance of agriculture in the county, but it does not identify the crop in any individual mapped field. The land-cover product should therefore be used to locate agricultural cover, not to assign specific crops or farm ownership.
The field pattern also explains why roads are so visible on the impervious map. Thin, straight routes cross many of the agricultural blocks in a grid, while roads become much sparser across large shrubland areas. The maps show those features in the same places, but that association should not be turned into a claim that one caused the other.
Shrubland at 49.31% remains the largest class, with agriculture close behind
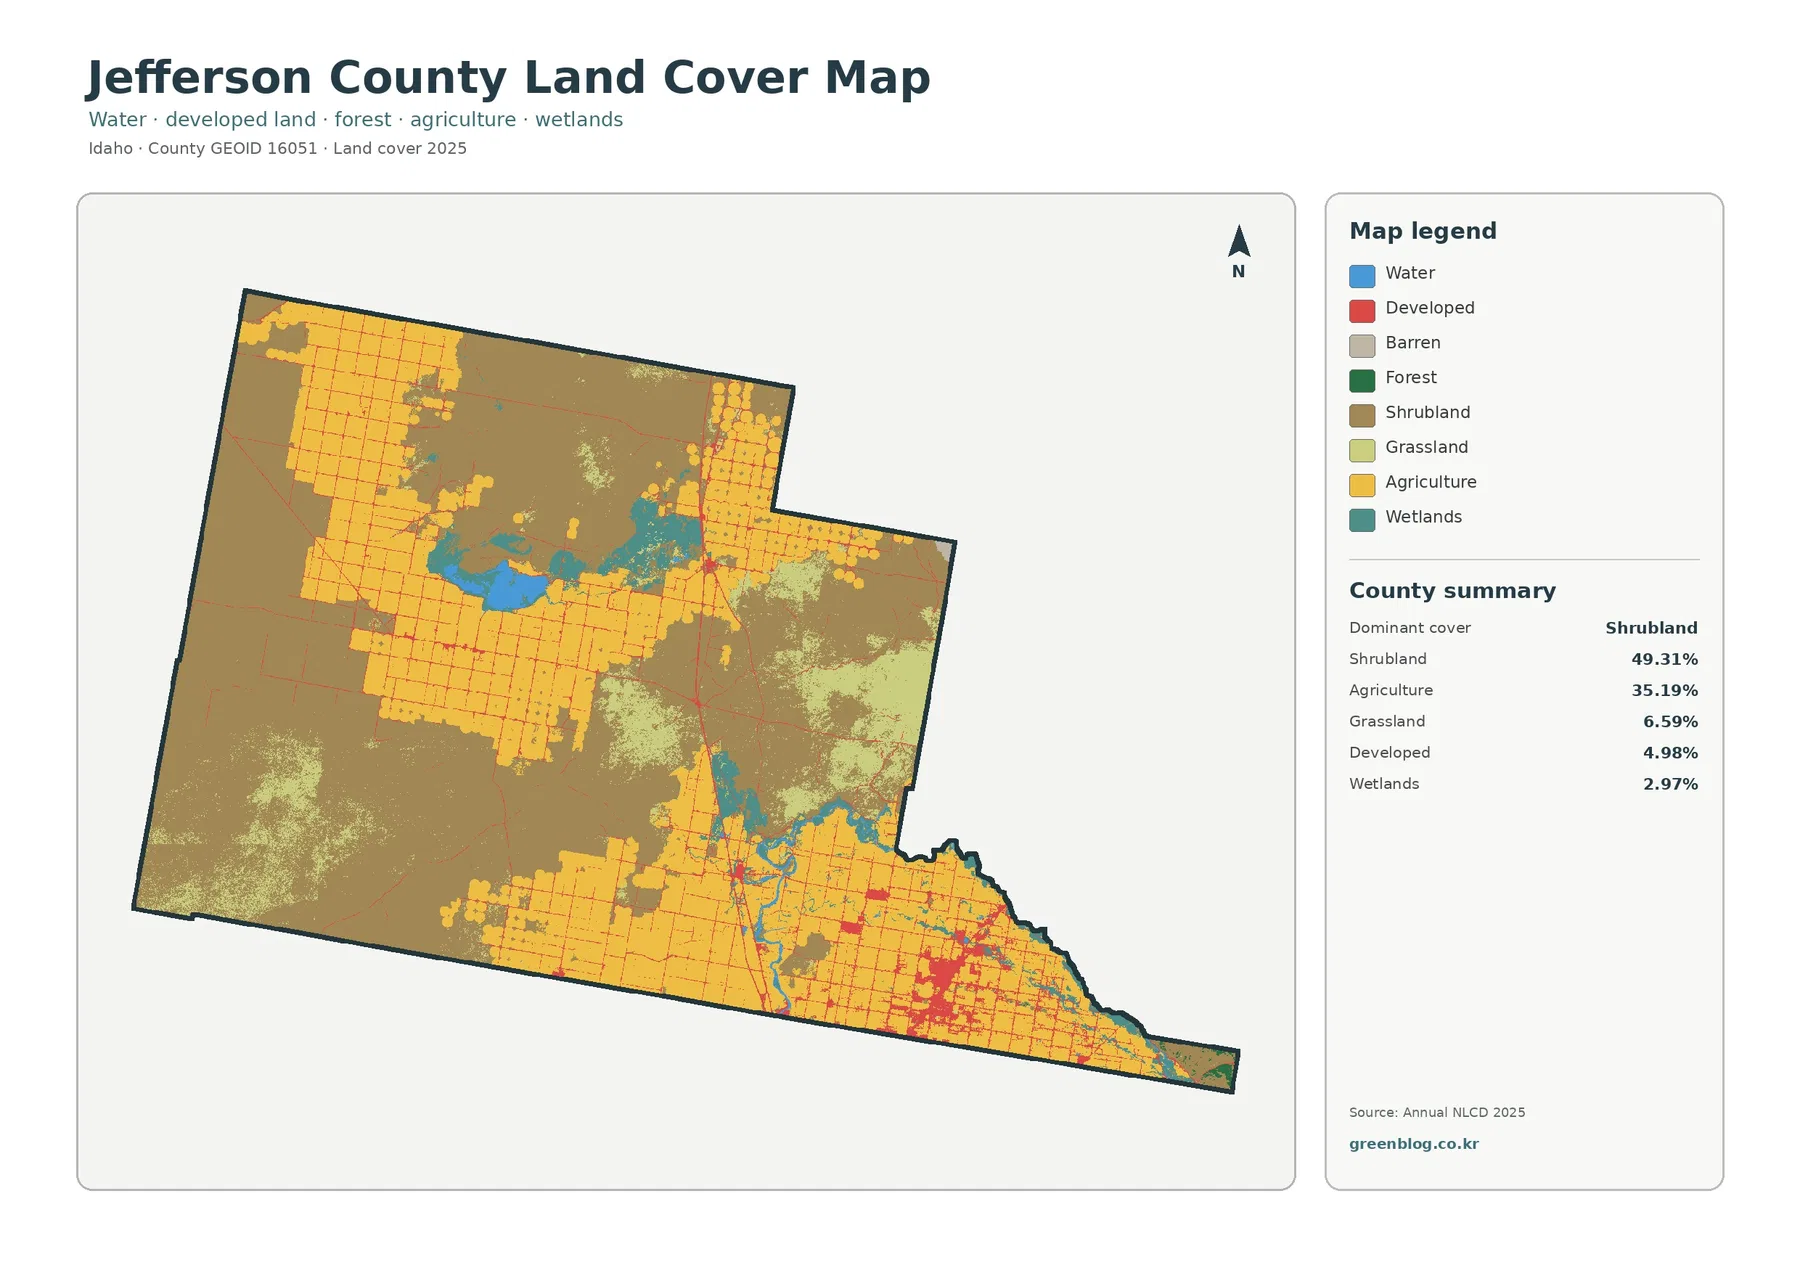
The 2025 summary places shrubland first at 49.31% and agriculture second at 35.19%. Grassland contributes another 6.59%, developed land 4.98%, and wetlands 2.97%. Water is 0.77%, while forest is only 0.12%. That tiny forest share is important because it prevents a common mistake: Jefferson County should not be described as a forest-dominated eastern Idaho county.
Grassland appears as light-green patches inside and along the edges of the larger shrubland areas. Developed land is more compact, with the largest red concentration in the southeast and smaller nodes elsewhere. The blue and teal water-wetland features are localized rather than widespread, yet they stand out because they contrast sharply with the brown shrubland and yellow farm fields.
Land cover is not the same thing as zoning or legal land use. A yellow agricultural cell identifies a surface classified as agriculture in the satellite-derived product. It does not establish a parcel’s zoning, ownership, water right, or future development potential. The same distinction applies to shrubland, wetlands, and developed classes.
Mud Lake and its marshes form the county’s most obvious water-and-wetland cluster
The blue-and-teal complex in the north-central part of the county is consistent with the Mud Lake area. Idaho Fish and Game states that Mud Lake Wildlife Management Area surrounds Mud Lake in Jefferson County and includes deep marsh units, shallow flooded wetlands, wet meadows, permanent wetlands, and sagebrush steppe. Those descriptions fit the mixed water, wetland, farm, and shrub classes visible around the lake.
Wetlands occupy 2.97% of the county and water 0.77%, so neither class is large in countywide percentage terms. Their concentration makes them visually prominent anyway. For habitat or watershed presentations, this is a good example of why a small percentage can still represent an important geographic feature when it is clustered in one place.
Idaho Fish and Game also notes that agricultural fields now occupy areas around Mud Lake that historically included seasonal wetlands. That historical context is useful, but the 2025 map alone cannot date those changes or identify which individual field replaced a wetland. Any detailed historical reconstruction would require earlier imagery, annual land-cover records, and water-management information.
The forest-and-farmland view makes the 35.19% agricultural share easier to follow
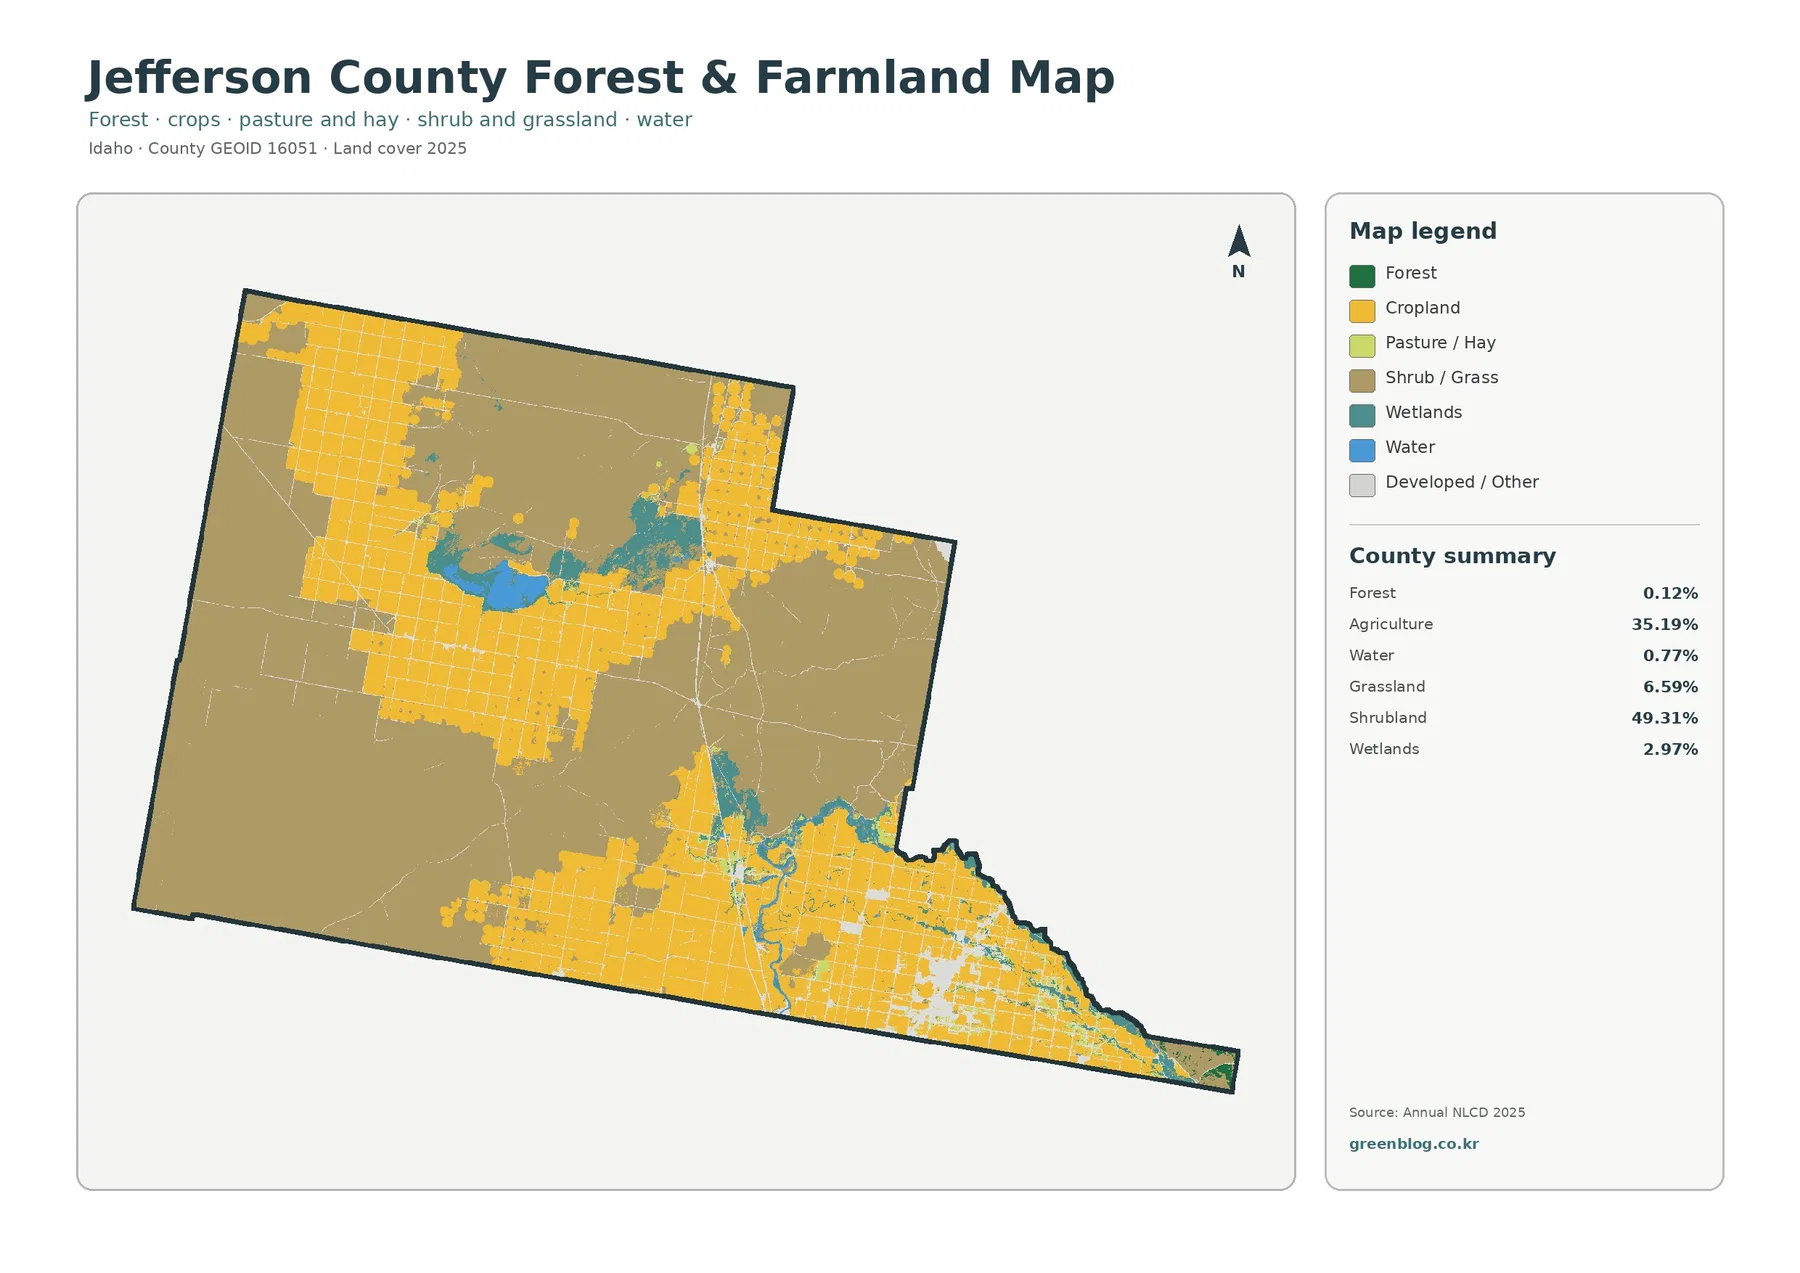
This version reduces the number of colors and makes the agricultural pattern easier to trace. Yellow cropland forms large rectangular areas across the northwest and central-west, appears again in the northeast, and covers much of the southeast. The central water-and-wetland complex interrupts those fields, while broad shrub-and-grass areas remain dominant between the major farm districts.
Forest is listed at only 0.12%, so green forest patches are almost absent. That makes this map particularly different from neighboring Idaho counties where mountain forest can dominate the page. In Jefferson County, the more useful comparison is between cropland and shrub-or-grass cover, with wetlands and developed areas acting as smaller but locally important features.
Rigby, the Jefferson County seat, is described by the city as an agricultural hub in the Upper Snake River Valley. On the supplied maps, the southeast contains the strongest concentration of developed and impervious cover while still remaining surrounded by farm fields. The map does not distinguish residential, commercial, or industrial uses, so those urban functions should not be inferred from the developed color alone.
Impervious cover averages 1.51%, but the southeast is noticeably denser
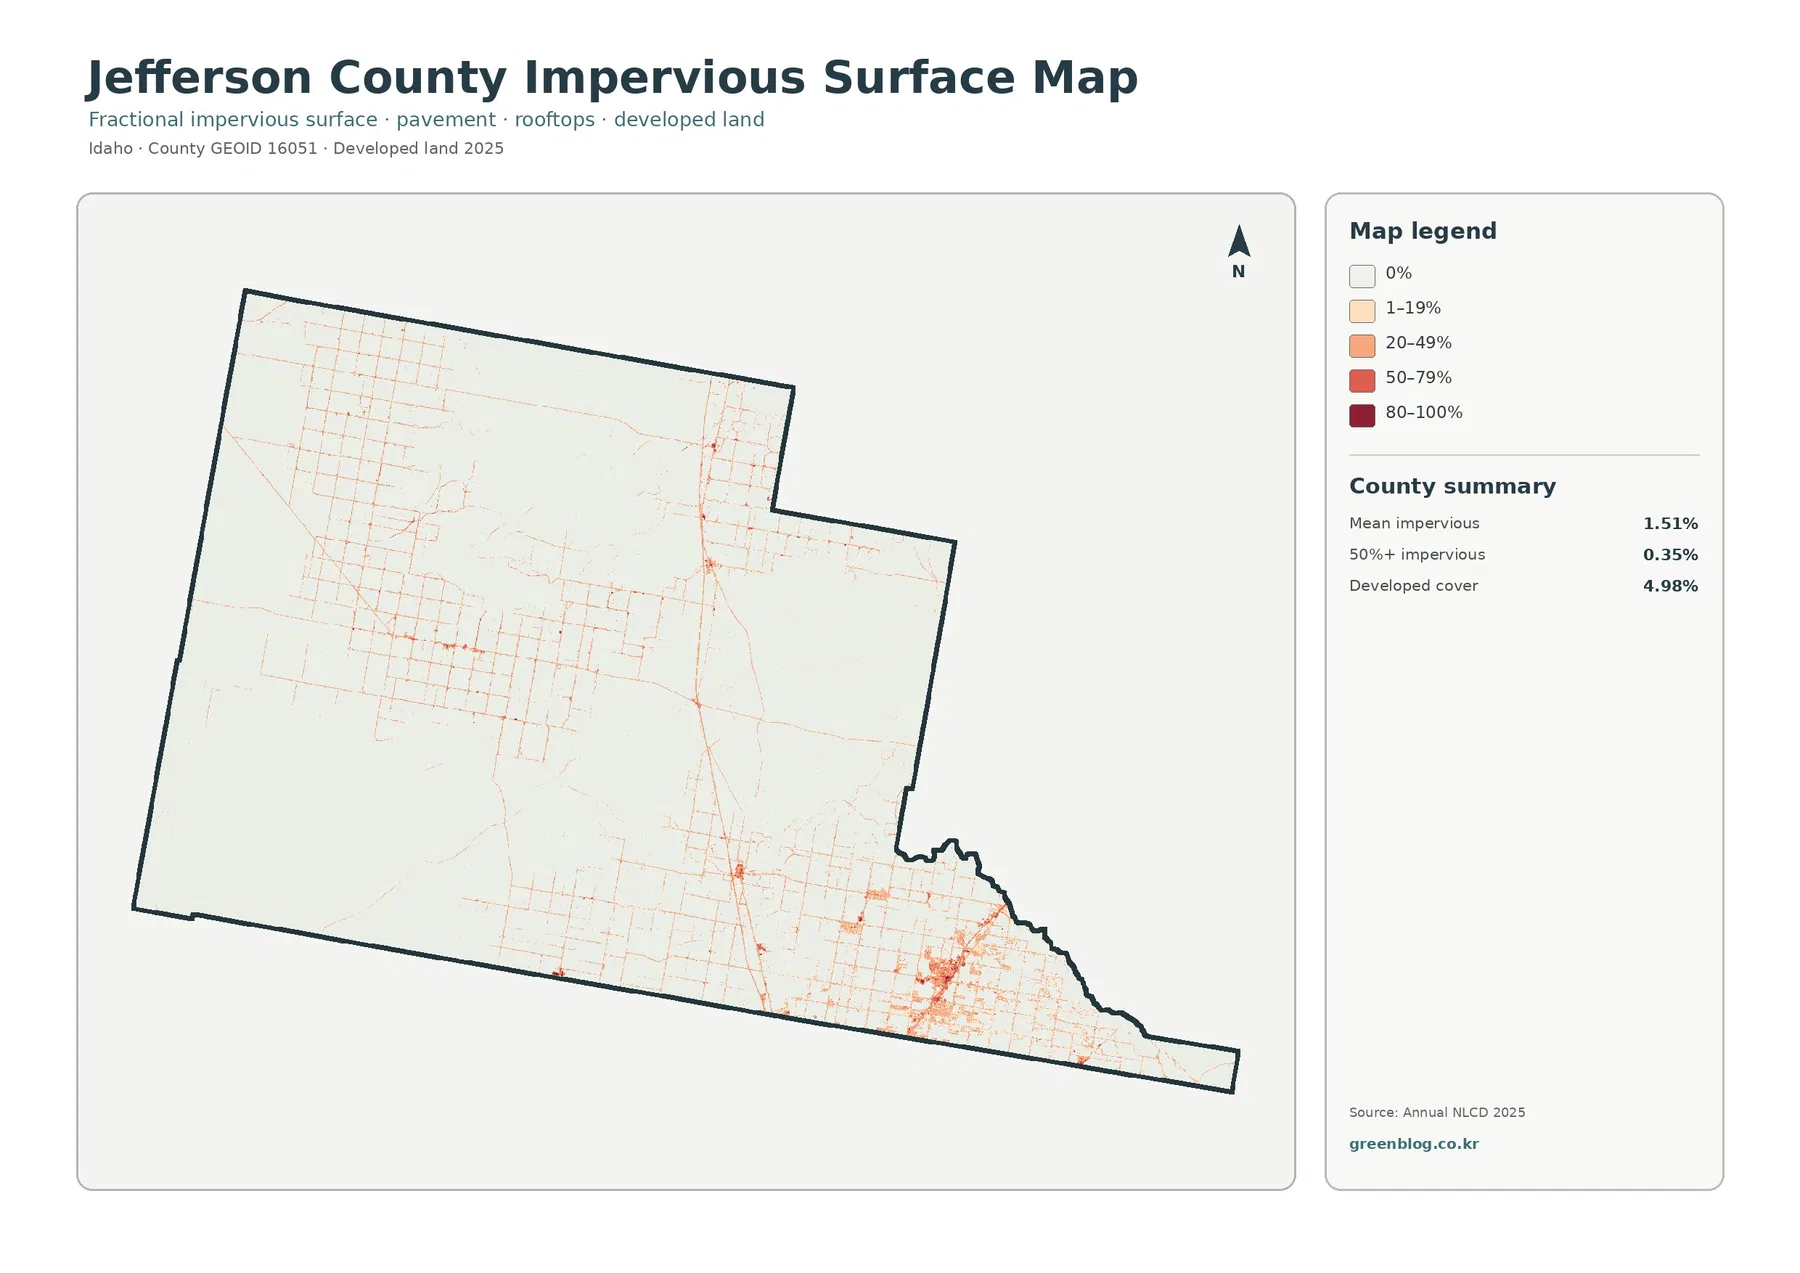
Impervious surface means rooftops, pavement, parking areas, and similar surfaces that water does not easily soak through. Jefferson County has a mean impervious value of 1.51%. Areas where a cell is at least 50% impervious account for 0.35%, while the broader developed land-cover class covers 4.98%.
The southeast has the most obvious cluster of darker impervious values, matching the Rigby area and its surrounding road network. Across agricultural districts, straight road lines remain visible but are less intense than the compact southeast concentration. Much of the shrubland interior is very pale, indicating little hard-surface coverage at this scale.
Developed land and impervious cover are related but not interchangeable. A developed 30-meter cell can include lawns, soil, trees, or other permeable ground in addition to buildings and pavement. That is why the 4.98% developed share should not be described as 4.98% concrete or asphalt.
The Snake River corridor adds another reason to separate land cover from flood and planning maps
Jefferson County’s comprehensive plan identifies the Snake River as an important natural and historic resource and calls for attention to floodplain and natural-feature preservation. The county’s hazard-mitigation material also discusses flood risk along the Snake River and Henry’s Fork systems. Those documents provide useful context for the water corridors visible toward the southeast.
A land-cover map cannot replace a floodplain map. Blue water and teal wetlands identify surface classes, while flood hazard depends on hydrology, elevation, levees, flow conditions, and mapped flood zones. Anyone using these maps for planning should treat the land-cover layer as a background reference and consult official flood and zoning information separately.
The 14.99% class difference is dominated by “other difference,” not forest loss
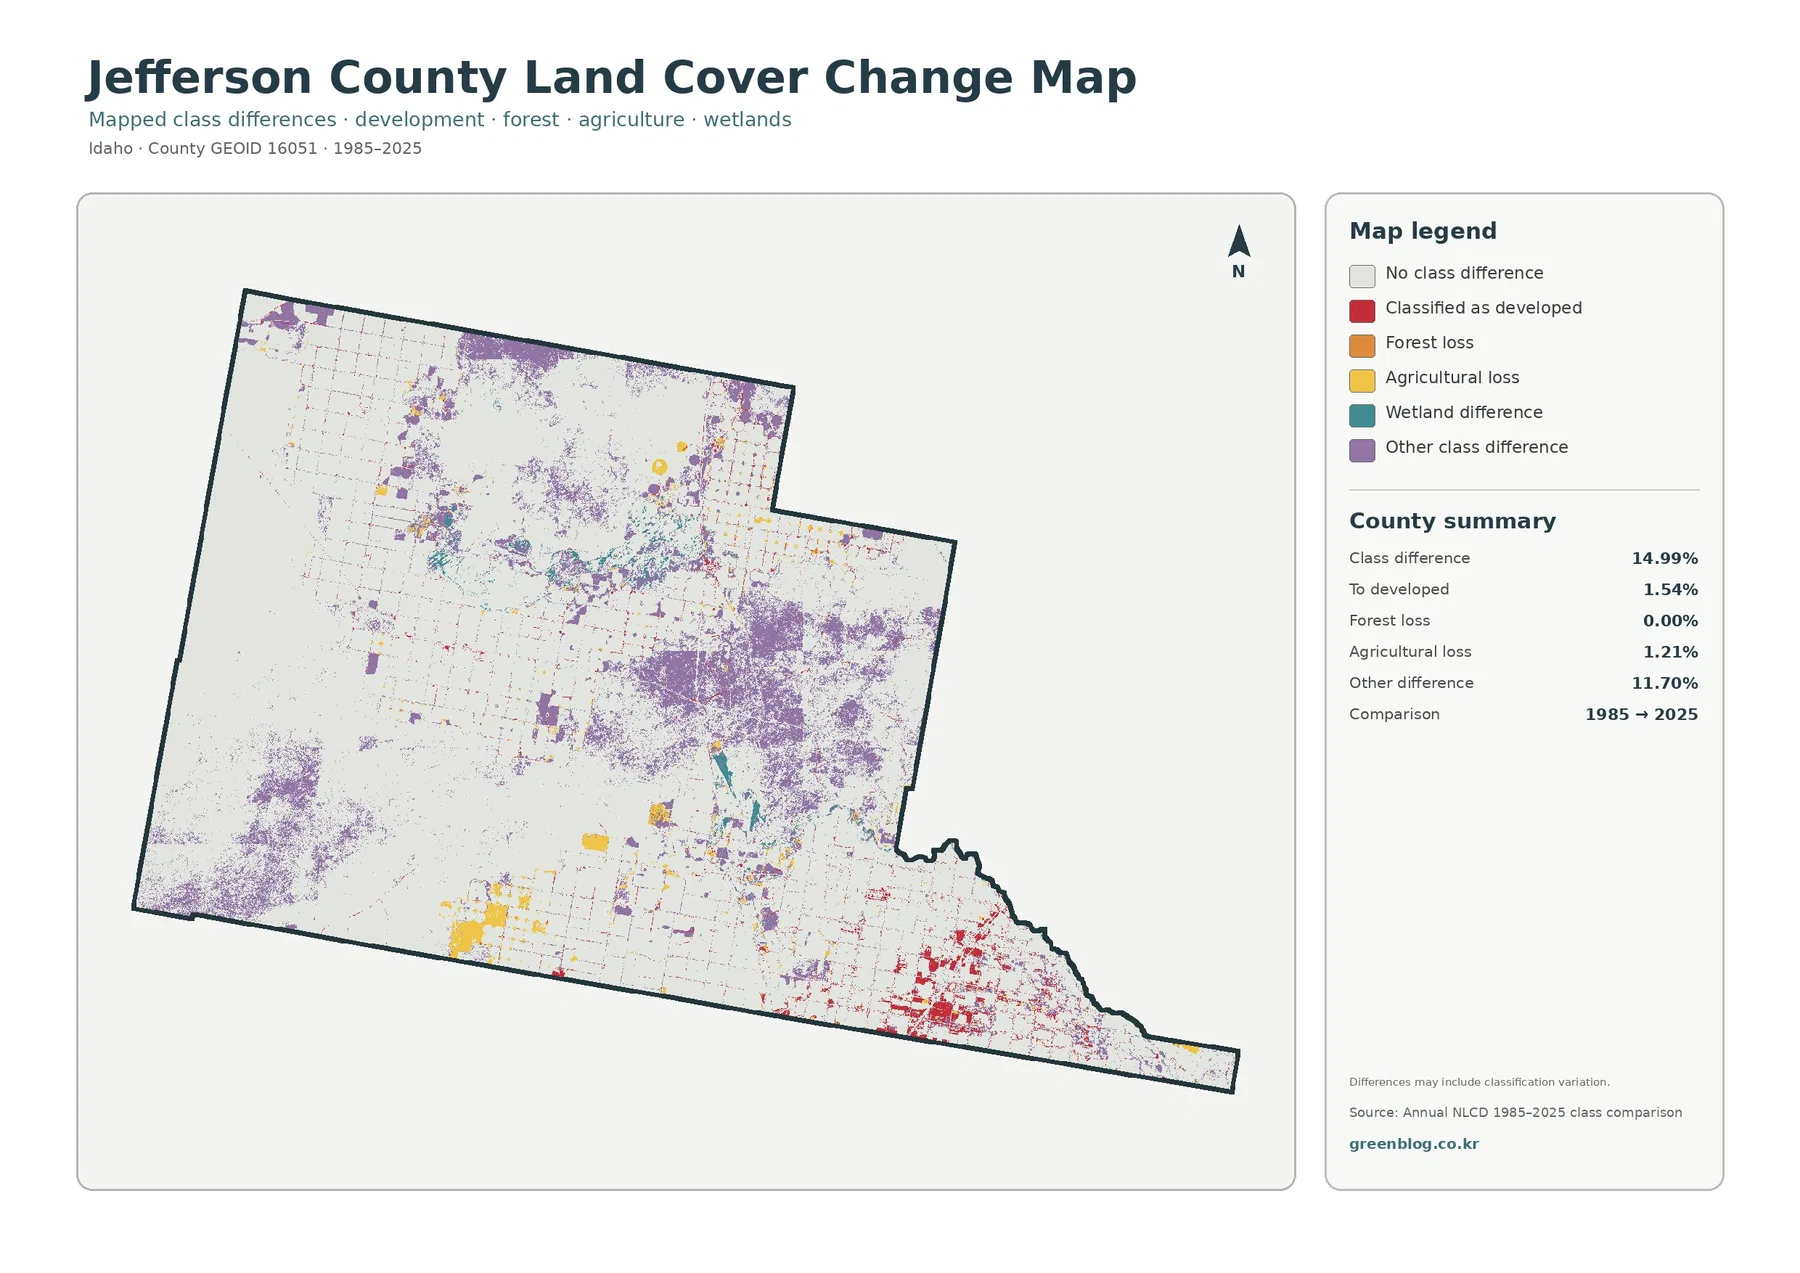
The long-term comparison reports an overall class difference of 14.99%. White cells remain in the same broad class between 1985 and 2025. Purple “other class difference” is the largest listed component at 11.70%, while areas classified to developed account for 1.54% and the agricultural-loss category accounts for 1.21%.
Forest loss is listed as 0.00%, which is consistent with forest already being a very small class in the 2025 county summary. Red developed-class differences are most visible in the southeast, with smaller red marks along roads and other settled areas. Purple differences are more widely scattered across the interior, and wetland-related differences appear around the central water complex.
The map explicitly warns that classification variation may be included. Changes in satellite observations, classification methods, mixed cells, water levels, or vegetation conditions can affect the class assigned to a location. The 1.54% developed-category difference should therefore not be reported as a measured development growth rate, and the 1.21% agricultural-loss category is not automatically a permanent loss of farmland.
Use the four maps as complementary views rather than four versions of the same picture
The general land-cover map is the best choice for a countywide summary because it keeps shrubland, agriculture, grassland, development, water, and wetlands together. The forest-and-farmland version is clearer when the question is how farm blocks relate to shrub-and-grass country or the Mud Lake wetland area.
The impervious map is more useful for settlement and transportation questions because it isolates where hard surfaces are concentrated. The change map should be used when the goal is to identify places that deserve follow-up across time. It works best as a screening layer, not as a stand-alone explanation of why land changed.
A 30-meter raster is useful for regional patterns, not parcel-level decisions
Annual NLCD is a raster product, meaning the ground is divided into grid cells and each cell is assigned a representative class. The land-cover layer uses 30-meter cells. A field edge, road, wetland margin, building, and nearby vegetation can all share a cell even though the displayed map uses one category.
That generalization matters most along narrow roads, irrigation features, wetland edges, and the boundaries of developed areas. The maps are suitable for county-scale comparison and environmental education, but they are not parcel surveys. Ownership, zoning, building permissions, water rights, and precise field boundaries require separate official records.
When printing or presenting the maps, keep the legend and summary values visible. A class such as wetlands can cover only 2.97% of the county yet appear visually important because it is clustered and has a contrasting color. Looking at percentage and location together prevents the map’s color emphasis from being mistaken for area dominance.
Frequently Asked Questions
What is the largest land-cover class in Jefferson County?
Shrubland is the largest class in the supplied 2025 summary at 49.31%. Agriculture follows at 35.19%, then grassland at 6.59%, developed land at 4.98%, and wetlands at 2.97%. Forest is only 0.12%.
Why does the Mud Lake area stand out if water and wetlands have small percentages?
Water is 0.77% and wetlands are 2.97%, but much of that cover is concentrated in one visible lake-and-marsh complex. Idaho Fish and Game describes Mud Lake WMA as a mix of lake, shallow flooded wetlands, wet meadows, permanent wetlands, and surrounding sagebrush habitat.
Does 1.54% classified to developed mean development grew by exactly 1.54%?
No. The change map compares classifications from 1985 and 2025 and states that classification variation may be included. The 1.54% value identifies a comparison category, not a complete measurement of development growth. Intermediate annual data and official land-use records are needed to establish timing and cause.
Map File Information
The four original JPG maps for Jefferson County are provided together in one ZIP file.
- Intended Use: printing, county comparison, classroom and presentation reference
Related Maps
Sources and References
- MRLC Annual NLCD Data – annual land-cover and impervious products used for the map set
- USGS Annual NLCD Land Cover Classification – class definitions and 30-meter raster interpretation
- Idaho Fish and Game – Mud Lake WMA – Jefferson County lake, wetland, and habitat context
- University of Idaho Extension – Agriculture in Jefferson County – local crop, forage, livestock, and pasture programs
- Jefferson County Comprehensive Plan – Snake River and county planning context
Green Map creates custom-edited map images using open geographic data sources such as geoBoundaries, Natural Earth, OpenStreetMap, and government open data.
These maps are edited visual materials, not raw data files, and are provided for education, documents, presentations, and graphic reference.