Idaho County’s 2025 land-cover map is defined first by forest. Forest accounts for 57.79% of the county, followed by shrubland at 24.79% and grassland at 12.16%. Agriculture is only 3.27% countywide, yet it is one of the easiest classes to see because much of it is concentrated in the northwest around the Camas Prairie and Grangeville rather than scattered evenly through the forested interior.
This page compares the general land-cover map, a forest-and-farmland view, an impervious-surface map, and a 1985-to-2025 class-difference map. After reviewing the WebP maps on the page, the four original JPG maps are available together in one ZIP for printing, county comparison, classroom use, or presentation reference.
Table of Contents
Forest covers most of the interior while the northwest prairie creates a sharp contrast
The general map is overwhelmingly green through the center, east, north, and much of the south. Forest appears in broad connected blocks rather than as a narrow strip around one edge. The northwest looks very different: large yellow agricultural fields and lighter open-land classes form a more regular pattern around the Camas Prairie. That contrast makes Idaho County unusually easy to divide visually into a prairie farming corner and a much larger mountain-and-forest interior.
Idaho County’s official wildfire planning material describes Grangeville as being on the Camas Prairie. The surrounding landscape to the north, east, and west is described as primarily farmland with relatively level to rolling terrain. South of town, the terrain rises quickly and vegetation changes from open prairie grassland to ponderosa pine and Douglas-fir, then to denser mixed conifer on cooler slopes. That local description closely matches the transition visible on the supplied map.
The broader Nez Perce-Clearwater National Forests also contain a wide range of environments. The Forest Service describes dry, rugged Salmon River canyons, moist cedar forests in the Selway drainage, and other forest and open-land settings across north-central Idaho. This context is useful because the 57.79% forest figure should not be read as one uniform kind of forest. A large county can remain forest-dominated while still containing very different elevations, moisture conditions, and vegetation communities.
The 2025 map separates the large forest core from shrubland, grassland, and the prairie farm area
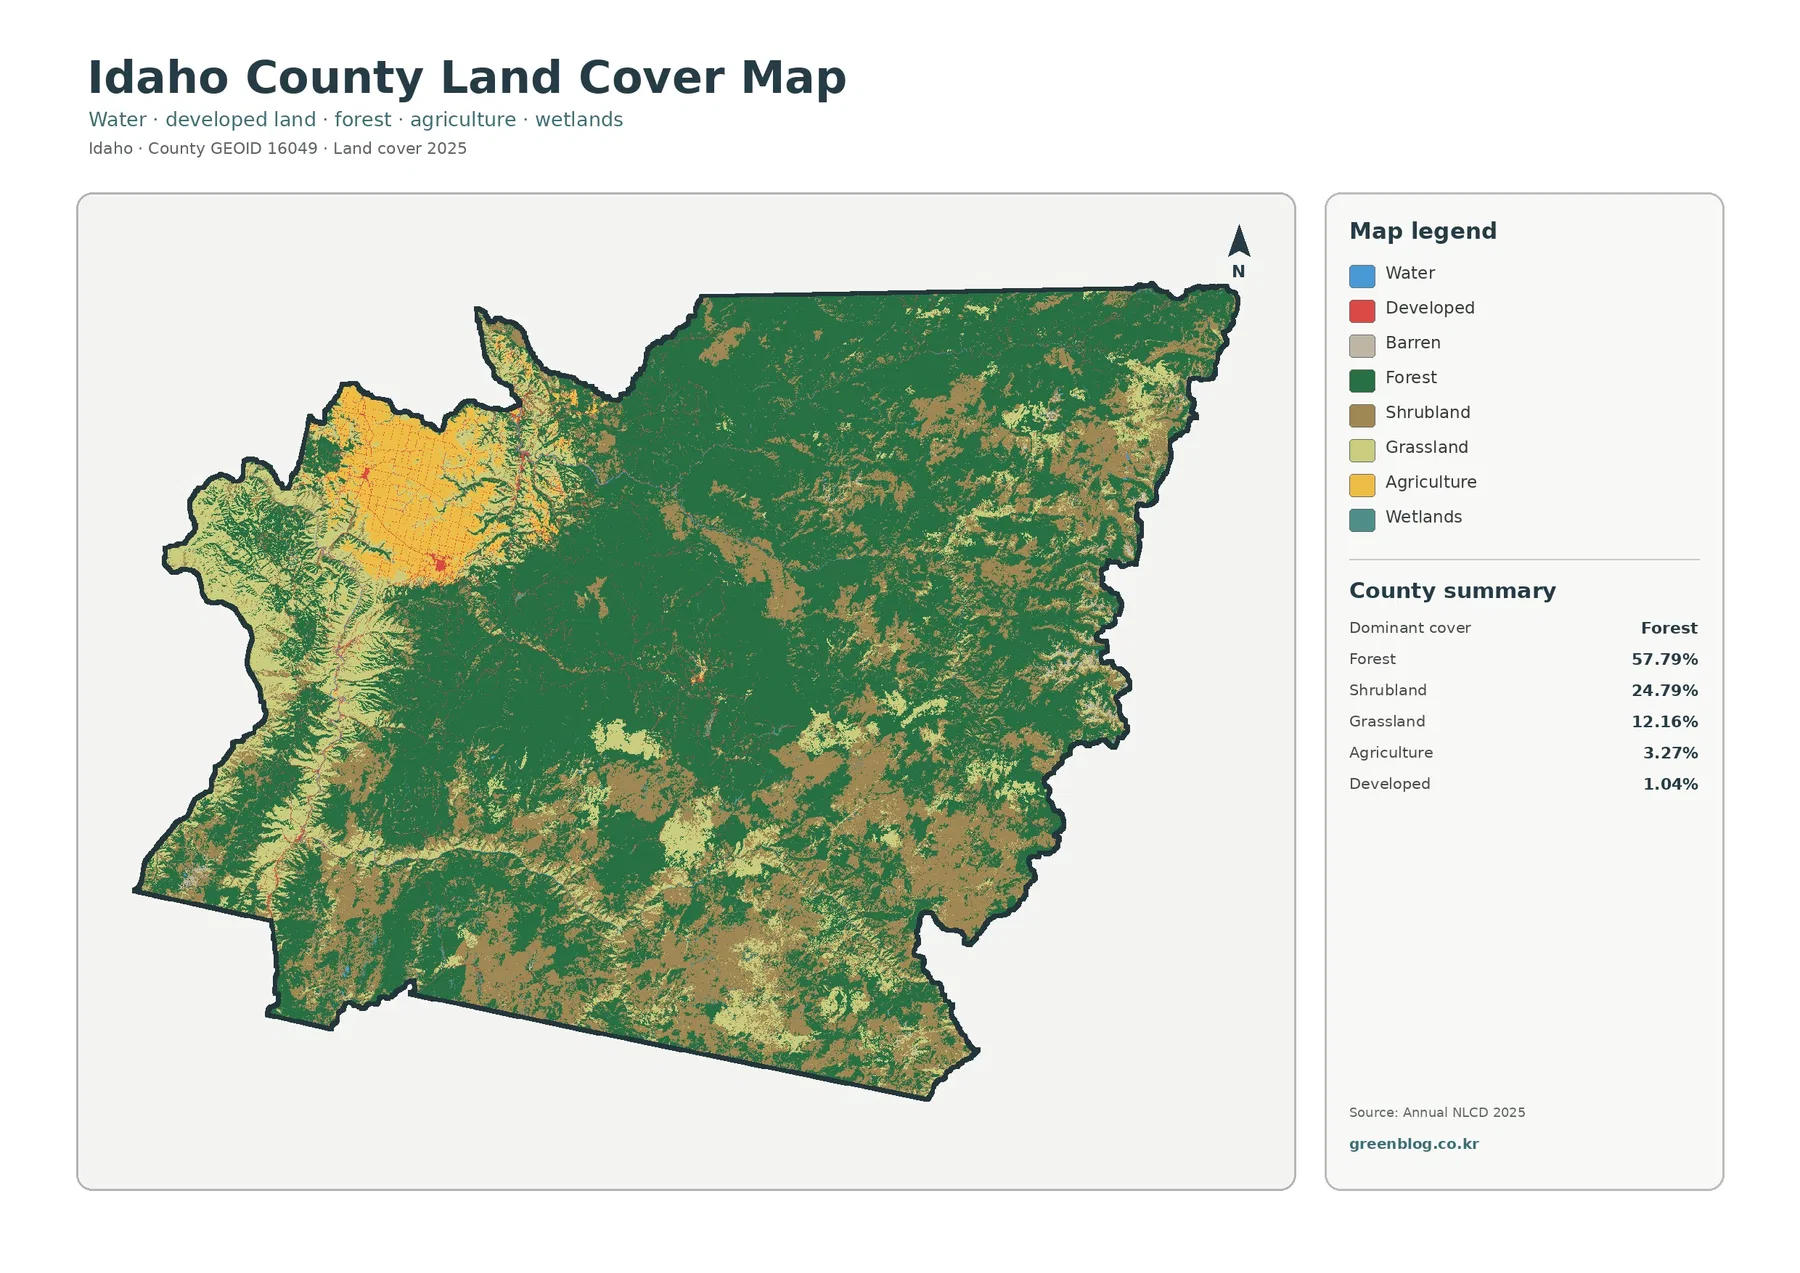
Forest is the dominant class at 57.79%, with shrubland at 24.79% and grassland at 12.16%. Together, those three classes account for most of the county. Agriculture is 3.27% and developed land is 1.04%. Water is 0.21% and wetlands are 0.39%, so the countywide percentages for blue and teal classes are small even though individual river corridors can still be visually important.
Shrubland is especially visible through the south and southeast and appears in irregular patches among forest elsewhere. Grassland is more noticeable along parts of the west and southwest and around open areas near the prairie edge. These classes create broad transitions between dense green forest and the more regular agricultural blocks. The result is not a simple forest-versus-farm county; much of the interior shifts repeatedly between forest, shrubland, and grassland.
The northwest agricultural area has a different geometry from the rest of the map. Large yellow fields and straighter boundaries stand out against the irregular forest and shrub patterns. Official Idaho County planning documents identify this area around Grangeville as part of the Camas Prairie and describe farmland around the community. The map supports the concentration itself, but it does not identify individual crops or parcel ownership.
Water at 0.21% and wetlands at 0.39% occupy little area, yet their contrasting colors help trace portions of drainage corridors. The Nez Perce-Clearwater National Forests include major rivers such as the Salmon and Selway, along with the South Fork Clearwater and many tributaries. The land-cover map can show where water or wetland cells occur, but it is not a hydrography map and should not be used to label every stream or measure channel width.
The Camas Prairie farm block is small by percentage but large enough to shape the northwest corner
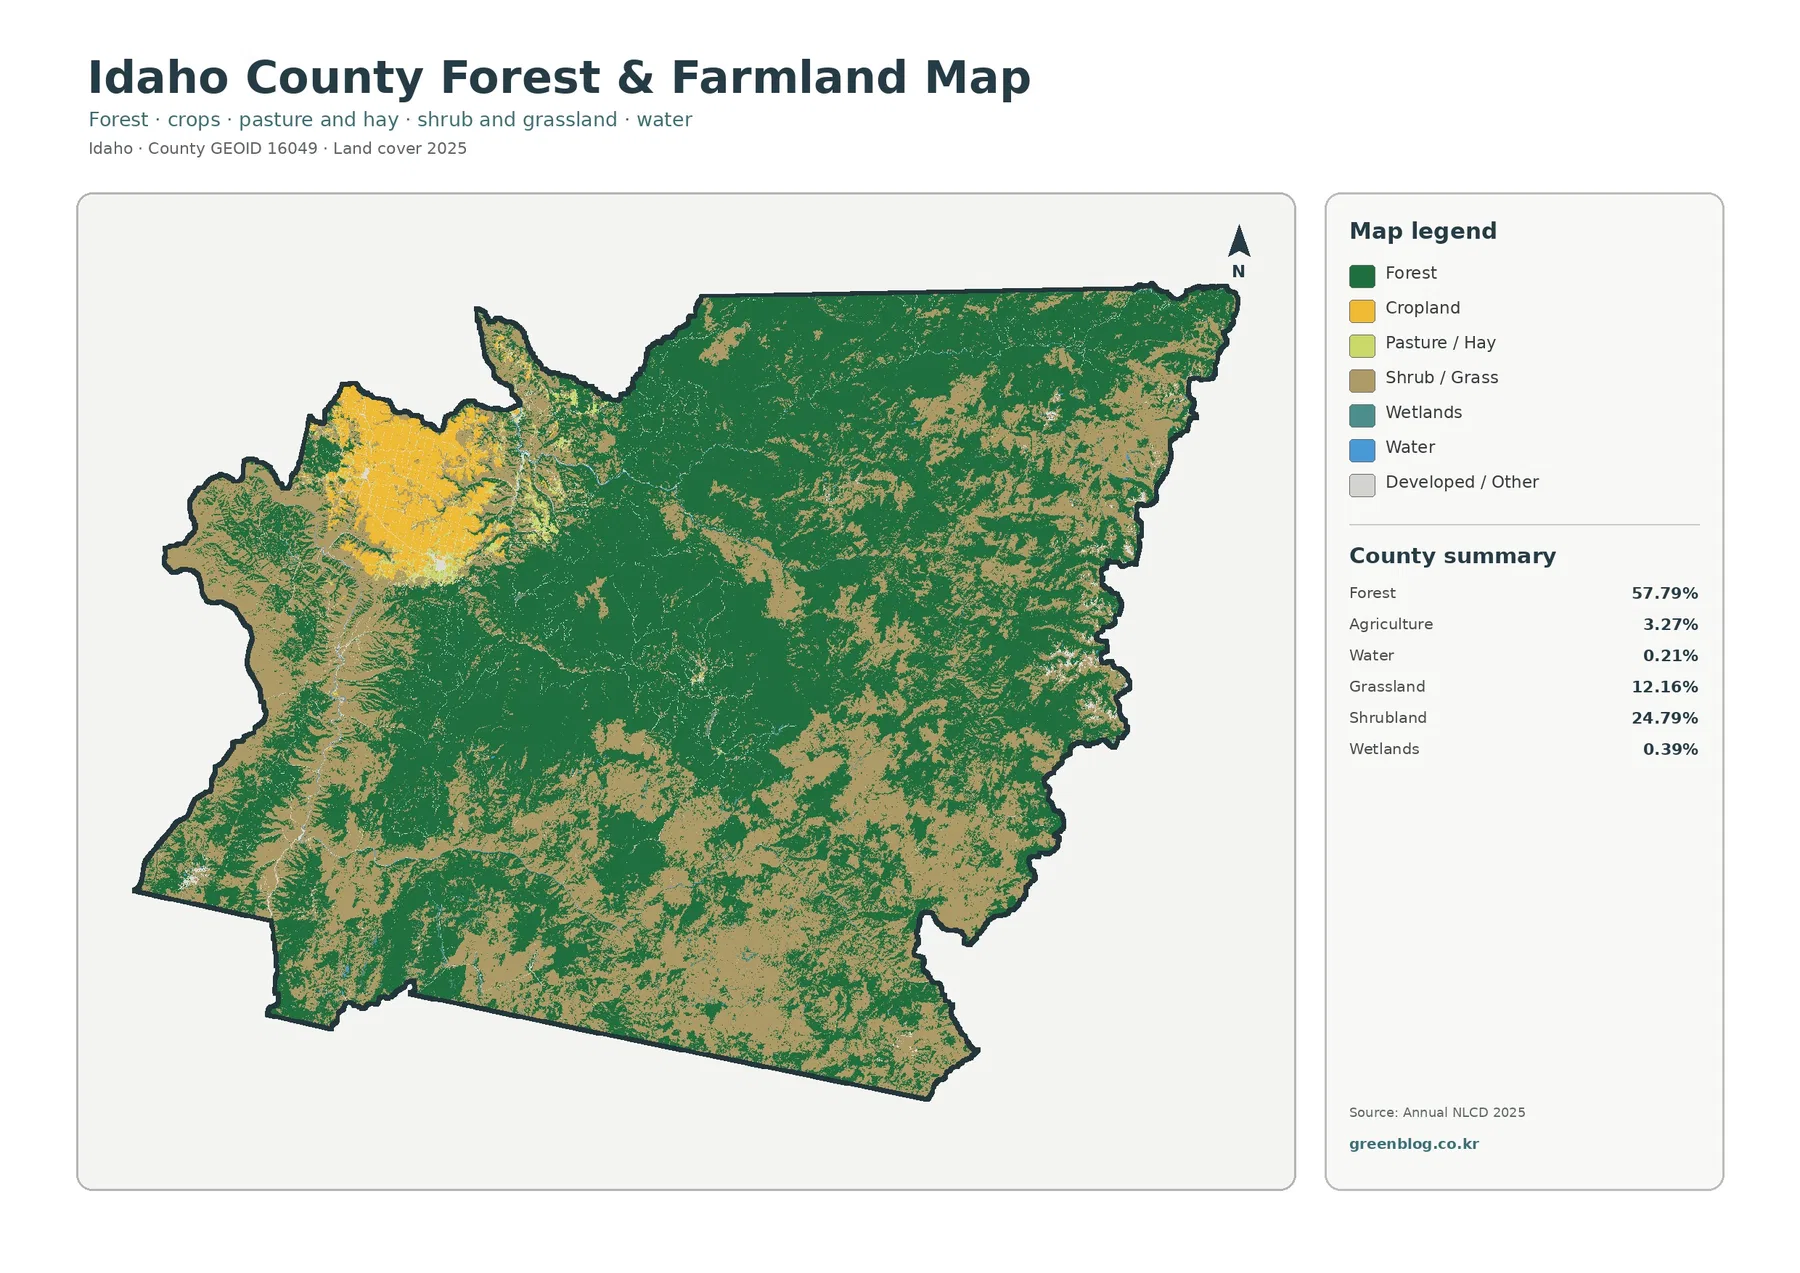
The forest-and-farmland map makes the 3.27% agricultural share more meaningful. Yellow cropland is clustered in one broad northwest area instead of being scattered through the mountain interior. Forest increases rapidly to the south and east of that farm block, creating one of the clearest land-cover boundaries in the county. This concentration is why agriculture looks prominent on the map even though it occupies a small fraction of total county area.
Idaho County’s wildfire protection planning material describes Grangeville at roughly 3,300 feet on the Camas Prairie, with farmland to the north, east, and west and level-to-rolling terrain. It also describes a rapid rise south of the community, where open grassland gives way to dry-site ponderosa pine and Douglas-fir and then to denser mixed conifer on north-facing slopes. That source provides a useful real-world explanation for the abrupt map transition between farm country and forest.
Cropland and pasture or hay remain separate classes on this map. They can both be part of an agricultural landscape, but they should not be combined automatically when discussing the supplied percentages. The yellow cropland class is the strongest agricultural signal in the northwest, while pasture or hay appears in smaller pieces around the prairie and other open areas.
The crisp edge of a mapped farm field is still a raster classification boundary, not a surveyed property line. Annual NLCD uses 30-meter grid cells, so one cell can contain a road, tree line, field edge, structure, and vegetation at the same time. The map is appropriate for finding the county-scale concentration of farming, but parcel boundaries, zoning, ownership, and legal land use require separate authoritative records.
Forest, shrubland, and grassland repeat across the central and southern mountain country
Outside the northwest prairie, Idaho County becomes much less regular in appearance. Forest blocks are broken by broad shrubland and grassland areas, especially through the south and southeast. Smaller open patches also appear within the greener interior. This repeated mixture is important because it shows that a forest-dominated county does not mean continuous closed forest across every ridge and drainage.
The Forest Service describes the Nez Perce-Clearwater landscape as ranging from dry Salmon River canyons to moist cedar forests in the Selway drainage. That wide environmental range helps explain why forest, shrubland, and grassland can occur near one another across such a large area. The supplied map shows the pattern, while the official forest description provides geographic context for why a single county can contain very different kinds of open and wooded terrain.
The map does not include elevation, slope, or vegetation-species layers, so individual brown or light-green patches should not be assigned a specific canyon, elevation band, grazing use, or vegetation community unless a separate source confirms it. Land cover tells the reader what type of surface was classified in a cell, not the complete ecological story behind that surface.
Mean impervious cover of 0.26% leaves most of the county visually almost unbuilt
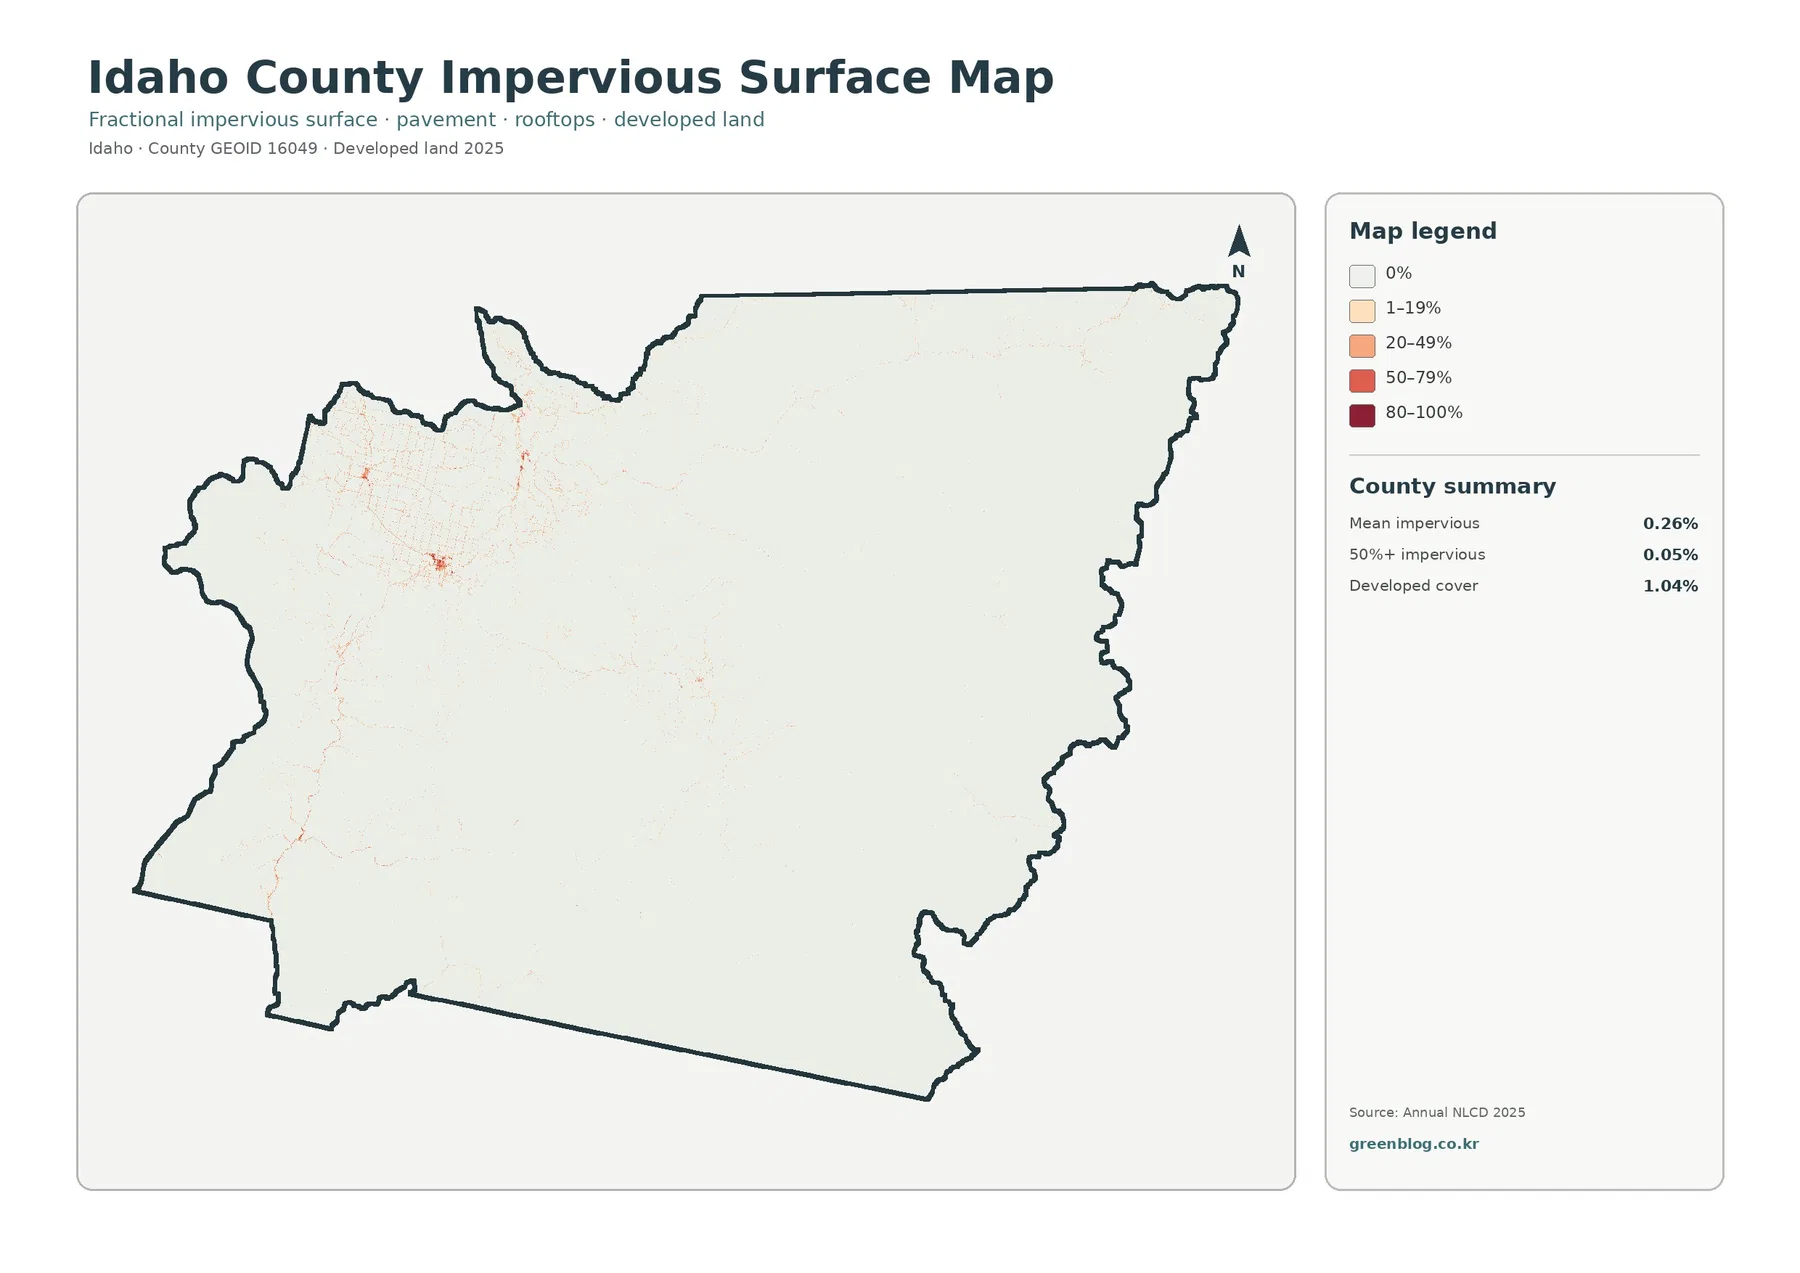
Impervious cover represents surfaces such as pavement, rooftops, and parking areas that do not readily absorb water. Idaho County’s mean impervious value is 0.26%, while cells with 50% or more impervious cover account for only 0.05% of the county. Developed land cover is 1.04%. Those numbers are tiny compared with the forest, shrubland, and grassland shares.
The strongest impervious concentration is in the northwest around Grangeville and the surrounding road network. Thin lines extend away from that area and other small nodes appear deeper in the county, but most of the map remains extremely pale. Instead of a broad connected urban surface, the map shows a few compact developed centers and long, narrow transportation links through a very large rural and forested area.
Developed land at 1.04% is not identical to mean impervious cover at 0.26%. A developed cell can include vegetation, soil, lawns, and other permeable surfaces along with buildings or pavement. Treating every developed cell as asphalt or concrete would exaggerate the actual hard-surface footprint, especially where settlement density is low.
This map is best used to compare where built surfaces are relatively concentrated. It can show that the northwest prairie settlement area is different from the sparsely developed forest interior, but it cannot measure individual building footprints or road widths. Those questions require higher-resolution imagery or authoritative building and transportation data.
The 28.47% class difference highlights where to investigate rather than proving one permanent trend
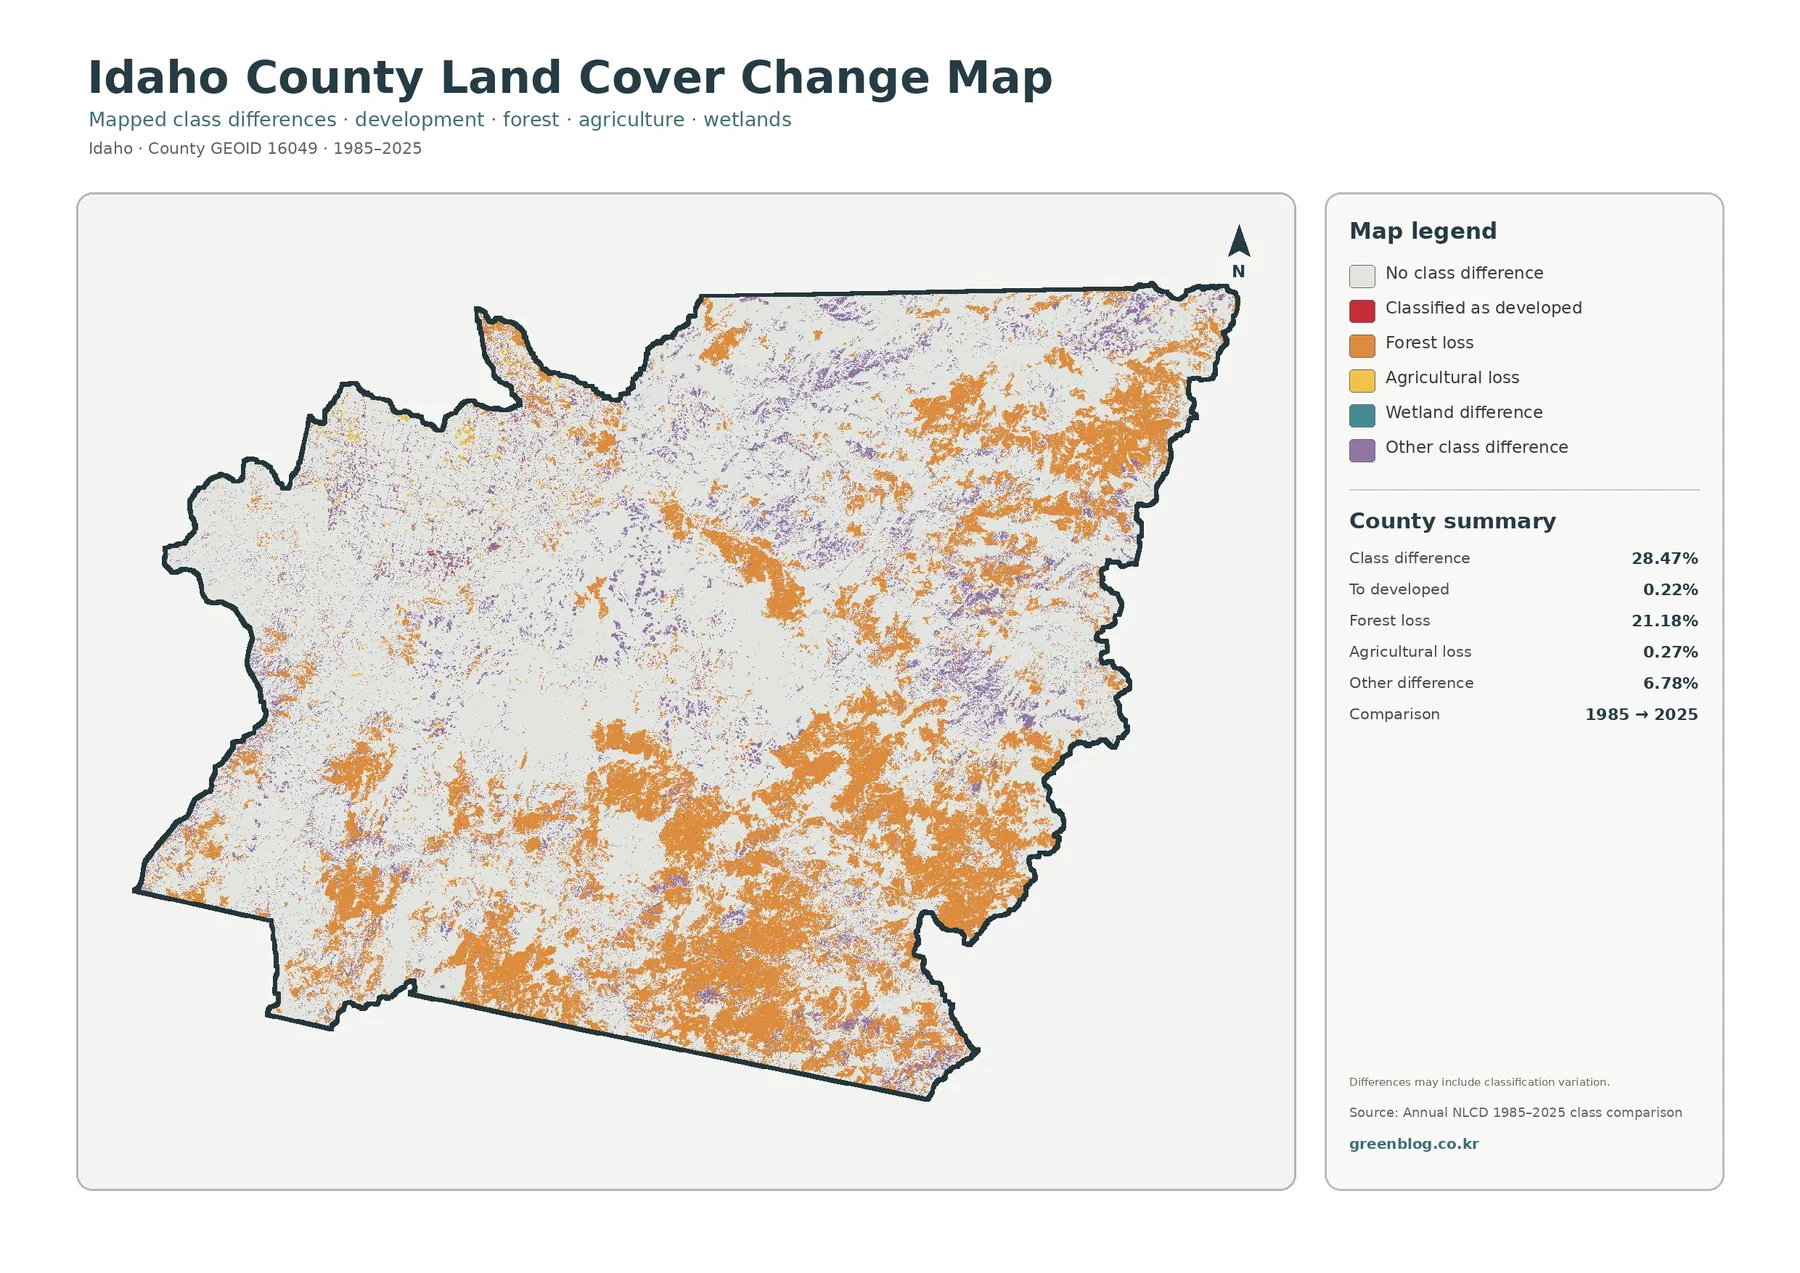
The change map compares broad classifications from 1985 and 2025. White cells remain in the same broad class, while colored cells indicate a difference between the two dates. The overall class difference is 28.47%. Orange forest-loss-category cells form large patches in the east and south and appear in additional areas across the interior, while purple “other class difference” cells are more scattered.
The supplied summary lists 0.22% as classified to developed, 21.18% in the forest-loss category, 0.27% agricultural loss, and 6.78% other class difference. The forest-loss category is by far the largest. It should not, however, be rewritten as “21.18% of Idaho County forest permanently disappeared.” The map itself warns that differences can include classification variation between the two comparison years.
Long comparisons can reflect changes in satellite observations, classification methods, mixed pixels, disturbance and recovery, and the timing of vegetation conditions. Fire, timber activity, insects, drought, or later regrowth can change a cell’s class without representing the same kind of permanent land conversion. The safe interpretation is that the orange cells were forest in one broad classification and another class in the later comparison, not that one cause has already been established.
This distinction matters especially in a county where forest covers 57.79% of the land. A class difference affecting only part of that very large forest area can still produce a broad orange pattern on the map. To determine when a change happened and whether it persisted, the intermediate Annual NLCD years and appropriate fire or forest-management records should be reviewed.
Different maps answer different questions about the prairie corner and the forest interior
For a countywide overview, the general land-cover map is the strongest starting point. It places the 57.79% forest majority, the broad shrubland and grassland areas, and the concentrated northwest agriculture in one frame. It also works well for same-year comparisons with another Idaho county because the major classes are shown together.
The forest-and-farmland map is more useful when the question concerns the Camas Prairie, cropland, pasture or hay, or the boundary between farm country and mountain forest. Its simplified legend prevents the relatively small agricultural share from being lost inside the much larger forest and shrub classes. It is particularly effective for explaining why 3.27% agriculture can still dominate the appearance of one corner of the county.
The impervious map should be chosen when settlement and roads are the focus. A 0.26% mean value sounds almost negligible, but the map shows exactly where those hard surfaces cluster. The change map serves a separate purpose: it identifies cells whose broad classification differs between 1985 and 2025, and it requires more caution because class difference is not the same as a measured cause or a permanent conversion.
Land-cover colors do not establish ownership, zoning, or parcel boundaries
Annual NLCD is a raster product. The land surface is divided into 30-meter cells, and each cell receives a representative class. One cell can contain trees, a road, a building, bare soil, or water edge at the same time even though the final map displays one dominant category. A sharp color edge on screen should therefore not be treated as a surveyed property line.
Forest color also does not prove National Forest ownership, and agriculture color does not prove agricultural zoning. Land cover describes the physical surface that was classified. Ownership, legal land use, development permissions, conservation designations, and parcel boundaries must be checked in separate authoritative records.
Small countywide percentages can also be misleading if the map is viewed only at one zoom level. Water at 0.21%, wetlands at 0.39%, and developed land at 1.04% may nearly disappear when the map is reduced, while strong blue or red contrast can make an individual feature appear more important than its area share. Reading the percentages and the geographic pattern together gives a more balanced interpretation.
Match the year and map type when printing or comparing Idaho County with another place
For printing, the general land-cover map works well as the first page because the legend and summary connect directly to the dominant colors. Forest at 57.79%, shrubland at 24.79%, and grassland at 12.16% give readers an immediate numerical guide to the county’s broad landscape. A topic-specific map can then be added when the discussion turns to farming, settlement, or long-term class differences.
For county comparisons, keep the year and map type consistent. Comparing the 2025 Idaho County general map with another county’s 2025 general map makes differences in forest, shrubland, agriculture, and developed land meaningful. Comparing a single-year land-cover map with a 1985-to-2025 difference map would mix two different kinds of information.
In a classroom or presentation, Idaho County is useful for showing how one county can contain a concentrated agricultural prairie and a much larger forested mountain interior. It also provides a clear example of the difference between physical land cover and legal land use. The maps show what covers the ground, not who owns the land or what zoning rules apply.
Frequently Asked Questions
What is the largest land-cover class in Idaho County?
Forest is the largest class in the supplied 2025 summary at 57.79%. Shrubland follows at 24.79%, grassland at 12.16%, agriculture at 3.27%, and developed land at 1.04%. The map shows that forest dominance across most of the county while the northwest Camas Prairie has a much more agricultural appearance.
Why is agriculture so visible if it covers only 3.27%?
Agriculture is concentrated around the Camas Prairie and Grangeville rather than spread evenly through the county. Idaho County’s official wildfire planning material describes farmland to the north, east, and west of Grangeville. Large connected yellow farm blocks stand out strongly against the surrounding forest and open natural classes.
Does the 21.18% forest-loss category equal permanent forest loss?
No. The change map compares broad classes from 1985 and 2025 and explicitly warns that classification variation may be included. The 21.18% figure identifies cells placed in the forest-loss comparison category. Determining the timing, cause, and permanence of actual forest change requires intermediate annual data and relevant fire or forest-management records.
Map File Information
The four original JPG maps for Idaho County are provided together in one ZIP file.
- Intended Use: printing, county comparison, classroom and presentation reference
Related Maps
Sources and References
- MRLC Annual NLCD Data – annual land-cover and impervious products used for the supplied map set
- USGS Annual NLCD Land Cover Classification – land-cover class definitions and 30-meter raster interpretation
- Idaho County Wildfire Protection Plan – Chapter 4 – Grangeville, Camas Prairie farming, and the transition into forest south of the prairie
- Nez Perce-Clearwater National Forests – regional forest, canyon, river, and watershed context in north-central Idaho
Green Map creates custom-edited map images using open geographic data sources such as geoBoundaries, Natural Earth, OpenStreetMap, and government open data. These maps are edited visual materials, not raw data files, and are provided for education, documents, presentations, and graphic reference.