Elmore County’s 2025 land cover is defined by broad grassland and shrubland, with forest concentrated toward the north and east and more agriculture and development in the south. Grassland is the largest class at 41.30%, followed closely by shrubland at 37.59%. Forest accounts for 10.92%, agriculture for 6.32%, and developed land for 2.24%.
This page brings together four views: general land cover, forest and farmland, impervious surface and developed land, and a 1985-to-2025 class-difference map. The WebP maps can be reviewed on the page, and the four original JPG maps are available together in one ZIP for printing, classroom use, presentations, and county comparisons.
Table of Contents
Grassland and shrubland together cover most of Elmore County
The strongest countywide pattern is the combined extent of grassland and shrubland. Together they make up almost four-fifths of the mapped area. Light grassland is especially broad in the west, southwest, and central county, while brown shrubland becomes more extensive through the center, east, and parts of the north. The two classes often touch or intermix, creating large transitions between open country and the more concentrated forest blocks.
Although both classes represent relatively open vegetation, they should not be treated as the same land cover. Grassland is shown separately from shrubland because the dominant vegetation differs. On this map, keeping the colors separate makes it easier to see where the county shifts from grassy open ground into shrub-dominated country before reaching forest or farmland. The map does not identify plant species, grazing intensity, or ownership within those areas.
University of Idaho Extension in Elmore County provides programs on crop production, irrigation management, livestock management, soil, and related agricultural topics. That local work gives useful context for a county where extensive open rangeland-like cover sits beside a smaller but clearly visible agricultural area. It does not mean that every grassland or shrubland cell is actively grazed, because land cover is a physical surface classification rather than a ranching or land-use record.
The 2025 map shows a north-and-east forest pattern above a more open south
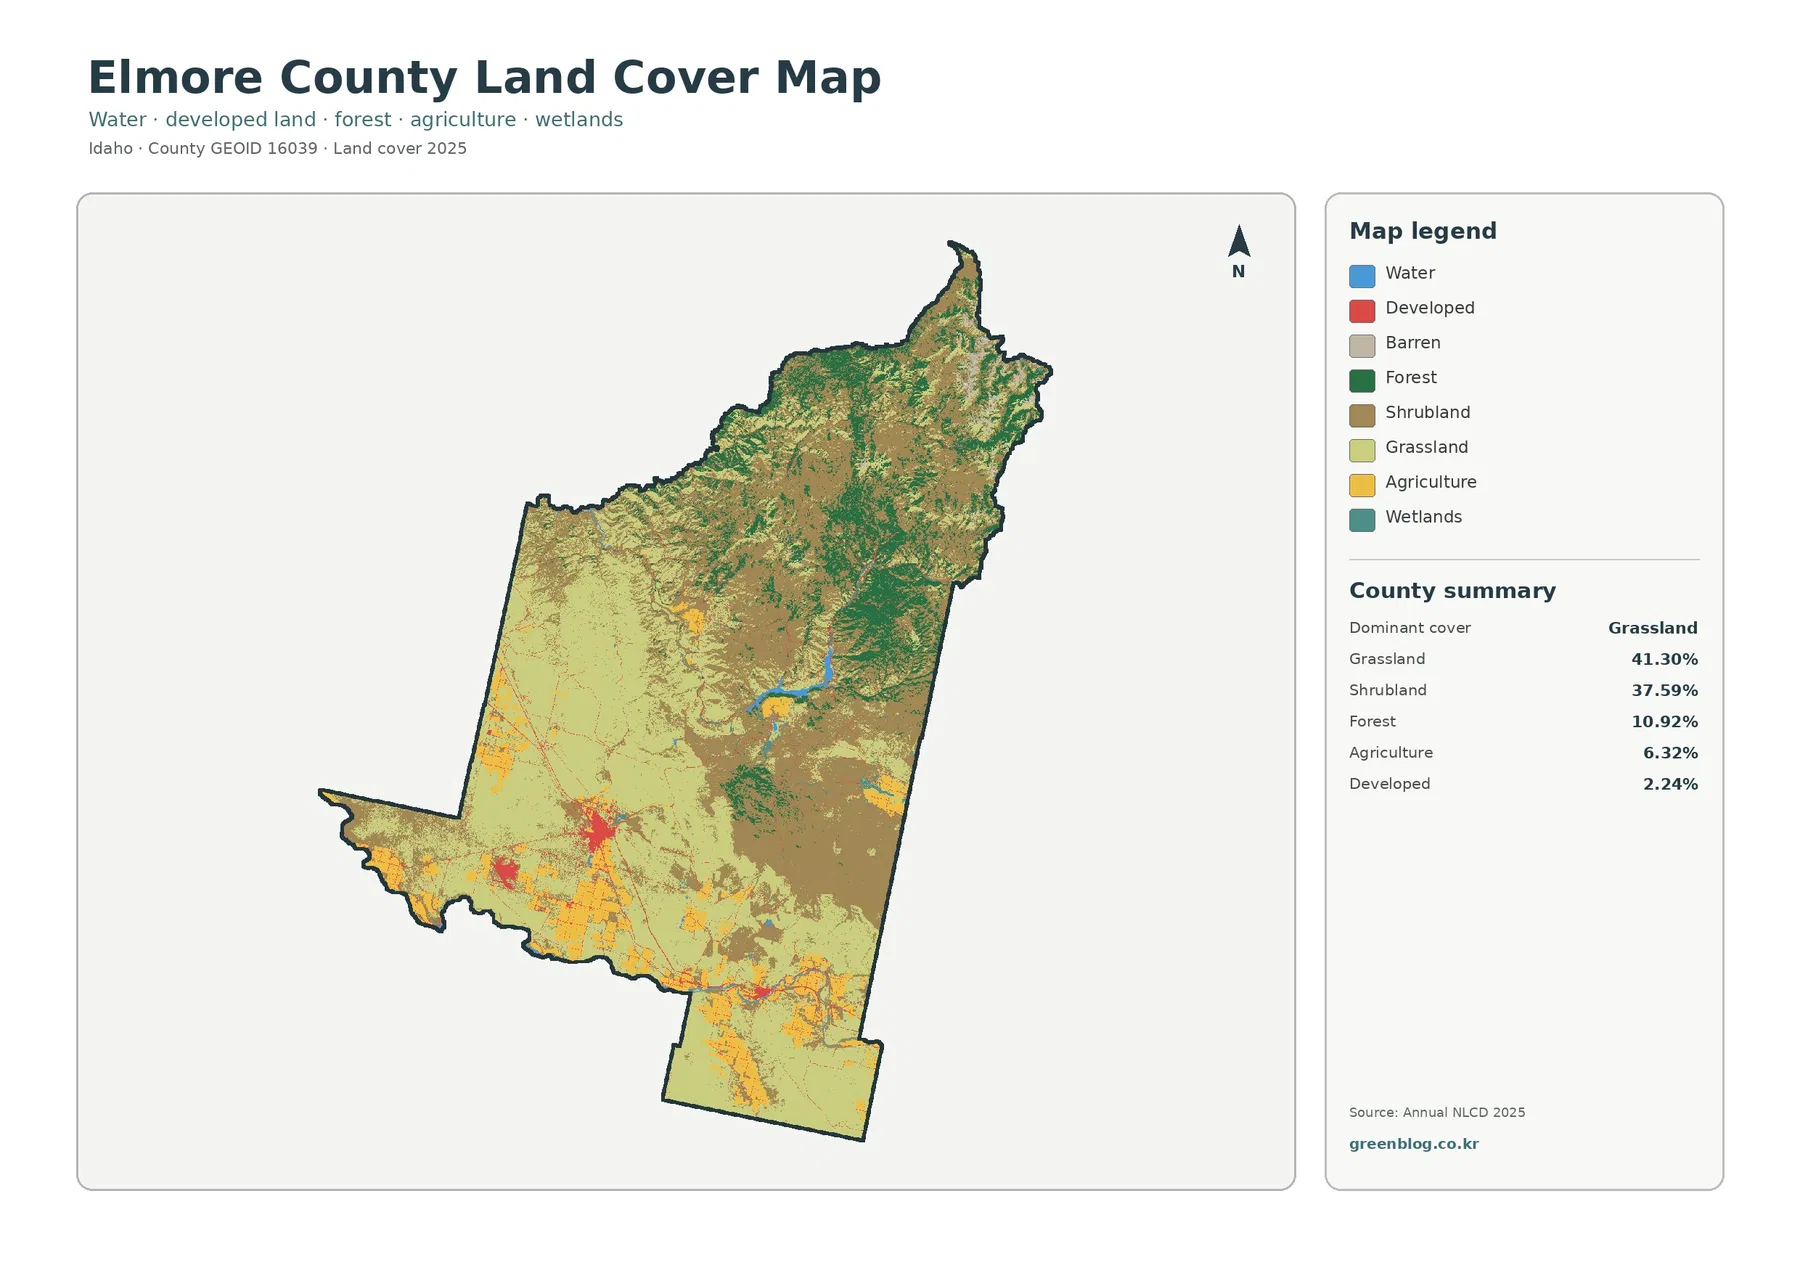
The general map makes the county’s internal contrast easy to see. Green forest is concentrated in the north and especially along the eastern side, where larger forest blocks interrupt the surrounding shrubland. Farther south, the map becomes much more open, with grassland and shrubland covering most of the surface. Agricultural yellow and developed red become more common near the southern and southwestern portions of the county.
Boise National Forest includes land in Elmore County, and the U.S. Forest Service describes the forest as a landscape that contains both forest and grassland across a large range of elevations. The Mountain Home Ranger District also manages National Forest lands in this part of Idaho. That official information helps place the northern and eastern forest areas in a broader geographic context, but the green NLCD pixels should not be interpreted as exact National Forest ownership boundaries.
Agriculture covers 6.32% of the county, yet it is easy to see because it is clustered. Yellow farm areas form patches and blocks in the south and southwest, with additional smaller concentrations farther north. The spatial concentration matters more than the countywide share alone: a relatively small class can be visually important when it occurs in a limited set of valleys or plains rather than being scattered evenly.
Water occupies a small part of the county, but blue features stand out strongly against the tan, green, and yellow land-cover colors. A notable water body appears in the east-central part of the map, with smaller water features elsewhere. At this scale, the map is useful for locating water relative to the surrounding land cover, but it is not intended to map narrow streams or shoreline details with survey-level accuracy.
The forest-and-farmland view makes the southern agricultural blocks easier to isolate
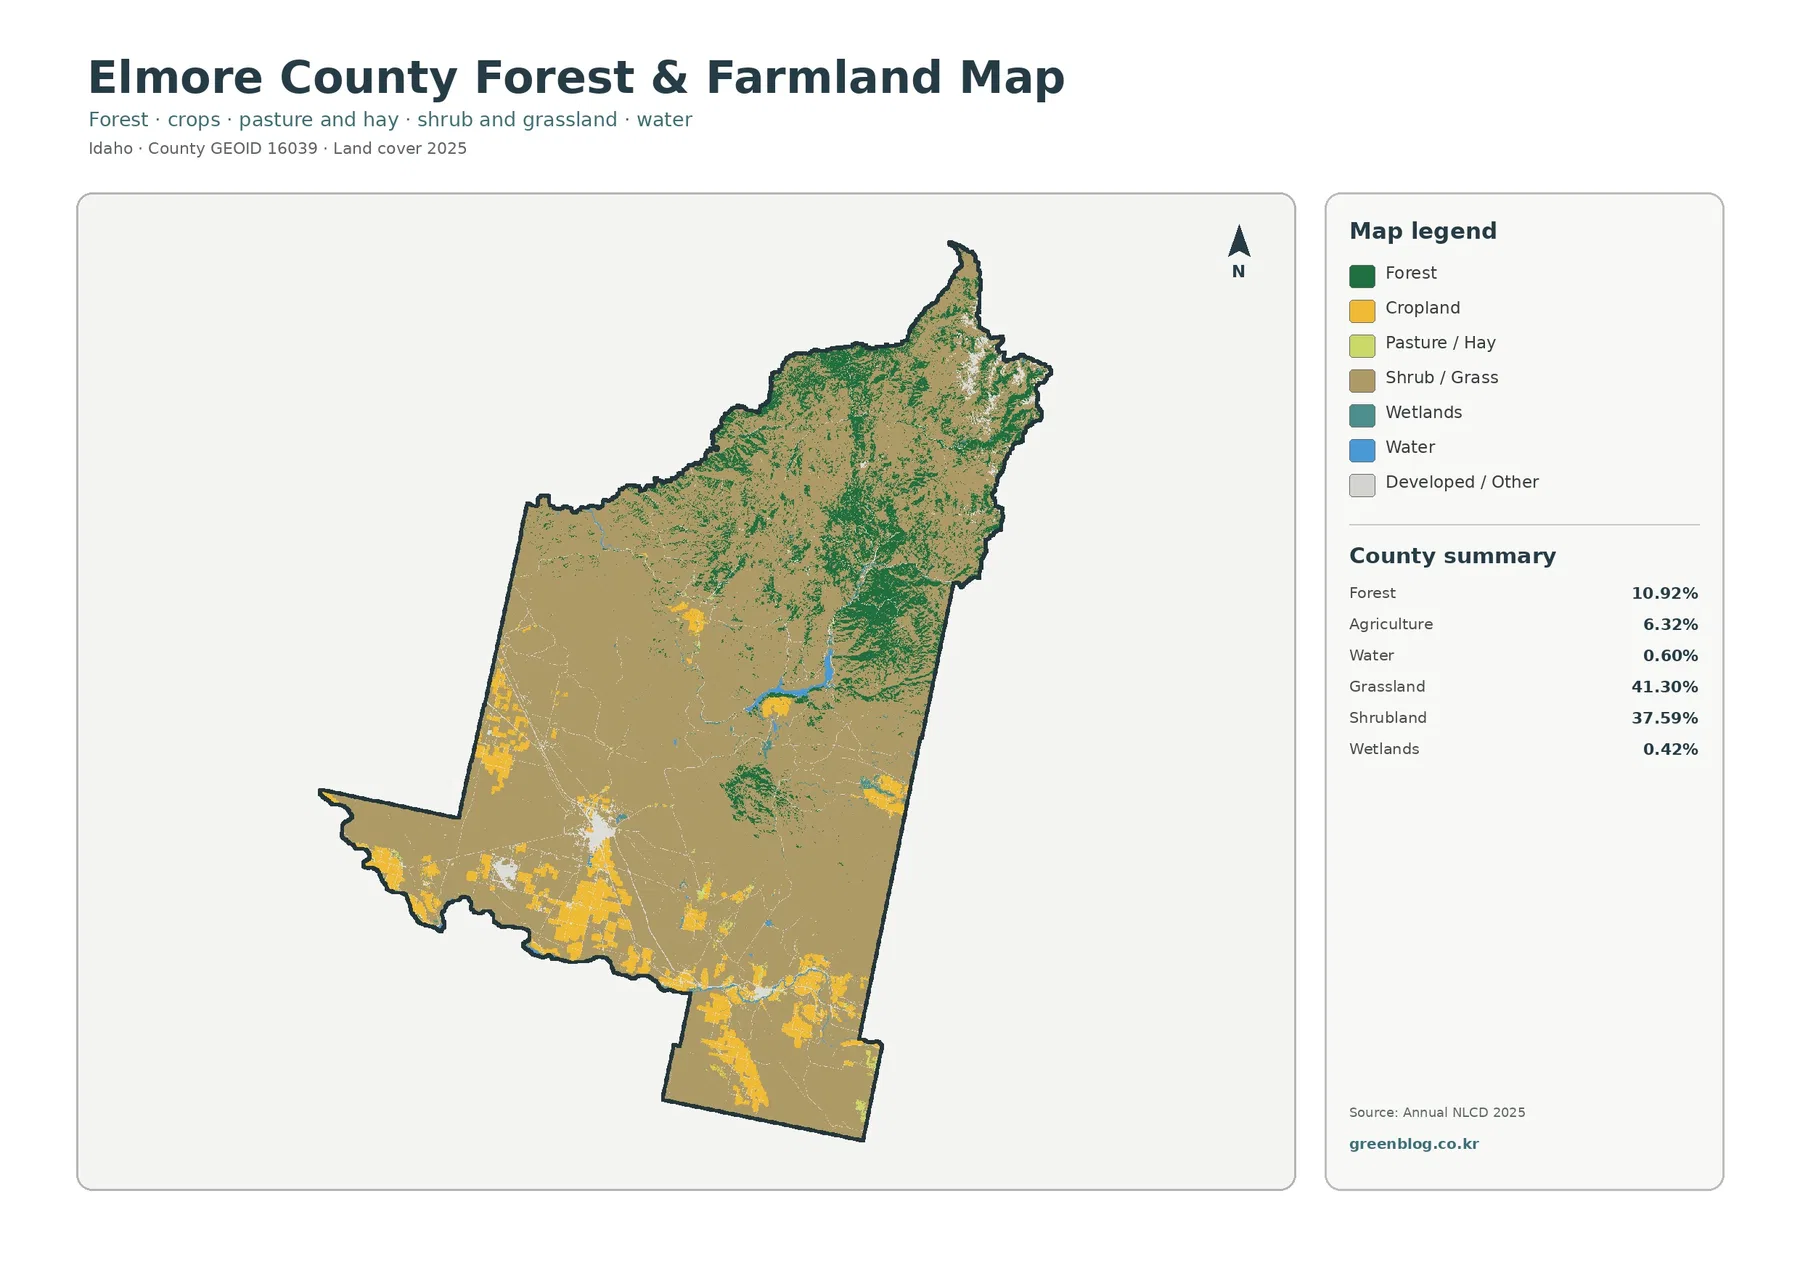
On the forest-and-farmland map, shrubland and grassland are combined into one broad background. That simplification makes the yellow cropland and light pasture or hay classes much easier to find. The largest agricultural concentrations occur in the southern and southwestern county, where farm blocks and linear field patterns stand out from the surrounding open land. Smaller agricultural patches also appear in the interior.
University of Idaho Extension specifically lists crop production, variety selection, pest and disease management, fertilization, irrigation management, and livestock management among its Elmore County agricultural services. Those topics match the practical importance of working land in the county without requiring the map to identify individual crops. The map shows land-cover classes, not crop rotations, water rights, field ownership, or current farm management decisions.
Forest is much more concentrated than the open shrub-and-grass category. Dark green areas form a broad northern and eastern network, with another visible patch in the central-east. Because the map reduces the number of background classes, the transition between forest and farm country is easier to follow than on the general land-cover view. It is particularly useful when the purpose is to compare working land with forested uplands rather than every individual NLCD class.
The edges of the yellow agricultural areas should not be read as parcel lines. Annual NLCD is a raster product, so a single grid cell can contain more than one surface type even though the map assigns it one representative class. A field edge may share a cell with a road, canal, house, tree line, or bare soil. County parcel and zoning records are the appropriate sources when a legal boundary matters.
Impervious cover is low overall but strongly concentrated in the southwest
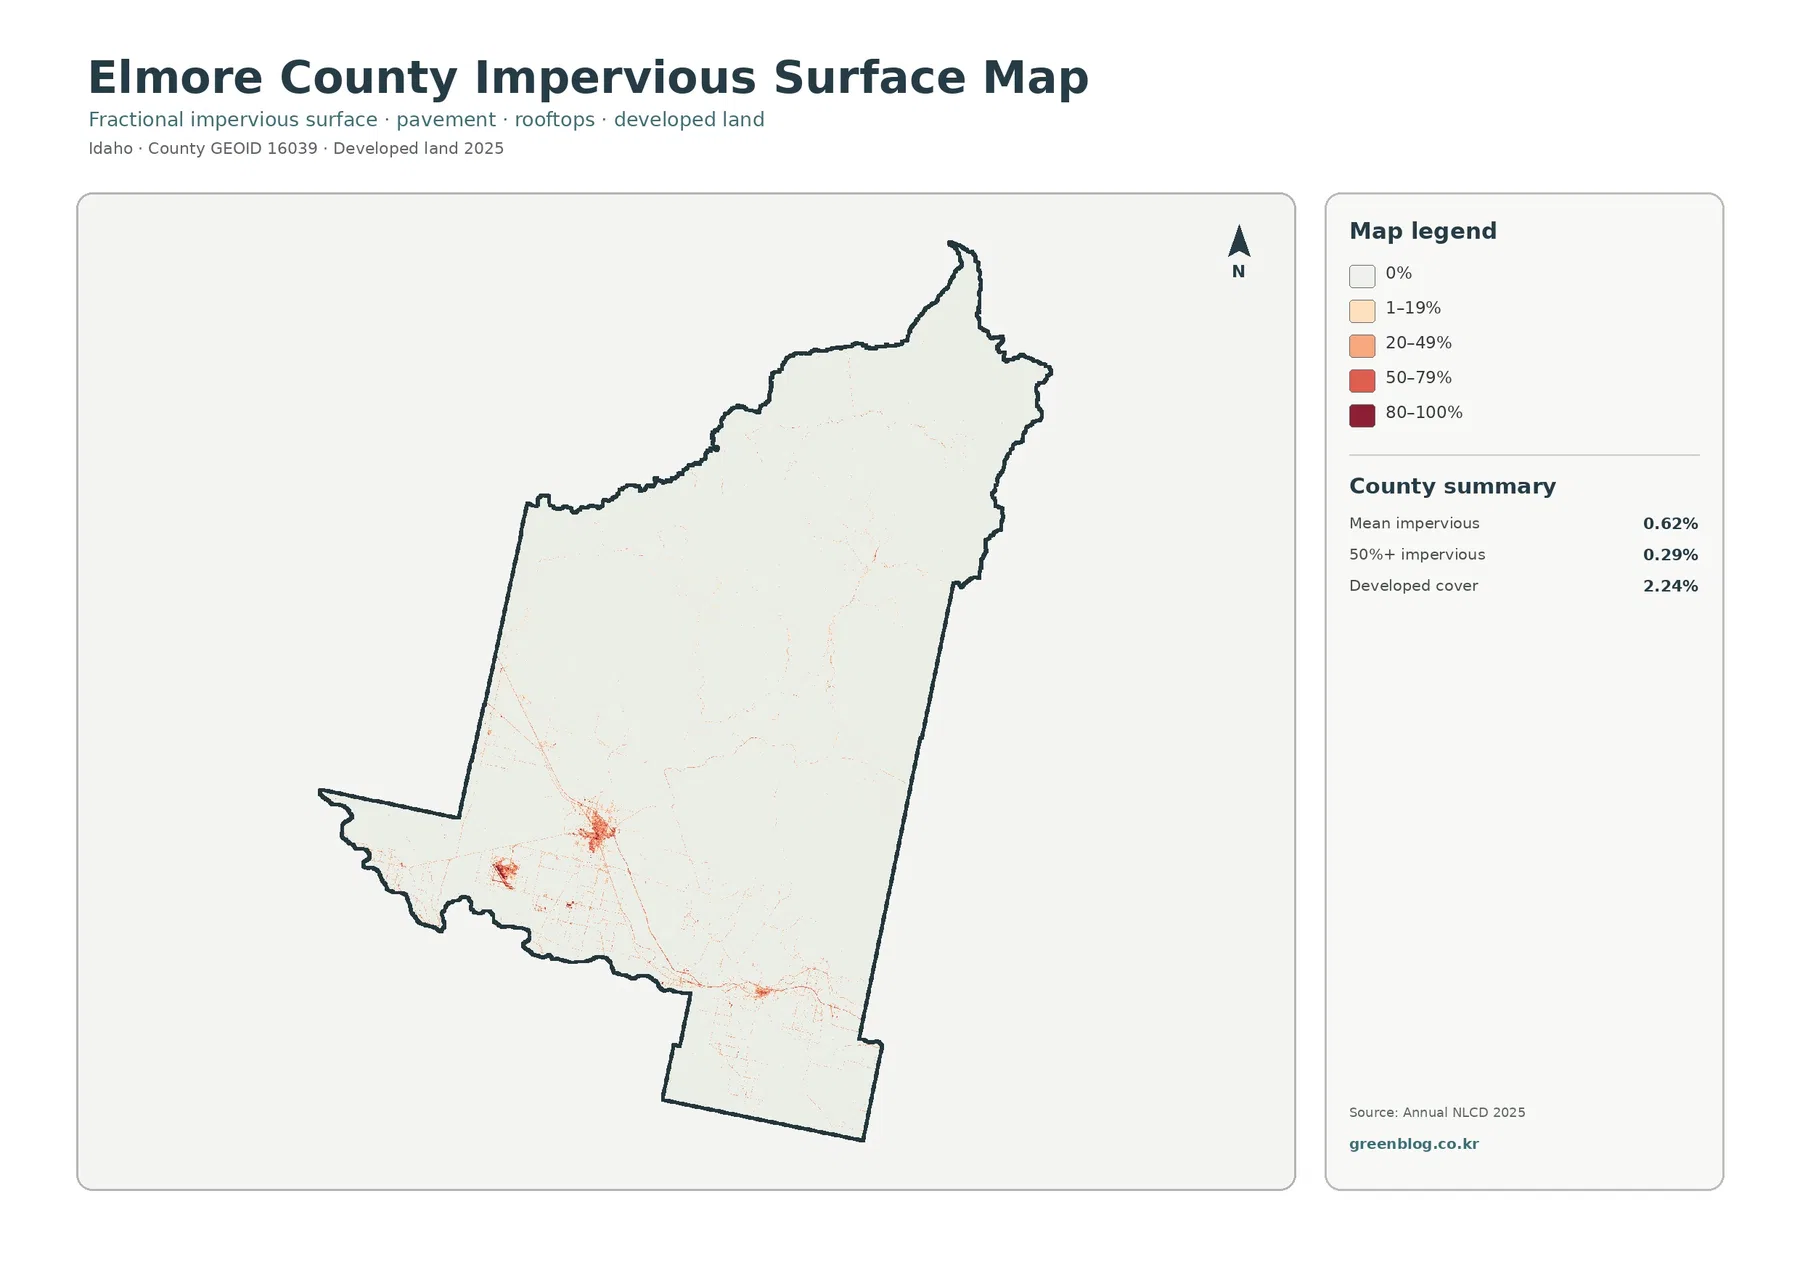
Impervious surface means pavement, rooftops, parking areas, and similar surfaces where water does not readily soak into the ground. Elmore County’s mean impervious value is 0.62%, while cells with 50% or more impervious cover account for 0.29%. Developed land covers 2.24%. These figures show that the built footprint is small compared with the county’s open grassland and shrubland.
The geography of that built footprint is more important than the countywide average. Strong red and orange values form a compact concentration in the southwest, with thin lines extending away from the core. Another network follows the southern portion of the county, while the north and east remain mostly pale. The map therefore reveals a highly uneven pattern in which development is concentrated around a limited number of settled and transportation corridors.
Mountain Home is the Elmore County seat, and both University of Idaho Extension and the Forest Service maintain local offices there. That official context confirms the presence of an important population and service center in the southwestern part of the county. It should not be used to label every high-impervious pixel as a particular street or building; the raster map is too generalized for that level of identification.
Developed land and impervious surface are related but not interchangeable. A developed cell can include grass, soil, trees, or other permeable surfaces along with pavement and structures. For that reason, the 2.24% developed-land figure should not be treated as the percentage of the county covered by concrete or asphalt. The impervious layer is the better map when the specific question concerns hard surfaces.
The 27.36% class difference should be used as a screening map, not a single change rate
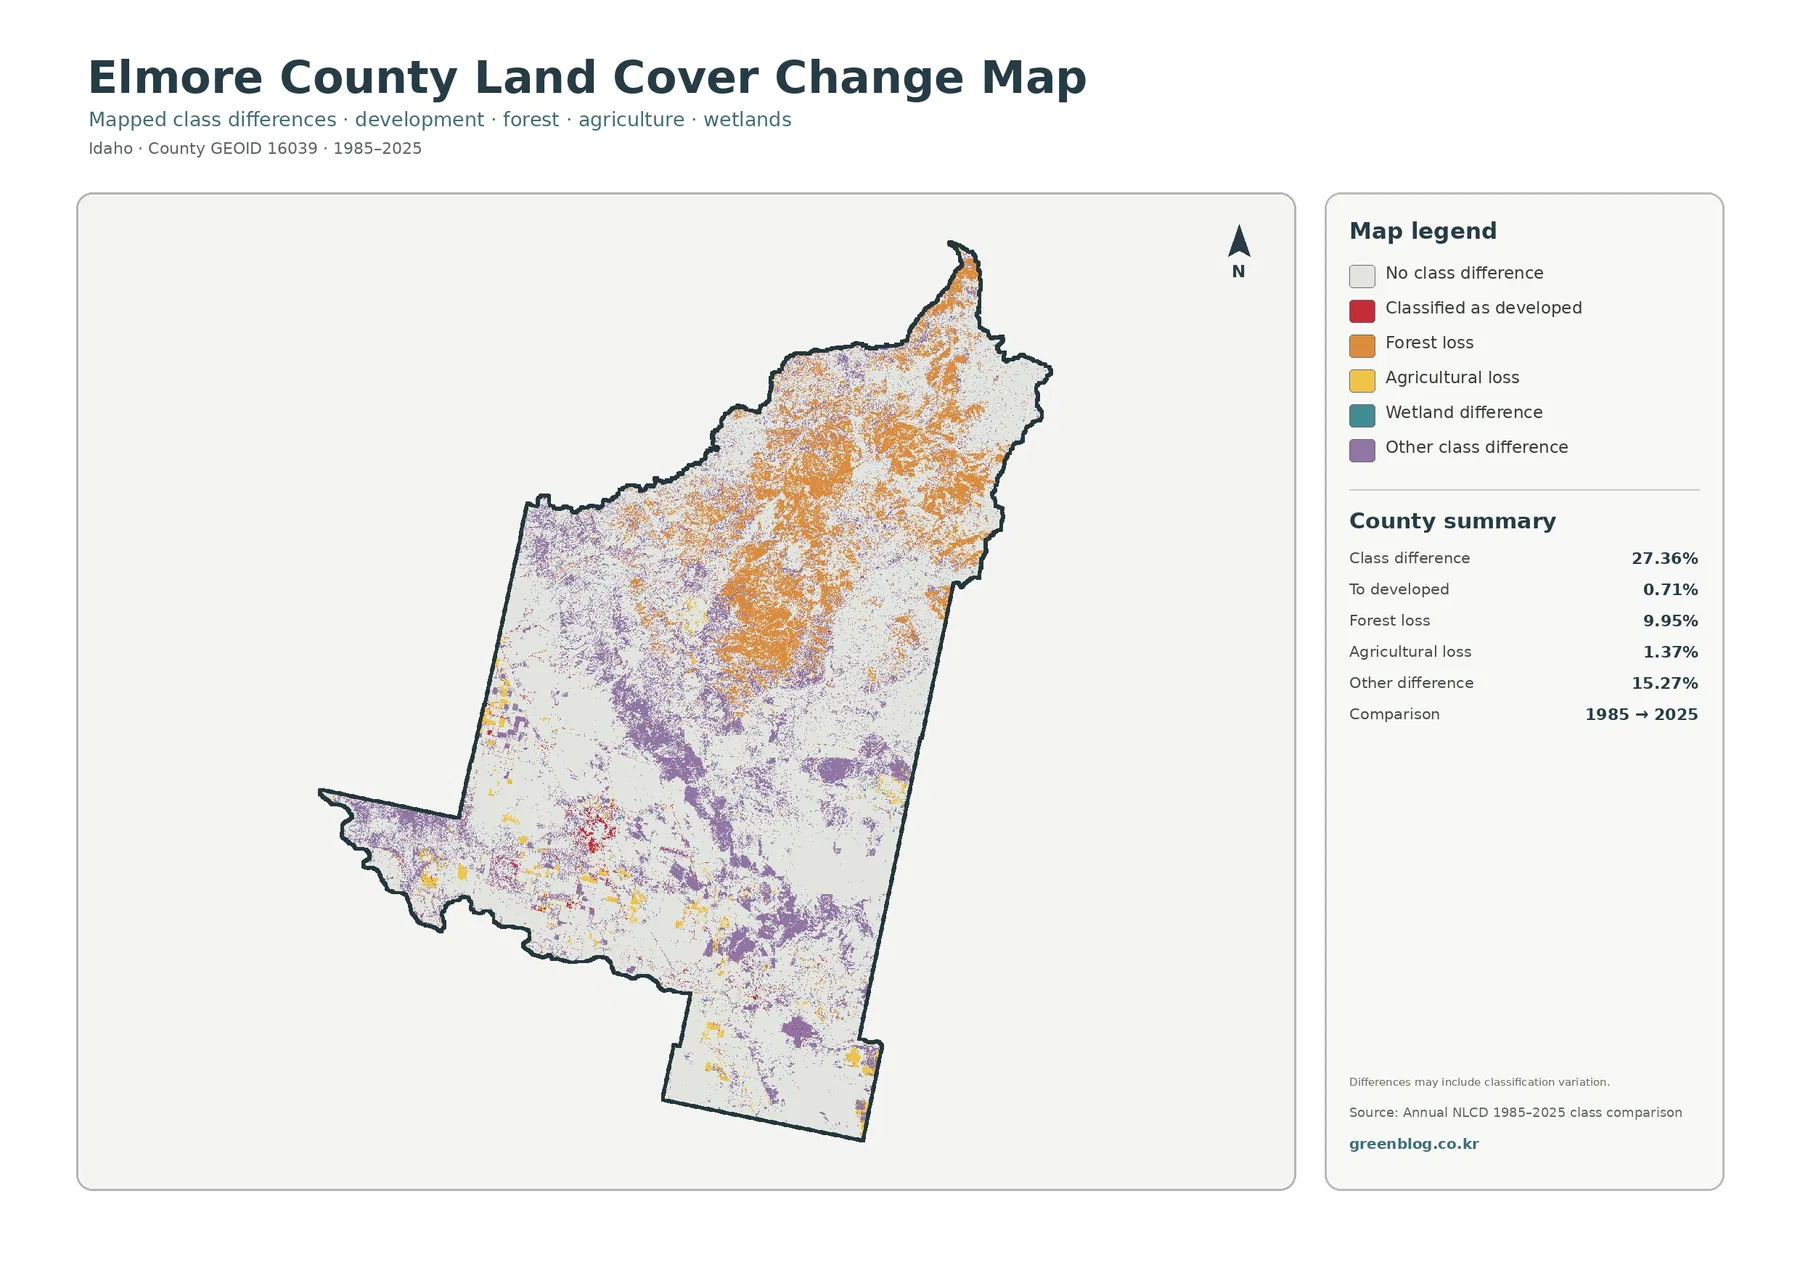
The long-term comparison reports a total class difference of 27.36%. White cells remain in the same broad class in both comparison years, while orange, purple, red, yellow, and other colors mark different categories of class change. Orange forest-loss-category cells are especially widespread in the north and northeast, while purple other-class differences cover broad parts of the center and south.
The summary lists 0.71% as classified to developed, 9.95% in the forest-loss category, 1.37% agricultural loss, and 15.27% other difference. These numbers are useful for describing the map, but they are not automatic measures of permanent land conversion. The map itself warns that the comparison may include classification variation between the two years.
Over a four-decade comparison, differences can reflect sensor conditions, improved classification methods, mixed pixels, temporary disturbance, fire, timber activity, vegetation recovery, or actual conversion. In a county with broad transition zones between grassland, shrubland, and forest, a change in the dominant class assigned to a cell can create a large mapped difference even when the landscape has not undergone one simple type of conversion.
Some red developed-transition areas occur in the same general southwest part of the county where current impervious cover is concentrated. That spatial overlap is worth noticing, but it does not establish a cause or exact date of development. Intermediate Annual NLCD years, county planning records, transportation data, and other local sources are needed to determine when a change occurred and whether it persisted.
Each map is most useful for a different kind of question
For a quick overview, the general land-cover map is the best starting point. It shows the grassland majority, the nearly equal shrubland share, the north-and-east forest pattern, and the concentrated southern agriculture and development in one frame. It also provides the clearest same-year basis for comparing Elmore County with another county.
The forest-and-farmland map is better when the main topic is working land, farming, ranching context, or the boundary between open land and forest. By combining shrub and grass into one background class, it gives more visual space to cropland, pasture or hay, and forest. It is easier to explain where agriculture is concentrated without the extra detail of every general land-cover class.
The impervious map is the strongest choice for settlement and road concentration. The 0.62% mean value sounds very small, yet the southwest core and transportation lines become obvious when hard surfaces are mapped separately. The change map answers a different question by highlighting where two classifications differ across time, and it requires the most caution because mapped difference is not the same as proven cause.
Land cover is not the same thing as ownership, zoning, or parcel boundaries
Annual NLCD is a raster land-cover product created from remotely sensed information and related inputs. The ground is divided into grid cells, and each cell receives a representative class. A cell can contain a mixture of pavement, vegetation, soil, water edge, or a small structure even though the final map displays one category.
A forest-colored cell does not prove National Forest ownership, and an agriculture-colored cell does not prove agricultural zoning. Legal land use, subdivision rules, development approvals, floodplain requirements, and parcel ownership are separate administrative questions. Elmore County’s Land Use and Building Department provides the appropriate planning and permit materials for those purposes.
Color contrast can also make small classes appear more important than their area share. Developed land covers 2.24%, but the bright red and orange values attract attention quickly. Grassland and shrubland cover far more land, yet their muted colors can blend visually. Reading the percentage summary together with the map prevents the strongest color from being mistaken for the largest class.
Use the same year and map type when printing or comparing counties
For a printed overview, start with the general 2025 map and keep its legend and county summary visible. The 41.30% grassland and 37.59% shrubland figures provide clear numeric anchors for the dominant colors. Add the forest-and-farmland map if agriculture is the subject, or the impervious map if the presentation focuses on settlements and transportation.
County comparisons work best when both sides use the same year and the same map product. A 2025 Elmore County general map can be compared directly with another 2025 county general map. A 1985-to-2025 difference map should be compared with another difference map using the same categories, not with a single-year land-cover map.
These maps are also useful for explaining the difference between land cover and land use. Land cover describes what physically covers the ground, such as grass, shrubs, forest, crops, water, or developed surfaces. Ownership, zoning, grazing rights, permits, and jurisdictional boundaries require separate official records even when they overlap geographically with a visible land-cover pattern.
Frequently Asked Questions
What is the largest land-cover class in Elmore County?
Grassland is the largest class in the supplied 2025 summary at 41.30%. Shrubland follows at 37.59%, then forest at 10.92%, agriculture at 6.32%, and developed land at 2.24%. The map shows the two open vegetation classes covering most of the county, with forest concentrated toward the north and east.
Why is developed land 2.24% if mean impervious cover is only 0.62%?
The measures describe different things. A developed land-cover cell can include lawns, soil, trees, and other permeable surfaces along with roads or buildings. The impervious value estimates the share of hard surfaces such as pavement and rooftops, so it is expected to be lower than the total developed class.
Does the 27.36% class difference mean that more than a quarter of the county was permanently converted?
No. The change map compares classifications from 1985 and 2025 and explicitly warns that classification variation may be included. The 27.36% value identifies cells placed in a different comparison class, but determining the timing, cause, and permanence of any real change requires intermediate annual data and appropriate local records.
Map File Information
The four original JPG maps for Elmore County are provided together in one ZIP file.
- Intended Use: printing, county comparison, classroom and presentation reference
Related Maps
Sources and references
- MRLC Annual NLCD Data – annual land cover and impervious products used for the map set
- USGS Annual NLCD Land Cover Classification – land-cover classes and raster interpretation
- University of Idaho Extension – Agriculture in Elmore County – crop, irrigation, soil, and livestock programs
- Boise National Forest – official forest and grassland context for the region
- Elmore County Land Use and Building Department – planning, zoning, and permit documents
Green Map creates custom-edited map images using open geographic data sources such as geoBoundaries, Natural Earth, OpenStreetMap, and government open data.
These maps are edited visual materials, not raw data files, and are provided for education, documents, presentations, and graphic reference.