Forest is the defining cover in Clearwater County, Idaho. The 2025 summary places forest at 75.38% of the county, while the western side breaks that broad green pattern with water, shrubland, grassland, farm patches, and a denser trace of roads and developed land.
The page includes four views of the same county: general land cover, forest and farmland, impervious and developed surfaces, and mapped class differences from 1985 to 2025. The four original JPG maps are also available together in one download for printing, close inspection, or side-by-side comparison.
Table of Contents
Most of the county is forest, but the west carries the strongest visual contrast
A single percentage explains much of the first impression: forest accounts for 75.38% of Clearwater County in the supplied 2025 summary. Large connected forest areas occupy the center and extend across most of the eastern half. Forest also remains extensive along the northern and southern portions of the county, so it is not confined to one isolated mountain block.
The western portion looks different because several cover types appear within a smaller area. Shrubland and grassland break up the forest, blue water is much more visible, and agriculture forms compact yellow patches rather than a countywide layer. Developed land is also easier to find there, although it still represents only a small share of the total county area.
Begin with the 2025 map to see how the main cover types are arranged
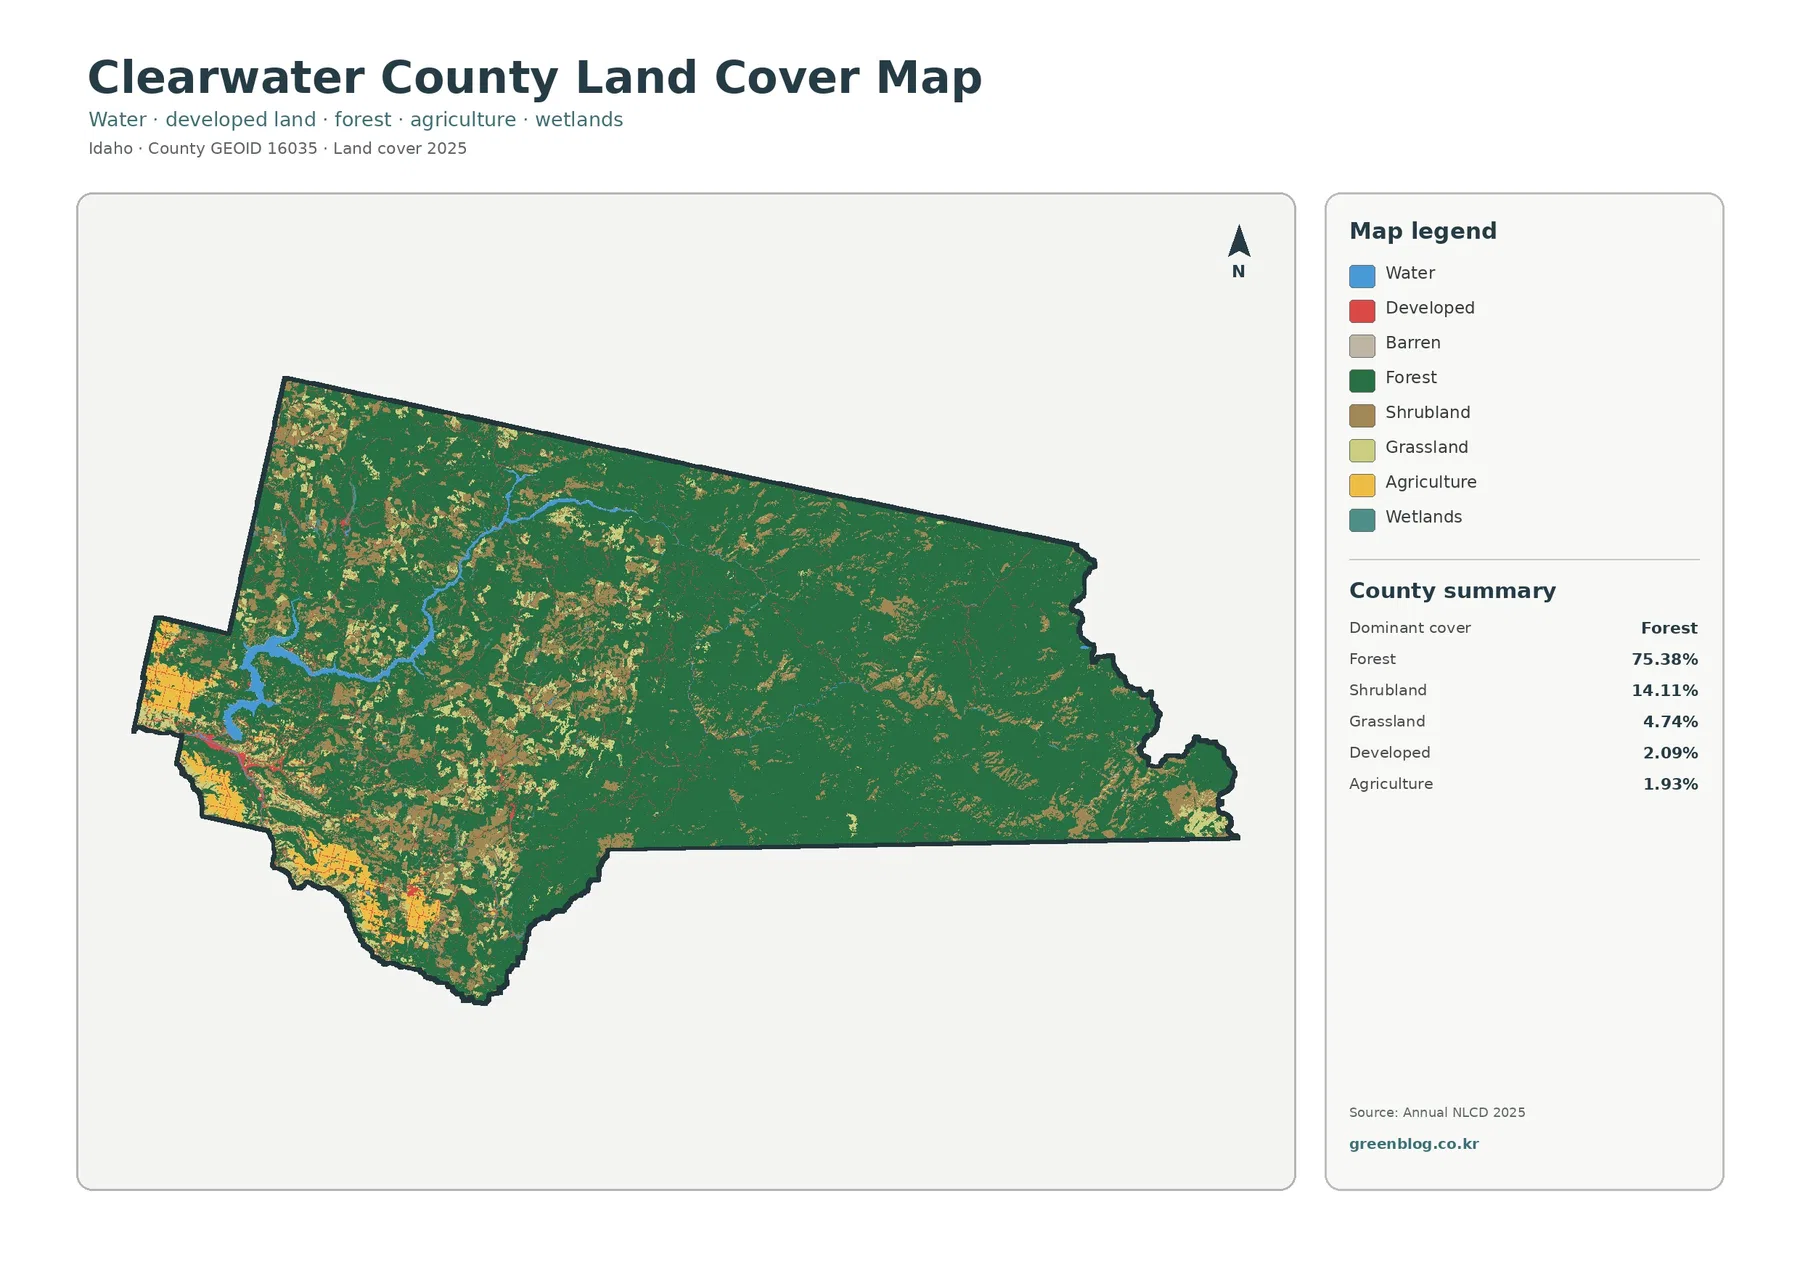
The general map gives the clearest overview of the county. Forest is the dominant class at 75.38%, followed by shrubland at 14.11%. Grassland accounts for 4.74%, developed cover 2.09%, and agriculture 1.93%. Water is listed at 1.05% and wetlands at 0.62% on the companion forest-and-farmland summary.
Shrubland is most noticeable in the western and northwestern portions, where tan areas interrupt the surrounding forest. Smaller shrub patches also appear farther into the interior. Grassland tends to occur near some of those open areas, but the two classes should be read separately rather than treated as one undifferentiated category.
Water has a small countywide percentage but a large visual presence in the west. A broad blue feature and connecting water corridors stand out against forest and open vegetation. Wetland cells occur in smaller amounts near parts of that water network and in other narrow locations, making them easier to notice on the map than their 0.62% share might suggest.
Water and farm patches help distinguish the western side from the forested interior
Clearwater County’s water cover is only 1.05% in the supplied summary, yet the western blue areas are among the easiest features to locate. Their shape creates a strong boundary with adjacent forest, shrubland, and other open cover. Smaller wetland patches add another layer along some water-adjacent areas, although the map does not define legal wetland boundaries.
The forest-and-farmland view makes the small agricultural share easier to find
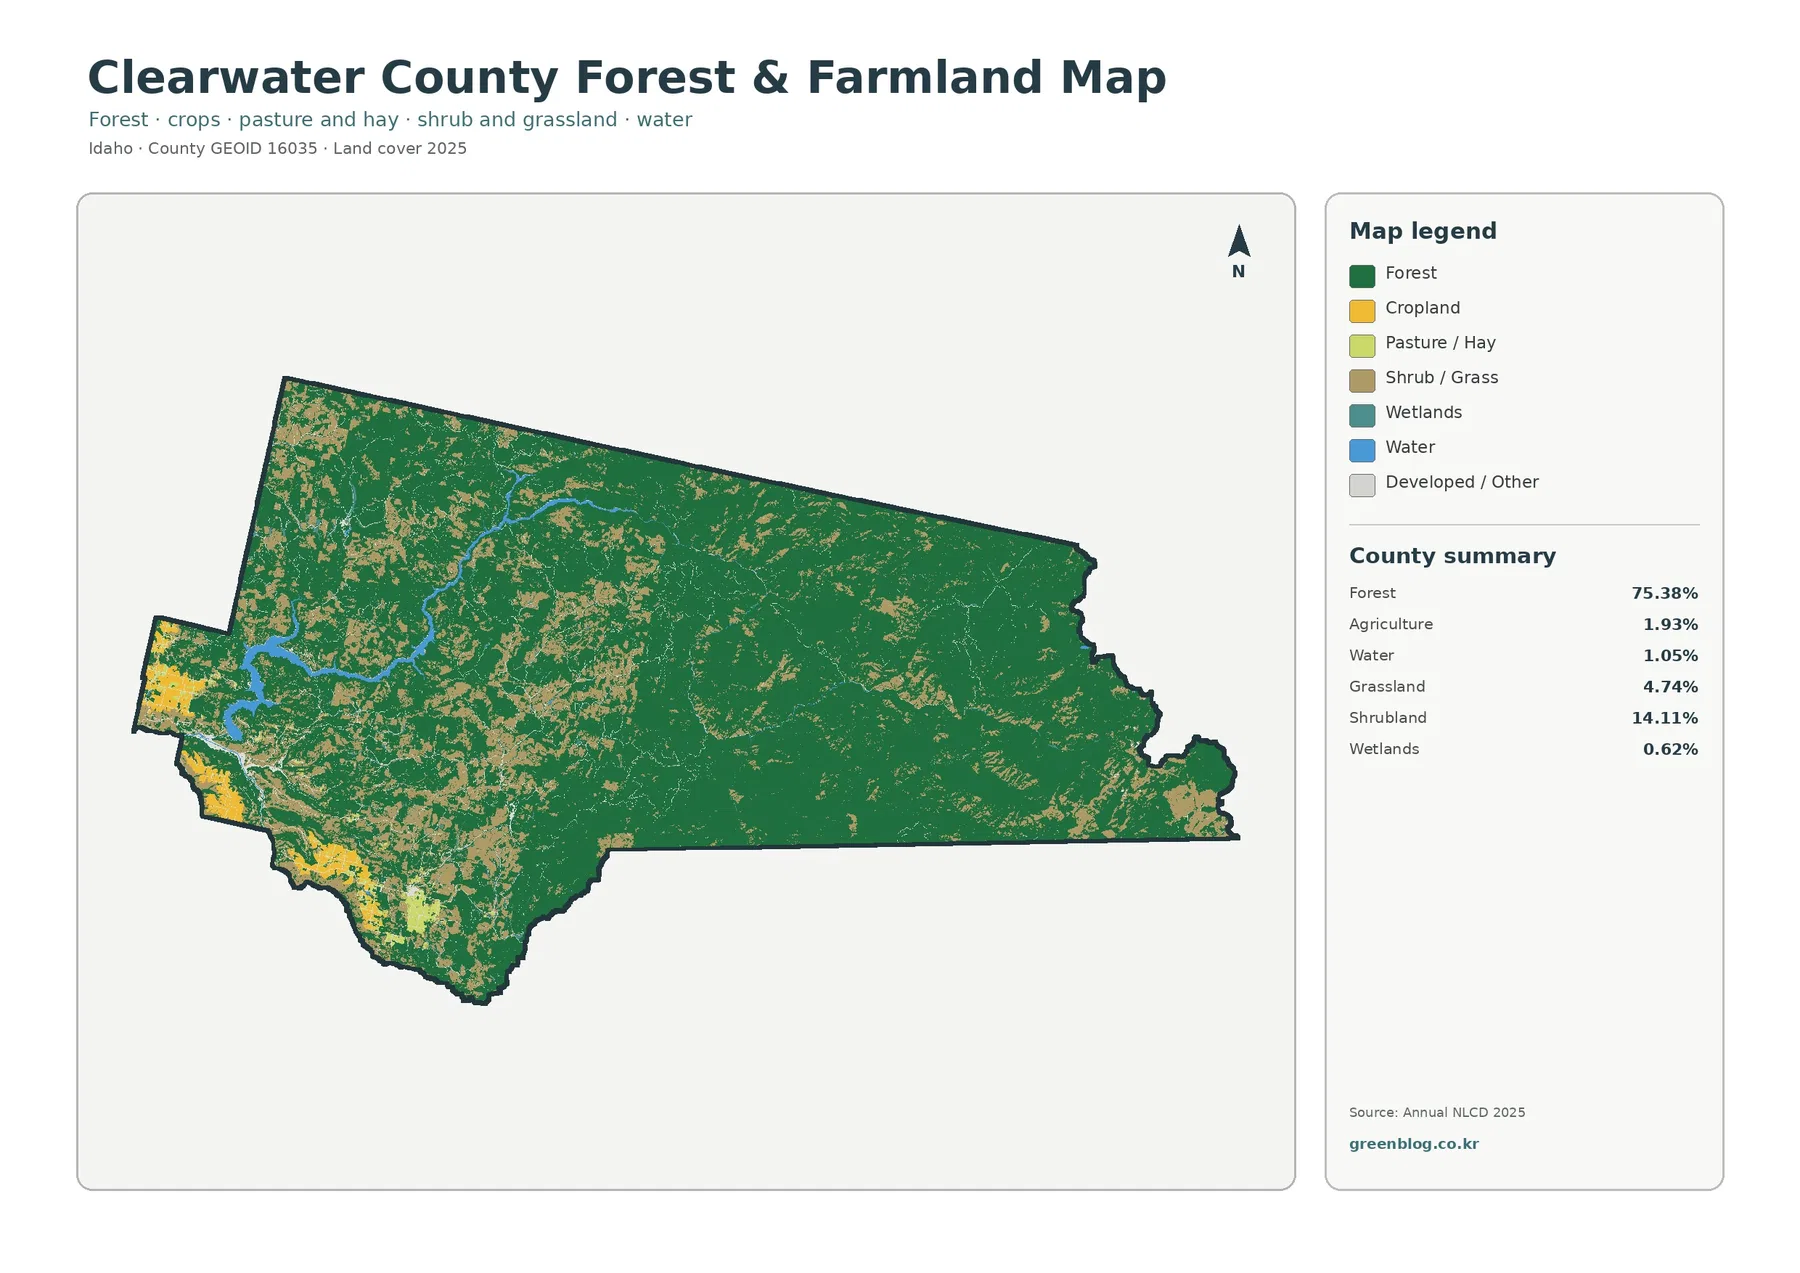
This simplified view is useful because the large forest area no longer competes with as many detailed land-cover classes. Forest still fills most of the county, while cropland is concentrated in the west and southwest. Pasture and hay appear as a separate category, so they should not be combined automatically with cropland when reading or reporting the map.
University of Idaho Extension provides local context for why forest, rangeland, pasture, and small-farm topics matter in Clearwater County. Its natural-resources program covers forest ecology, forest health, timber management, wildlife, wildfire risk, and stewardship for rural landowners. Its agriculture program also addresses pasture and rangeland management, livestock production, and small farms.
Those local programs do not validate a specific pixel or explain why a particular field appears on the map. They do show that forestry and pasture management are active resource topics in the county. The map should still be treated as a land-cover classification rather than an inventory of farm ownership, timber ownership, zoning, or legal land use.
Impervious cover is low overall and becomes visible mainly as roads and small developed clusters
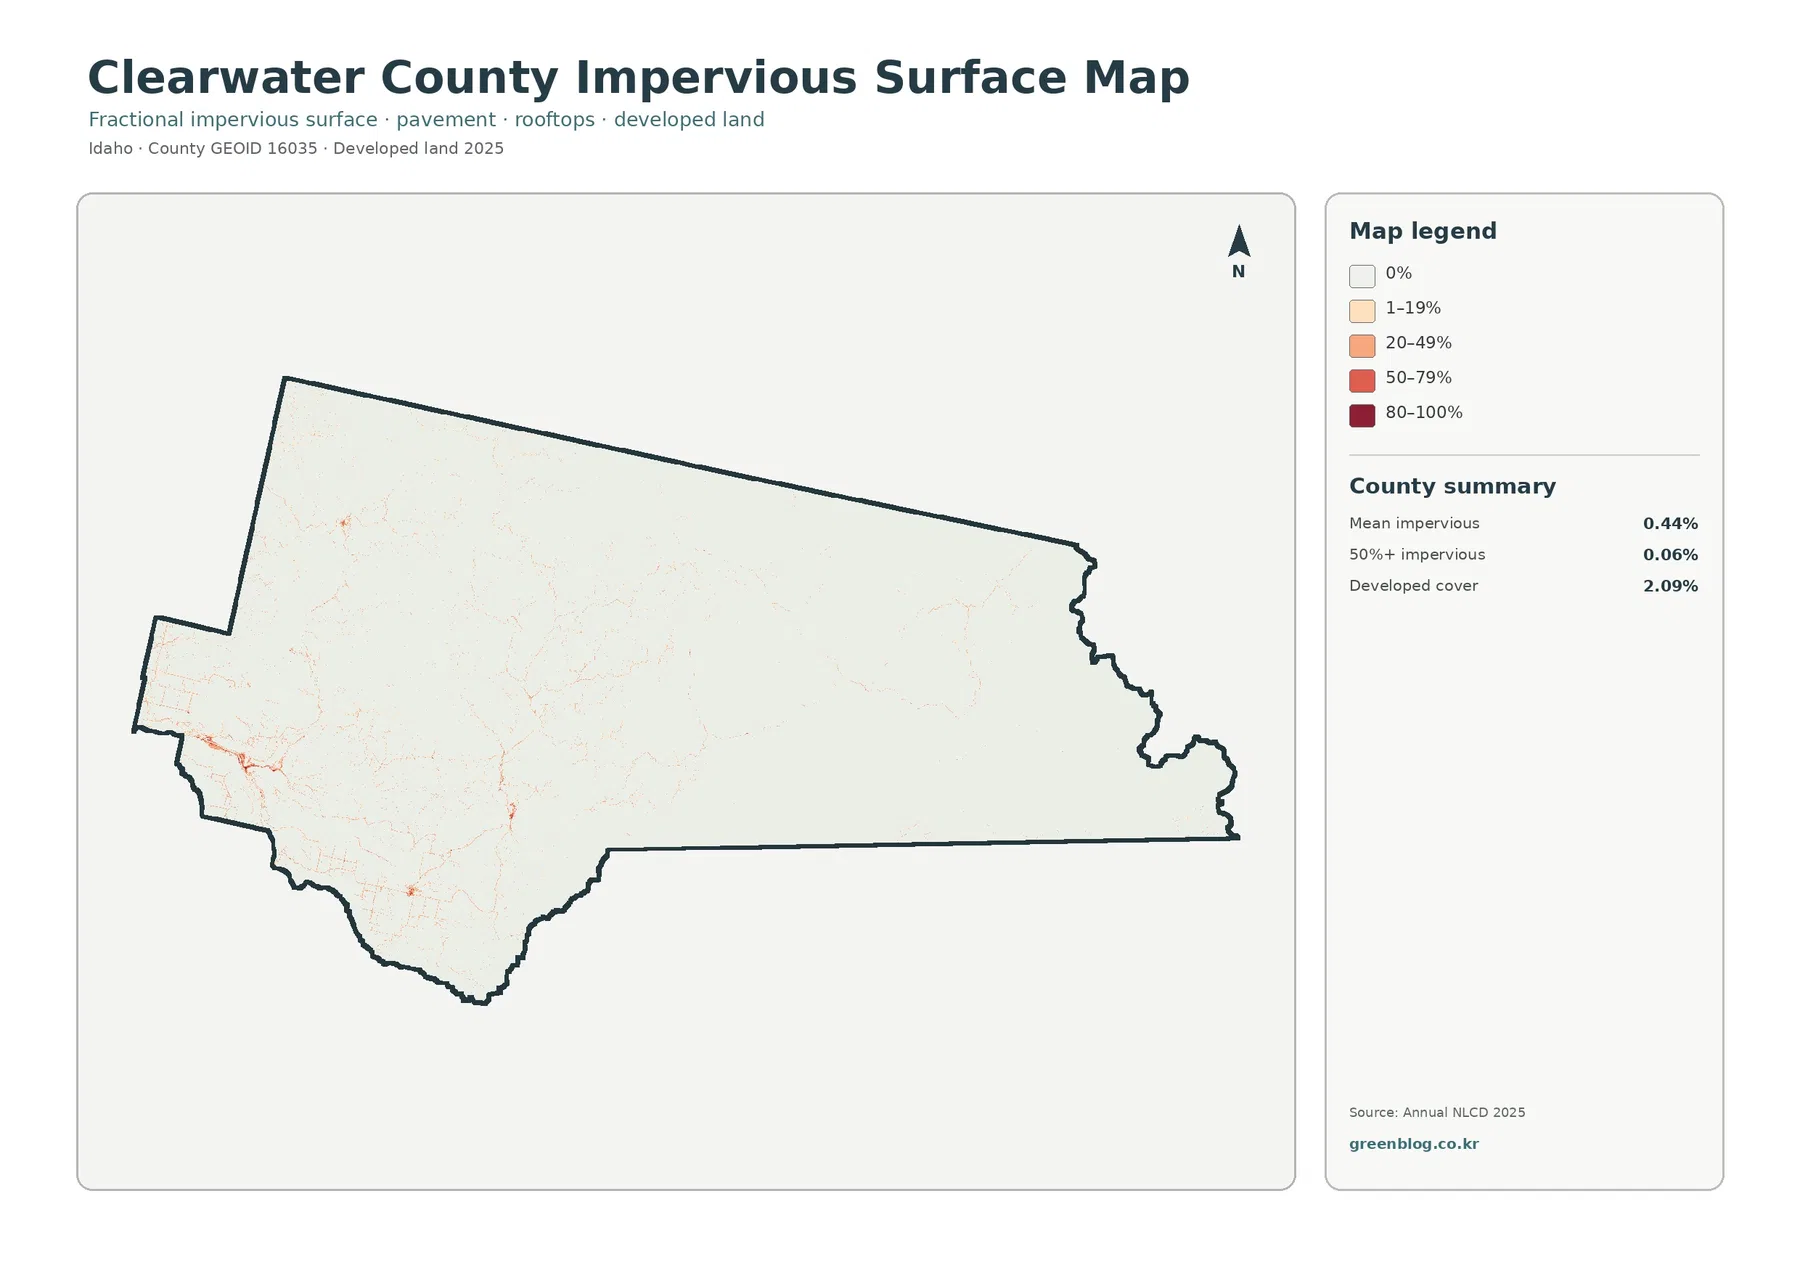
An impervious surface is a surface such as pavement, a roof, or a parking area where water does not readily soak into the ground. The countywide mean is 0.44%, and only 0.06% of the county is shown at 50% imperviousness or higher. Those numbers are consistent with a map dominated by forest and other nonurban cover.
The western and southwestern portions contain the clearest network of orange and red lines and small clusters. Thin traces continue into forested areas as roads, but they occupy very little area compared with the surrounding cover. This map therefore reveals infrastructure that is easy to miss on the general land-cover map without making it look like a large urban footprint.
Developed cover and impervious percentage are related but not interchangeable. A cell classified as developed can include grass, soil, trees, or other surfaces along with pavement and buildings. The 2.09% developed-cover figure should not be interpreted as 2.09% of the county being completely paved.
The 1985–2025 comparison shows many class differences, especially in forested areas
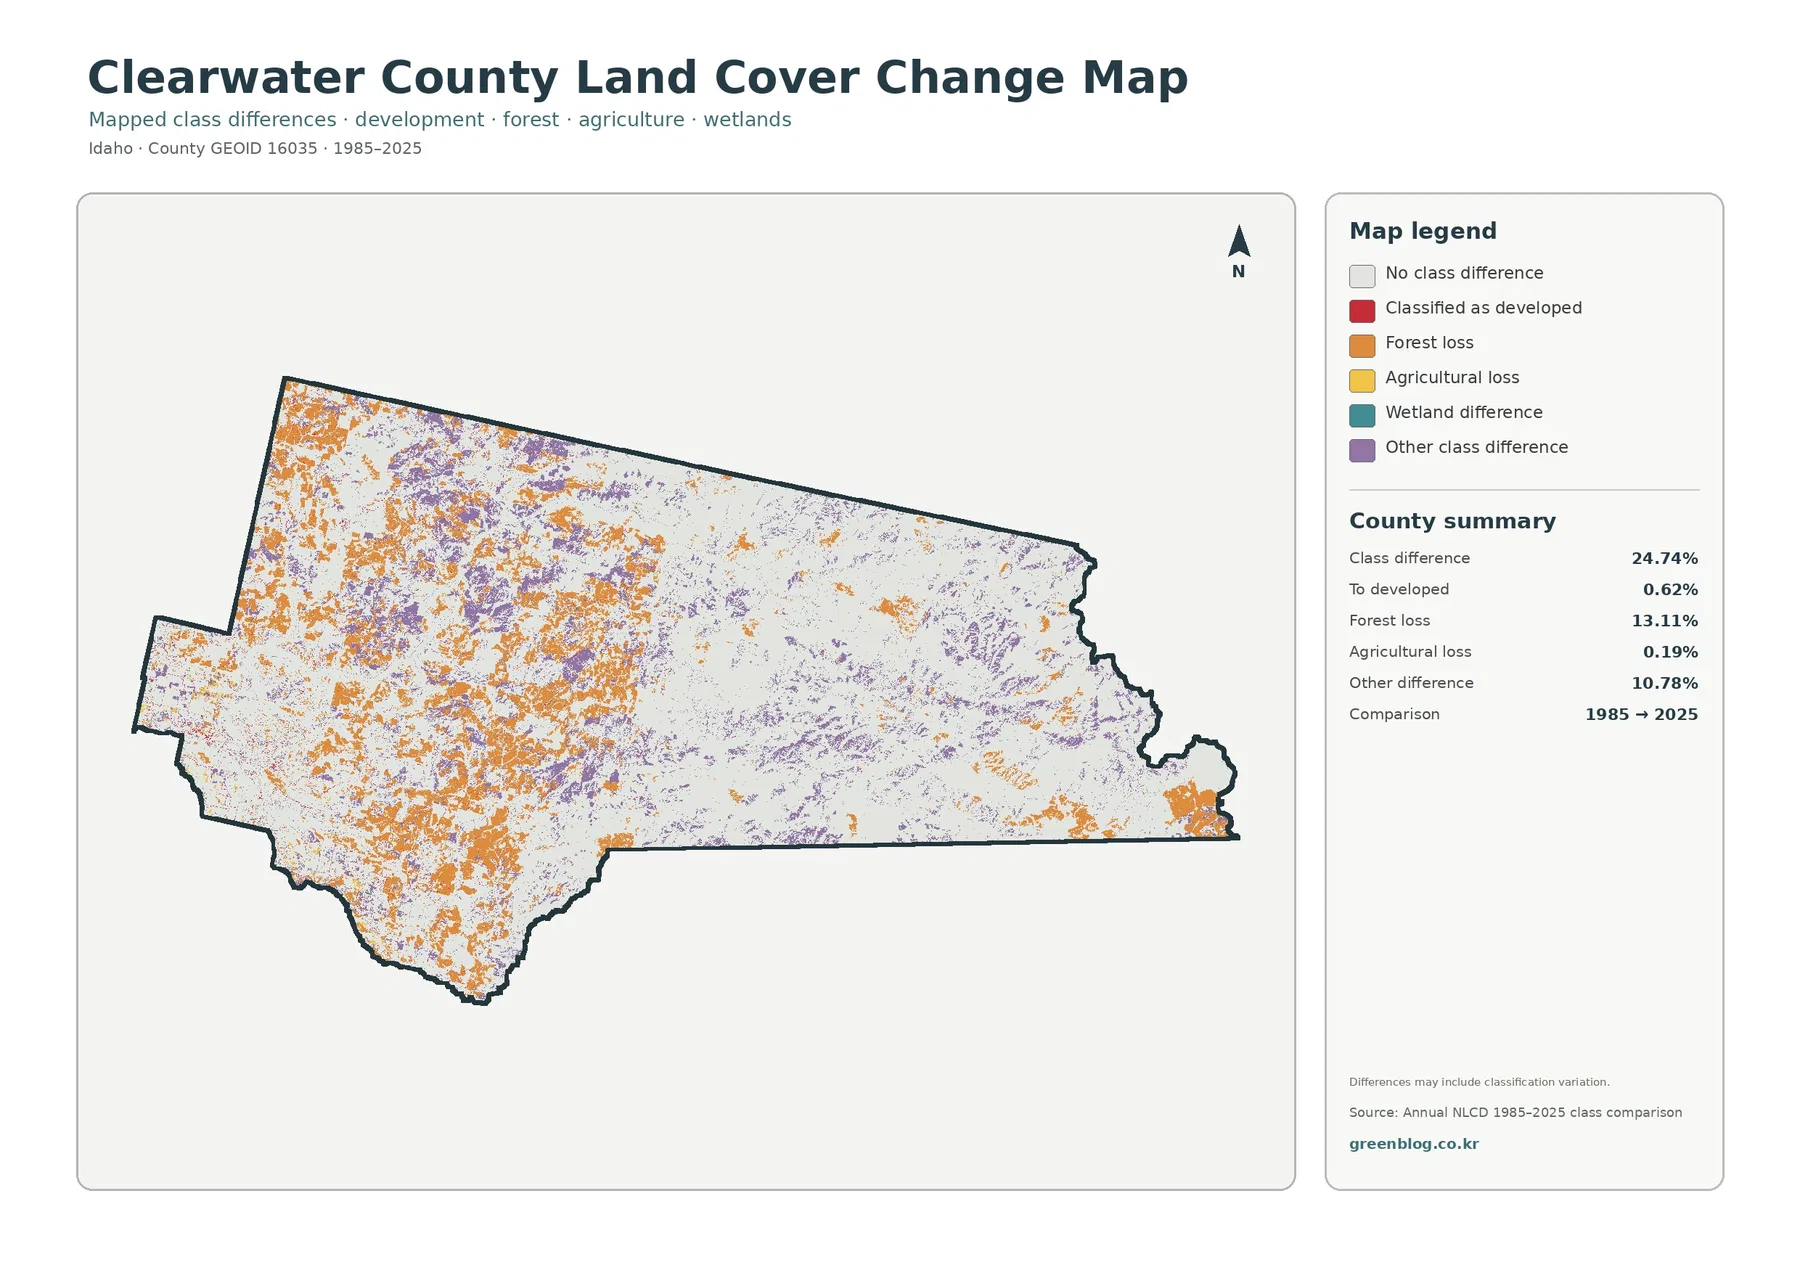
The change map is visually much busier than the impervious map. Orange forest-loss-category cells are scattered across large parts of the western and central forest, while purple other-class-difference cells appear in many locations farther east. White areas represent cells that retain the same broad class between the two comparison years.
The supplied summary reports an overall class difference of 24.74%. It also lists 0.62% as classified to developed, 13.11% in the forest-loss category, 0.19% in the agricultural-loss category, and 10.78% as other class difference. These are map-comparison categories, not a complete accounting of cause or permanence.
The map itself warns that differences may include classification variation. That warning is especially important for Clearwater County because forest occupies such a large share of the county. A classification shift along forest edges, mixed cells, disturbance and regrowth, or differences between observation years can create many visible change cells without every cell representing permanent forest conversion.
For that reason, 13.11% should not be presented as a verified countywide deforestation rate. A stronger workflow is to use the map to locate areas of interest, then examine intermediate Annual NLCD years and local forestry or disturbance records. The two-endpoint map tells you where classifications differ; it does not by itself tell you exactly when the difference occurred or why.
Choose the map according to the question rather than relying on one image for everything
For a quick county overview, start with the general land-cover map. It communicates the 75.38% forest dominance immediately and still shows where shrubland, grassland, water, farms, and development interrupt that pattern. It is the best single image for a presentation slide or a broad comparison with another county.
The impervious map answers a different question. It is better for locating roads and the small areas where built surfaces become concentrated. The change map is best treated as a screening layer for time comparison. It can direct attention to places that deserve a closer year-by-year review, but it should not be used alone to assign a cause to a land-cover change.
A 30-meter classification map is a regional reference, not a parcel survey
Annual NLCD land cover is raster data. In ordinary terms, the landscape is divided into a grid of cells and each cell receives a representative classification. The land-cover product uses 30-meter cells, which is appropriate for regional patterns but much coarser than property boundaries, building footprints, or narrow stream and road edges.
A mixed pixel is a cell that contains more than one real surface. A single cell near a road might include pavement, trees, grass, and soil. Near water, a cell might include a shoreline, vegetation, and open water. The assigned class simplifies that mixture, which is why small features can look blocky or shift slightly from their exact ground position.
Land cover is also different from zoning and legal land use. A forest-colored cell indicates the surface was classified as forest for the dataset; it does not identify who owns the land or whether it is managed for timber, recreation, conservation, or another legal purpose. Agricultural color likewise does not establish a parcel’s zoning or ownership.
Frequently Asked Questions
What is the dominant land cover in Clearwater County?
Forest is the dominant class in the supplied 2025 summary at 75.38%. Shrubland follows at 14.11%, with grassland at 4.74%, developed cover at 2.09%, and agriculture at 1.93%. The map also shows that the western portion is more varied than the largely forested center and east.
Why do water and farms stand out in the west even though their countywide percentages are small?
They are spatially concentrated rather than evenly distributed. Water is 1.05% and agriculture 1.93%, but both appear in recognizable western areas that contrast strongly with the surrounding forest. A small countywide share can therefore be visually prominent when much of it occurs in one part of the map.
Does the 13.11% forest-loss category mean Clearwater County lost 13.11% of its forest permanently?
No. The map compares classifications from 1985 and 2025 and explicitly notes that classification variation can be included. The 13.11% value identifies cells placed in the forest-loss comparison category, but confirming permanent forest loss requires intermediate years and additional forestry or disturbance records.
Sources and Reference Material
- MRLC Annual NLCD Data – Annual land-cover and impervious-surface data
- USGS Annual NLCD Land Cover Classification – Land-cover classes and 30-meter raster interpretation
- University of Idaho Extension – Clearwater County Natural Resources – Local forestry, stewardship, rangeland, and wildfire programs
- University of Idaho Extension – Clearwater County Agriculture – Pasture, rangeland, livestock, and small-farm resources
Map File Information
The original JPG versions of all four Clearwater County land-cover maps are provided together in one ZIP file.
- Included Files: land cover map, forest and farmland map, impervious and developed land map, and land cover change map
- File Type: ZIP containing four JPG files
- Intended Use: printing, county comparisons, classroom work, presentations, and detailed reference
Related Maps
Green Map creates custom-edited map images using open geographic data sources such as geoBoundaries, Natural Earth, OpenStreetMap, and government open data.
These maps are edited visual materials, not raw data files, and are provided for education, documents, presentations, and graphic reference.