Arkansas does not have one continuous belt of dense settlement. The detailed map shows several distinct concentrations instead: the Little Rock area in the center of the state, the closely spaced cities of Northwest Arkansas, Fort Smith on the western side, and Jonesboro in the northeast. Large parts of the state remain in the lightest density classes, so the contrast between compact population centers and broad low-density areas is easy to see.
The five maps on this page answer different population questions. Census-tract shading shows where residents are concentrated at a fine geographic scale. City circles compare the populations of individual census places, while county circles compare total county populations. A separate map measures county population change from the 2010 Census to the 2020 Census. The final map returns to density, this time averaging people per square mile across each county. Reading them together prevents a common mistake: total population and population density are related, but they are not the same measurement.
Table of Contents
Start with the detailed density pattern
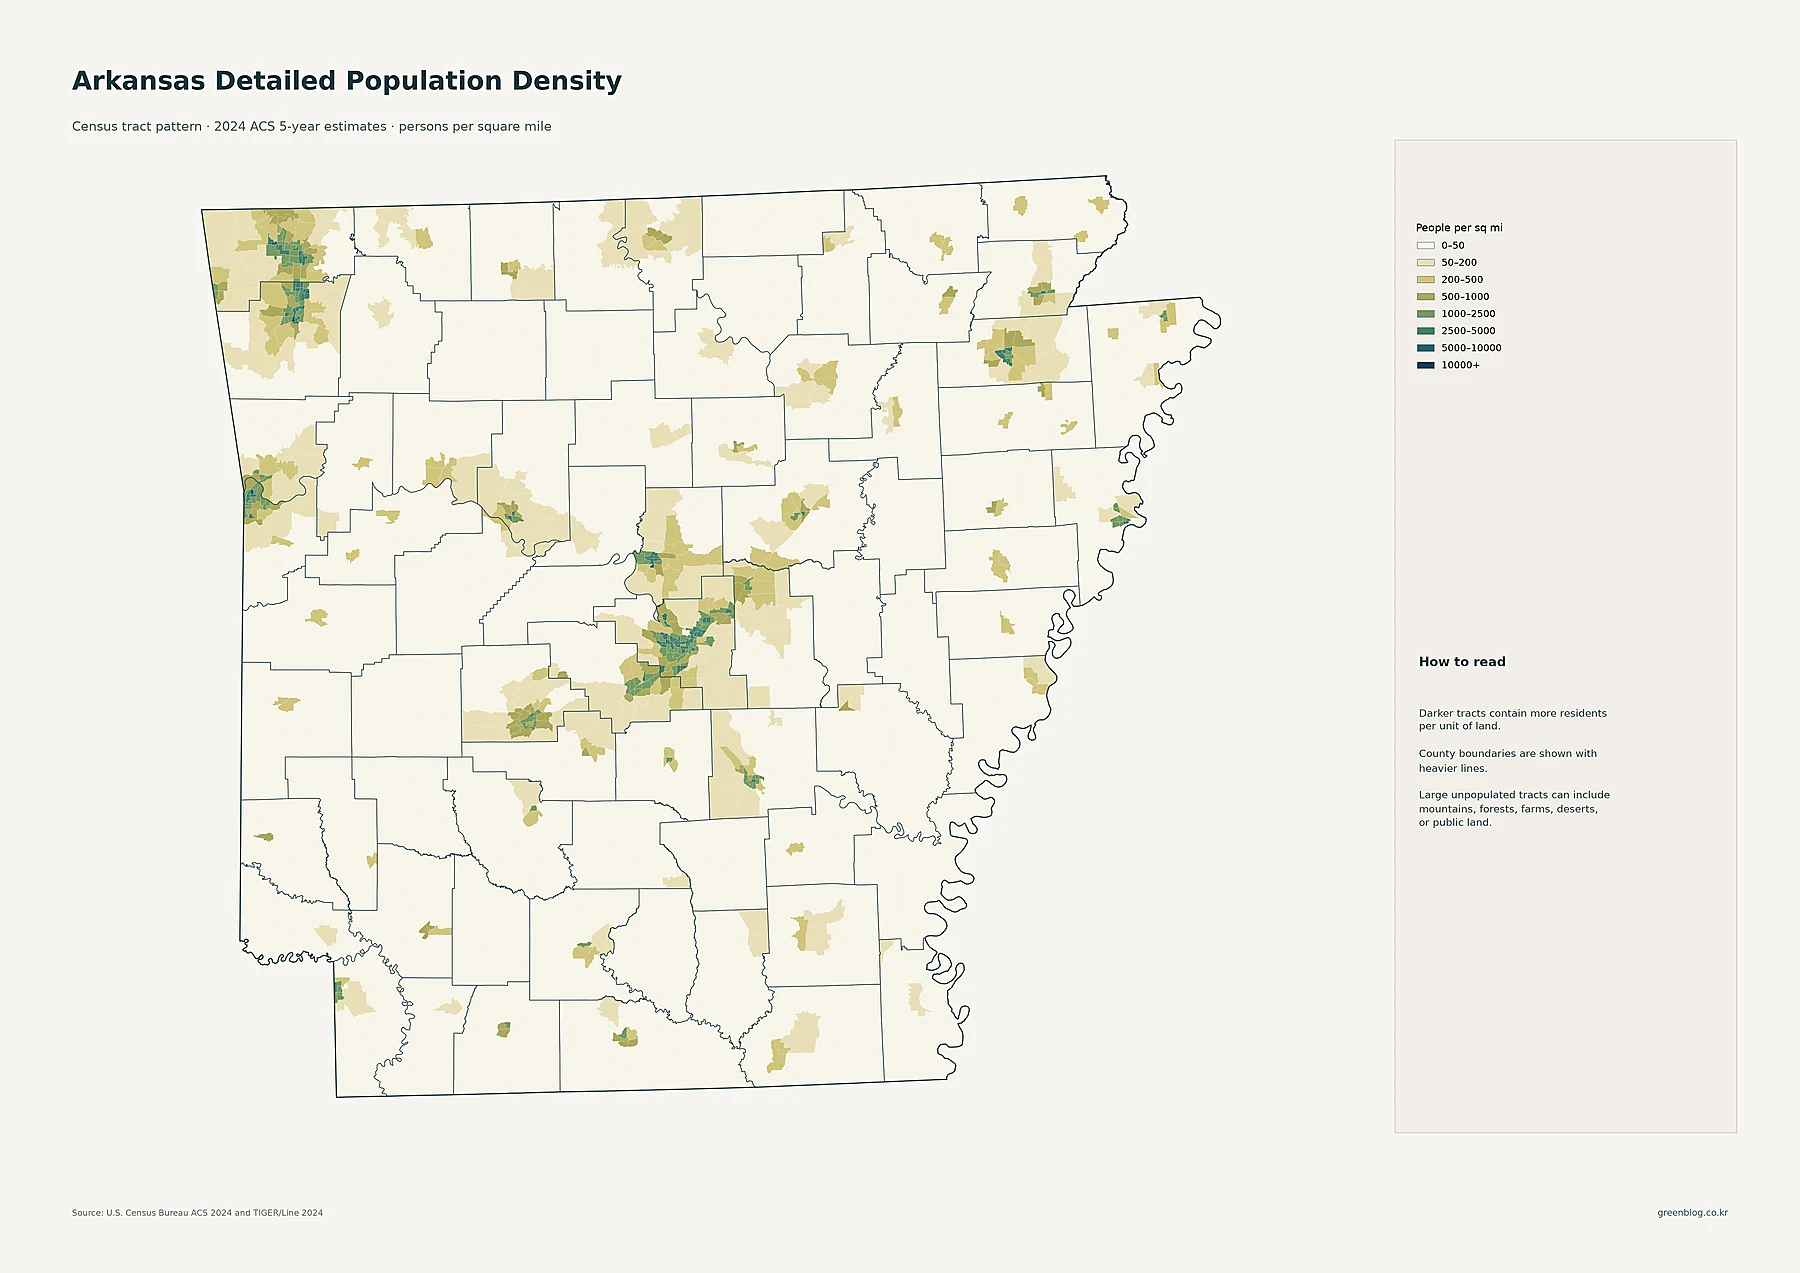
The first map, “Arkansas Detailed Population Density,” uses census tracts and a legend ranging from 0–50 people per square mile to 10,000 or more. County boundaries are drawn with heavier lines, making it possible to see how dense settlement occupies only part of many counties. The strongest cluster is around Little Rock and nearby central Arkansas communities. Another large cluster appears in Benton and Washington counties, where several Northwest Arkansas cities sit close together. Smaller but clear concentrations appear around Fort Smith, Jonesboro, Pine Bluff, Hot Springs, and other regional centers.
This fine-scale view is useful because a countywide average can hide local differences. A county may contain a dense city and extensive low-density land at the same time. On a tract map, those contrasts remain visible. Light shading should therefore be read as low population per unit of land, not as proof that an area has no residents.
The city map reveals two multi-city clusters
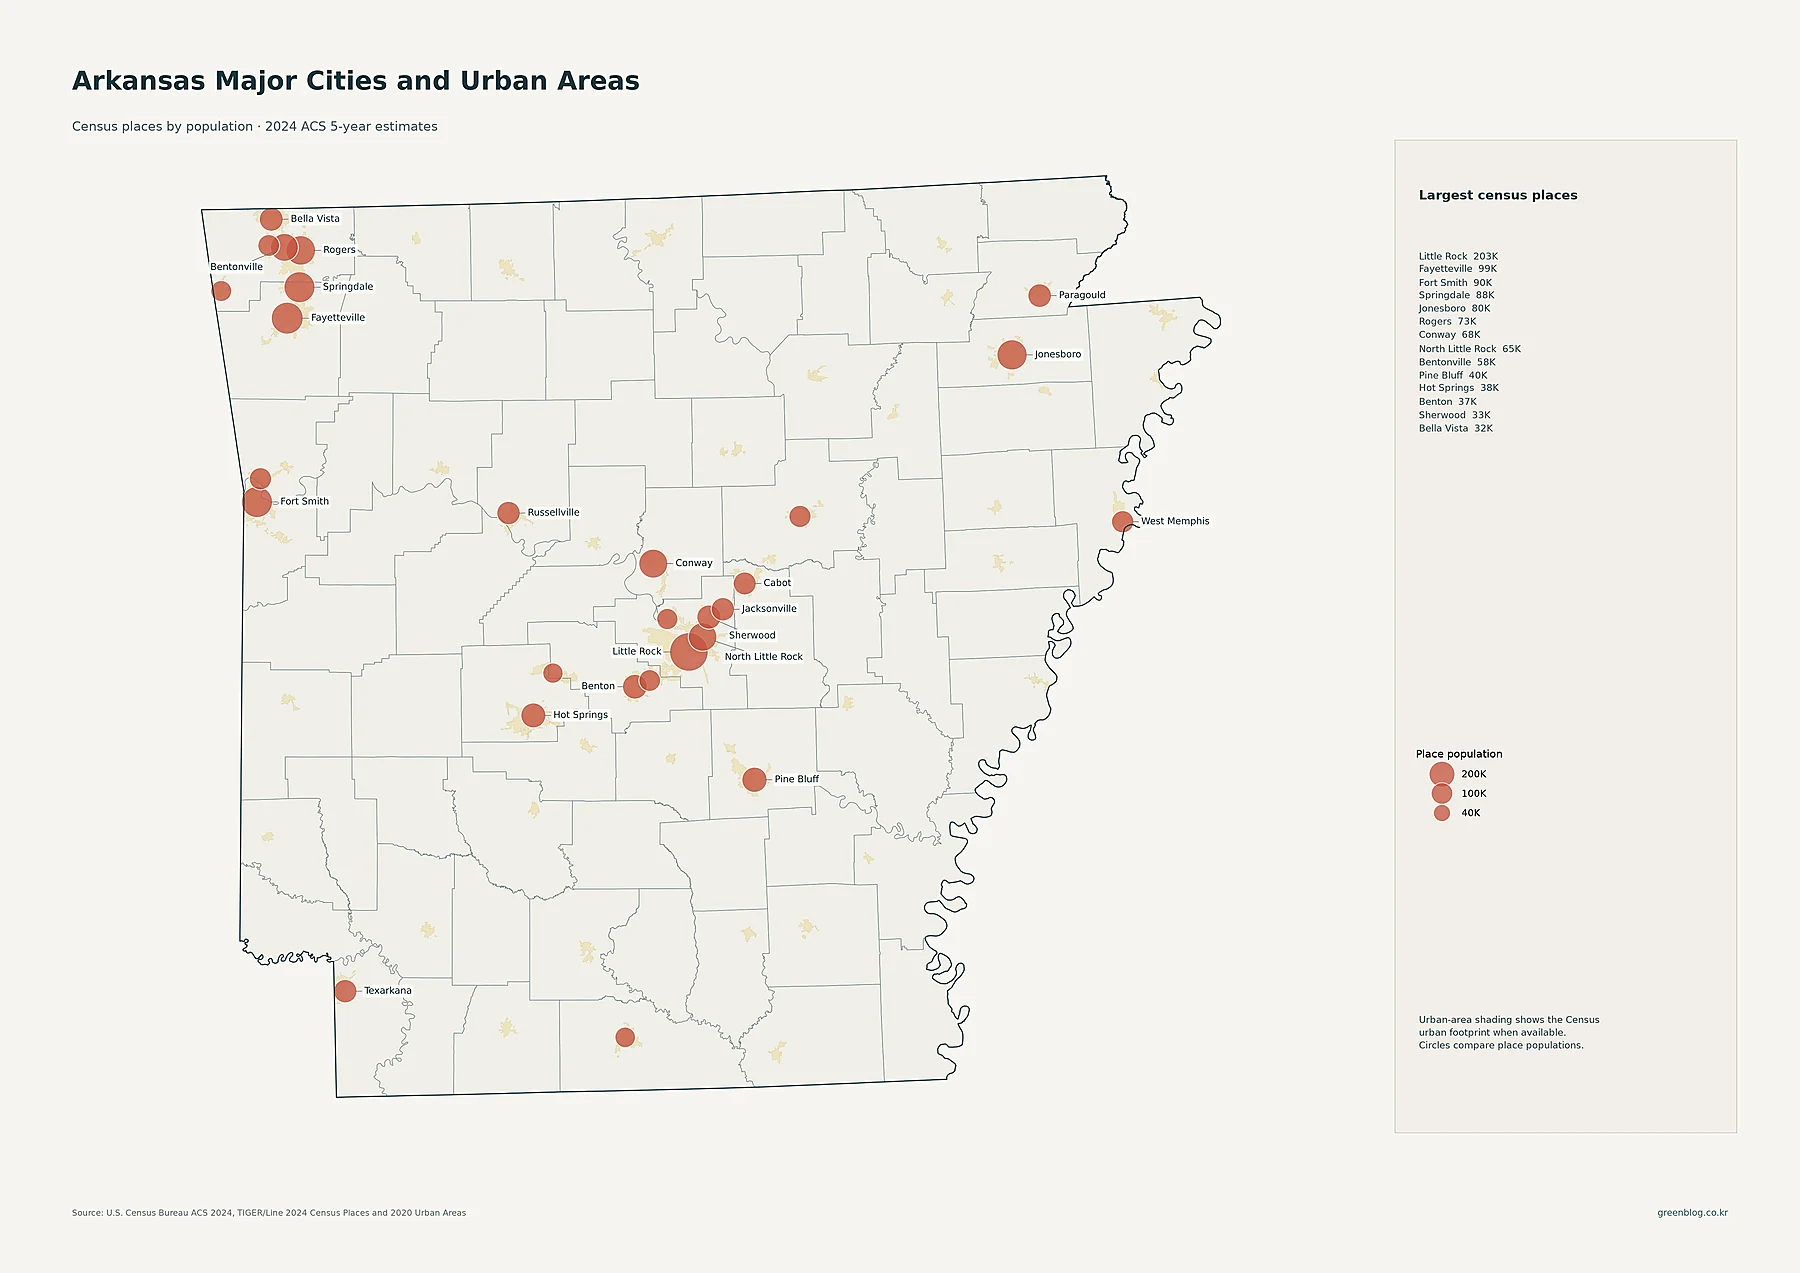
Little Rock is the largest place shown, at about 203,000 residents. Fayetteville follows at roughly 99,000, then Fort Smith at about 90,000, Springdale at 88,000, and Jonesboro at 80,000. Rogers is close to 73,000; Conway about 68,000; North Little Rock about 65,000; and Bentonville about 58,000. Pine Bluff, Hot Springs, Benton, Sherwood, Bella Vista, Paragould, Jacksonville, Texarkana, Russellville, Cabot, and West Memphis add other identifiable population centers across the map.
Two patterns stand out more clearly here than on a simple list of cities. Central Arkansas is not represented by Little Rock alone: North Little Rock, Sherwood, Jacksonville, Benton, and Cabot sit nearby. Northwest Arkansas is also a network rather than a single dominant point, with Bentonville, Rogers, Springdale, and Fayetteville arranged close to one another. The background urban-area shading reinforces the fact that these population centers extend beyond a single city label.
County totals show where the largest populations live
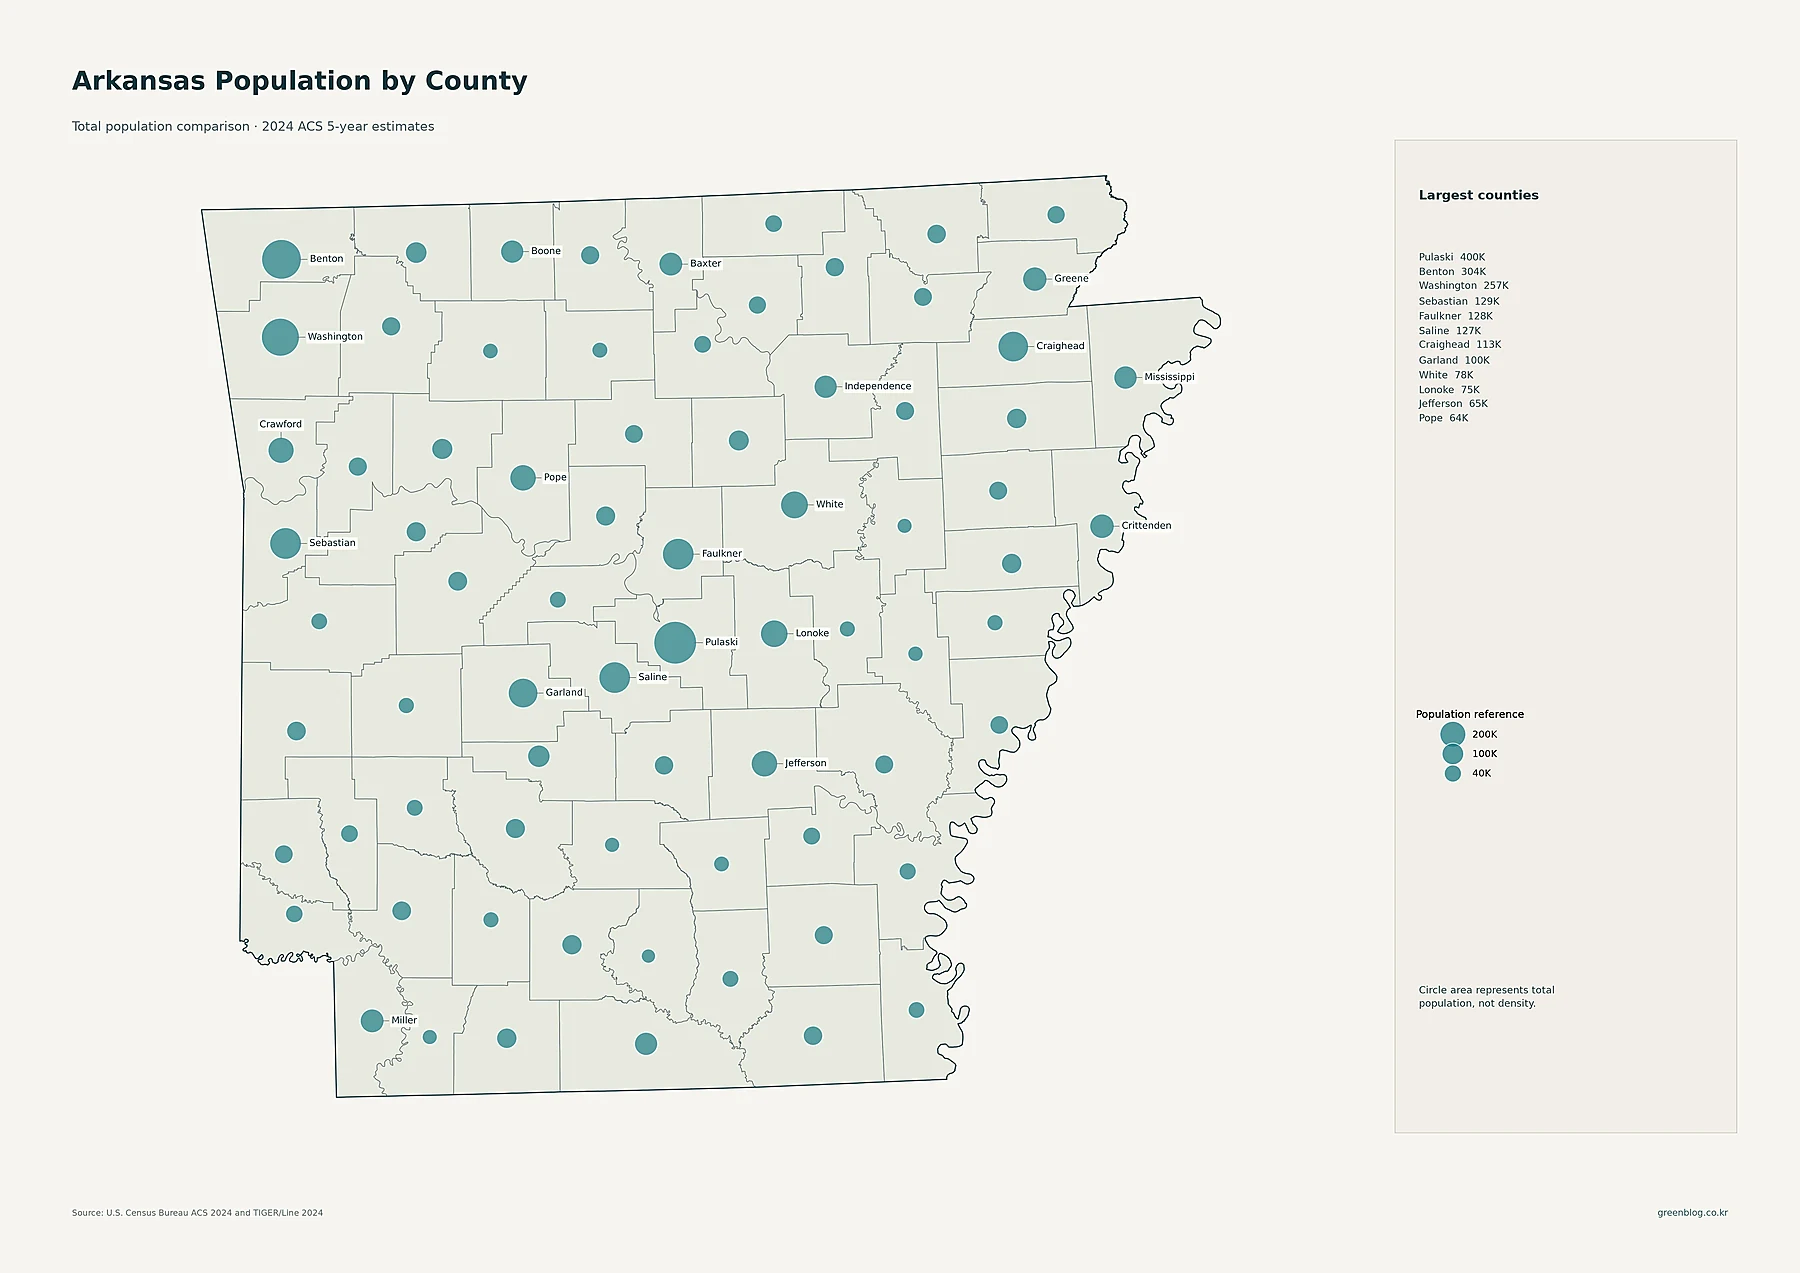
Pulaski County has the largest 2024 ACS total in the supplied data, about 399,800 people. Benton County is next at about 303,600, followed by Washington County at about 256,800. Sebastian, Faulkner, and Saline are all close to 127,000–129,000, while Craighead is about 113,200 and Garland about 100,000. White, Lonoke, Jefferson, and Pope form the next group among the larger county totals shown on the map.
| County | 2024 ACS population | People/sq mi | 2010–2020 change |
|---|---|---|---|
| Pulaski | 399,818 | 527.2 | +4.3% |
| Benton | 303,632 | 358.2 | +28.5% |
| Washington | 256,765 | 272.7 | +21.1% |
| Sebastian | 128,900 | 242.7 | +1.6% |
| Faulkner | 127,717 | 197.3 | +9.1% |
| Saline | 127,479 | 176.2 | +15.2% |
| Craighead | 113,249 | 160.1 | +15.3% |
| Jefferson | 64,802 | 74.3 | -13.1% |
The table illustrates why the county population map should not be treated as a density map. A total simply counts residents inside a county boundary. Density divides population by land area. Pulaski, Benton, and Washington rank high on both measures in this dataset, but that relationship does not make the two concepts interchangeable. The dedicated density map later on is the correct map for comparing residents per square mile.
A decade of change separates growing and declining counties
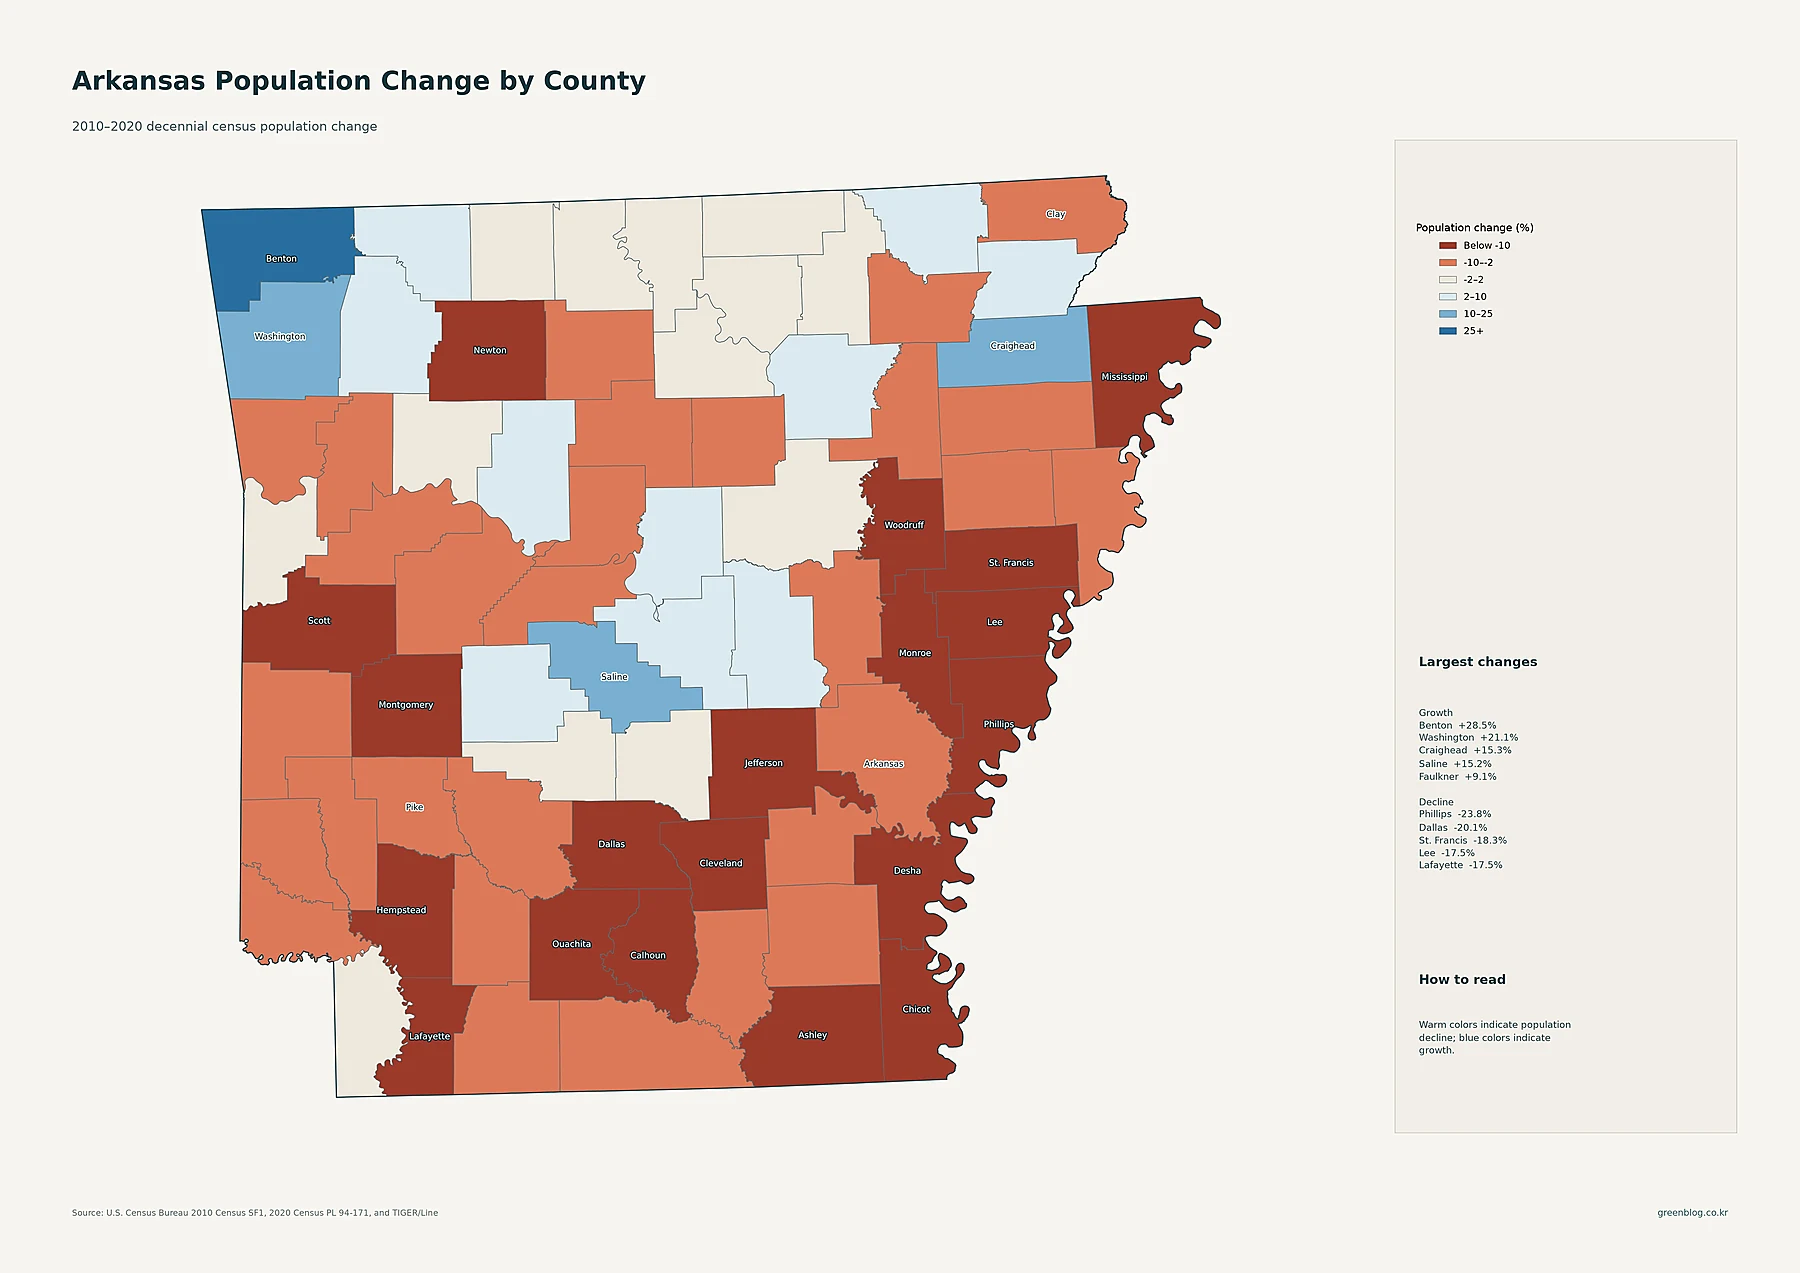
The change map uses a completely different time frame from the 2024 ACS maps. Benton County records the largest gain in the supplied county data at +28.5%, followed by Washington at +21.1%. Craighead grew by +15.3%, Saline by +15.2%, Faulkner by +9.1%, Greene by +8.7%, and Lonoke by +8.3%. The northwest therefore contains the clearest concentration of strong growth, while several central and northeastern counties also show gains.
Decline is widespread in a different set of counties. Phillips fell by -23.8% between 2010 and 2020, Dallas by -20.1%, St. Francis by -18.3%, Lee by -17.5%, and Lafayette by -17.5%. Several other eastern and southern counties are shaded in decline categories as well. The map documents the location and scale of change, but it does not establish a cause. Explanations involving employment, housing, education, migration, or industry require separate evidence and should not be inferred from color alone.
County density puts the Little Rock area at the top
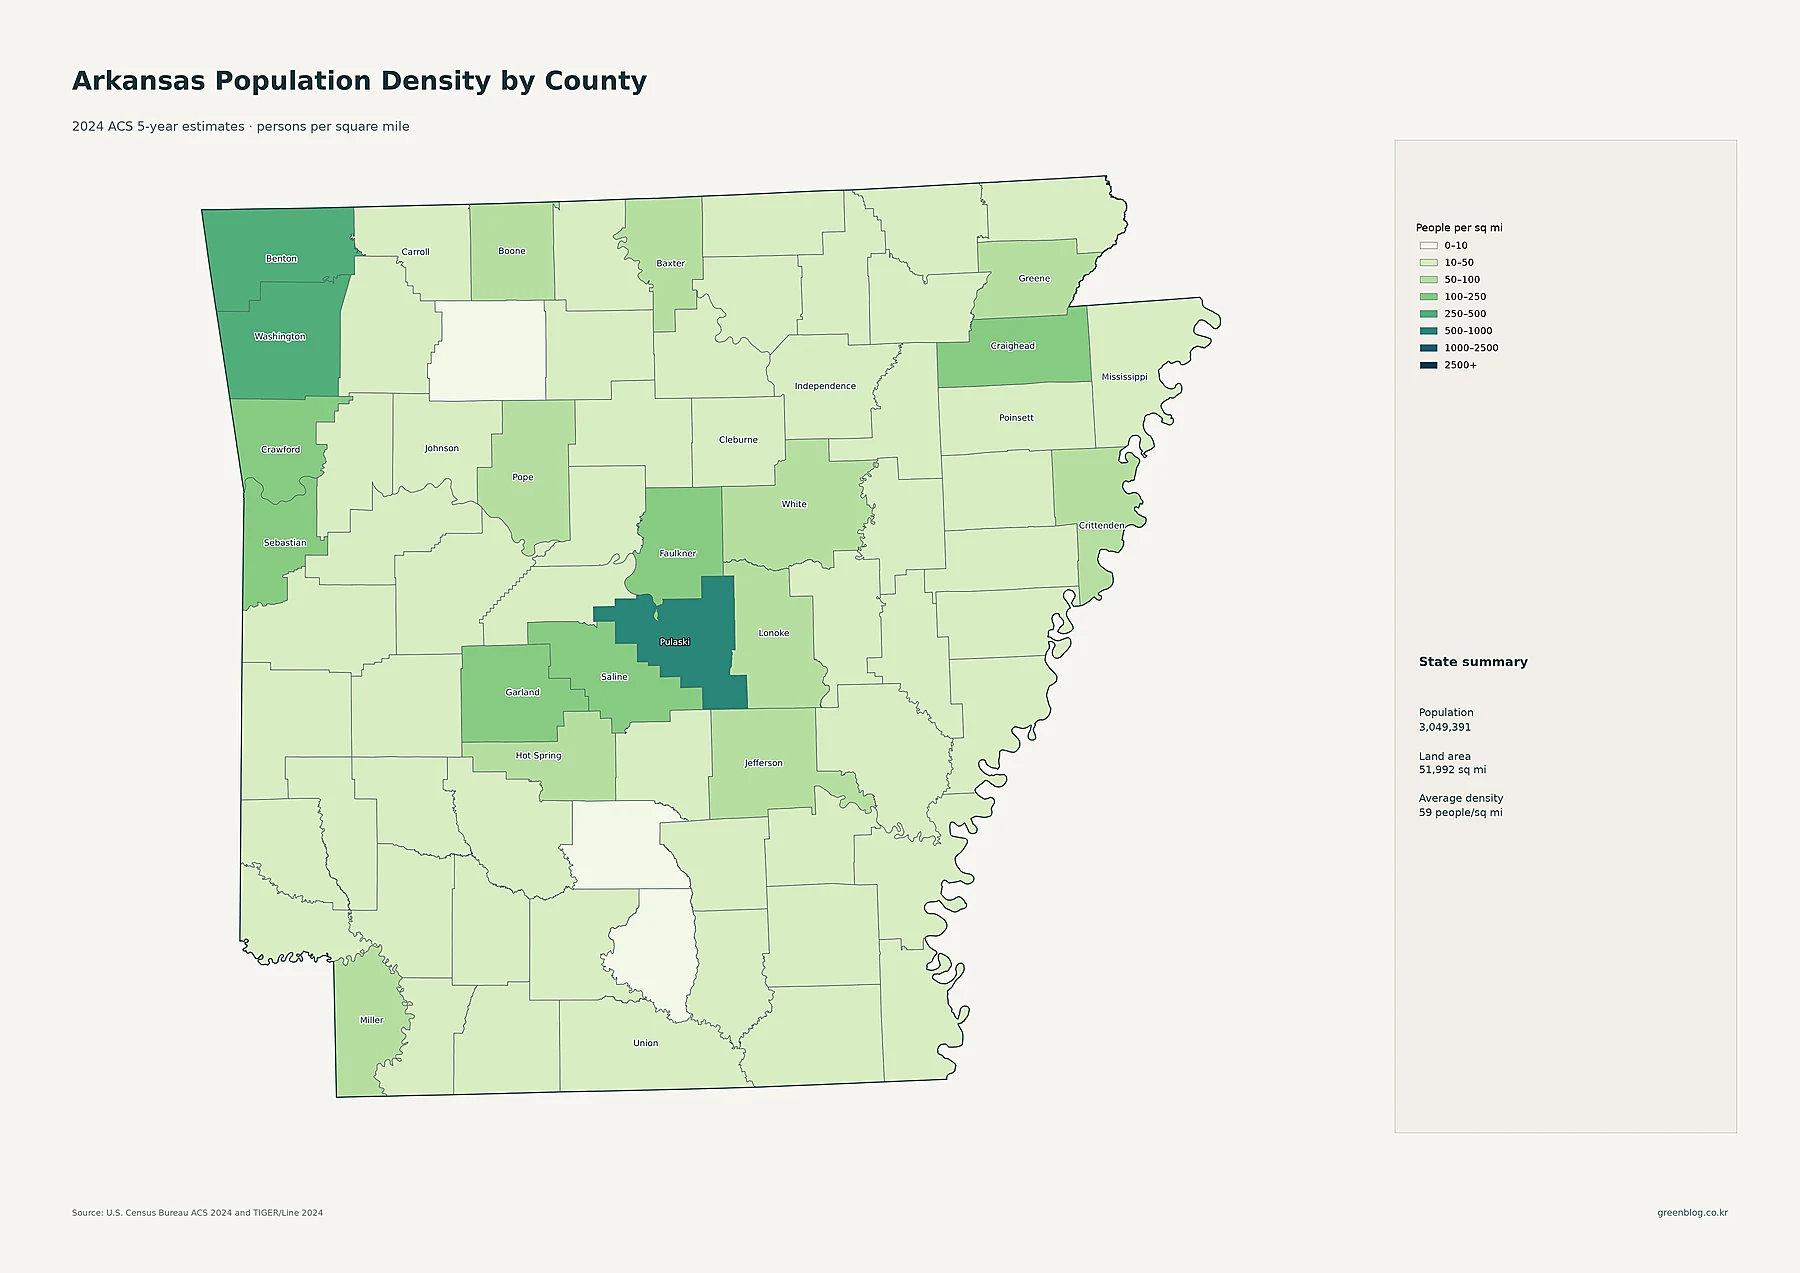
The state summary printed on the final map gives an estimated population of 3,049,391, a land area of 51,992 square miles, and an average density of 59 people per square mile. Pulaski County is far above that statewide average at about 527 people per square mile. Benton is about 358, Washington about 273, and Sebastian about 243. Faulkner, Saline, Craighead, and Garland are also well above the statewide figure, at approximately 197, 176, 160, and 148 people per square mile respectively.
At the low-density end, Calhoun is about 7.5 people per square mile, Newton 8.7, Dallas 9.4, Woodruff 10.3, and Monroe 10.8. These averages are helpful for statewide comparison but they simplify what happens inside each county. The tract map is better for locating concentrated neighborhoods and urban footprints; the county map is better for comparing administrative units quickly.
How to read the five maps without mixing the measures
- 2024 ACS 5-year estimates pool information from 2020–2024. They are estimates, not a one-day 2024 population count.
- Place and county circles represent total population. Use them to compare how many residents are counted within each place or county.
- Density shading represents people per square mile. Use the tract map for local concentration and the county map for broad county-to-county comparison.
- The 2010–2020 change map is based on the two decennial censuses. Keep that decade separate from the later ACS estimates when interpreting trends.
Download the Arkansas population map set
Arkansas Population Map Collection
The ZIP contains high-resolution JPG versions of the detailed density, major cities, county population, 2010–2020 population change, and county density maps shown on this page.
Frequently asked questions
Which Arkansas county has the highest population density in this map set?
Pulaski County is highest in the supplied 2024 ACS county data at about 527 people per square mile. Benton and Washington follow at roughly 358 and 273 people per square mile.
Where was Arkansas population growth strongest from 2010 to 2020?
Benton County shows the largest increase at +28.5%, and Washington County follows at +21.1%. Craighead and Saline also exceeded +15%. These values describe the measured change; the maps alone do not identify its causes.
Why do the tract and county density maps look different?
A census tract is much smaller than a county, so the tract map preserves local pockets of dense settlement. A county average combines urban and rural parts into one value. Use the tract map for local detail and the county map for statewide comparison.
Related Maps
Sources
- U.S. Census Bureau — 2024 American Community Survey 5-year Summary File
- U.S. Census Bureau — 2024 TIGER/Line Shapefiles
- U.S. Census Bureau — 2020 Census Redistricting Data (P.L. 94-171)
- U.S. Census Bureau — 2010 Census Redistricting Data (P.L. 94-171)
Green Map creates custom-edited map images using open geographic data sources such as geoBoundaries, Natural Earth, OpenStreetMap, and government open data.
These maps are edited visual materials, not raw data files, and are provided for education, documents, presentations, and graphic reference.