Mesa County has one of the more varied land-cover patterns in western Colorado. Forest accounts for 46.10 percent of the 2025 summary and shrubland adds another 43.68 percent, so those two classes cover nearly nine-tenths of the county. Yet the Grand Valley looks very different from the surrounding uplands. Agriculture and developed land are concentrated in the valley around Grand Junction and neighboring communities, while broad forest and shrubland areas occupy much of the eastern, southern, northern, and western high country.
This page brings together four views of the same county: current land cover, forest and farmland, impervious surface and developed land, and a 1985–2025 mapped class comparison. The WebP versions can be viewed directly on the page, and the original JPG maps are available together in the ZIP download below. Starting with the current map and then narrowing the view to farming, built surfaces, and long-term class differences makes it easier to see how strongly the Grand Valley contrasts with the rest of Mesa County.
Table of Contents
Forest and shrubland cover almost nine-tenths of Mesa County
The 2025 county summary lists forest at 46.10 percent and shrubland at 43.68 percent. Developed land is 3.59 percent, agriculture is 3.42 percent, and wetlands account for 1.67 percent, with water and grassland making up smaller shares. Those totals describe the county as a whole, but the map shows why percentages alone are not enough. Forest is especially broad across the eastern and southern portions, while shrubland occupies large dry upland areas through the northwestern and central parts of the county.
A very different cluster appears in the west-central valley. Yellow agricultural cover and red developed land form a long band around the Grand Junction area, with smaller patches extending toward other Grand Valley communities. Water and wetland colors also follow parts of the valley. Mesa County’s official master plan describes Grand Junction as the county’s urban center and identifies the Colorado and Gunnison river valley, surrounding mesas, canyons, and highlands as major elements of the county’s landscape.
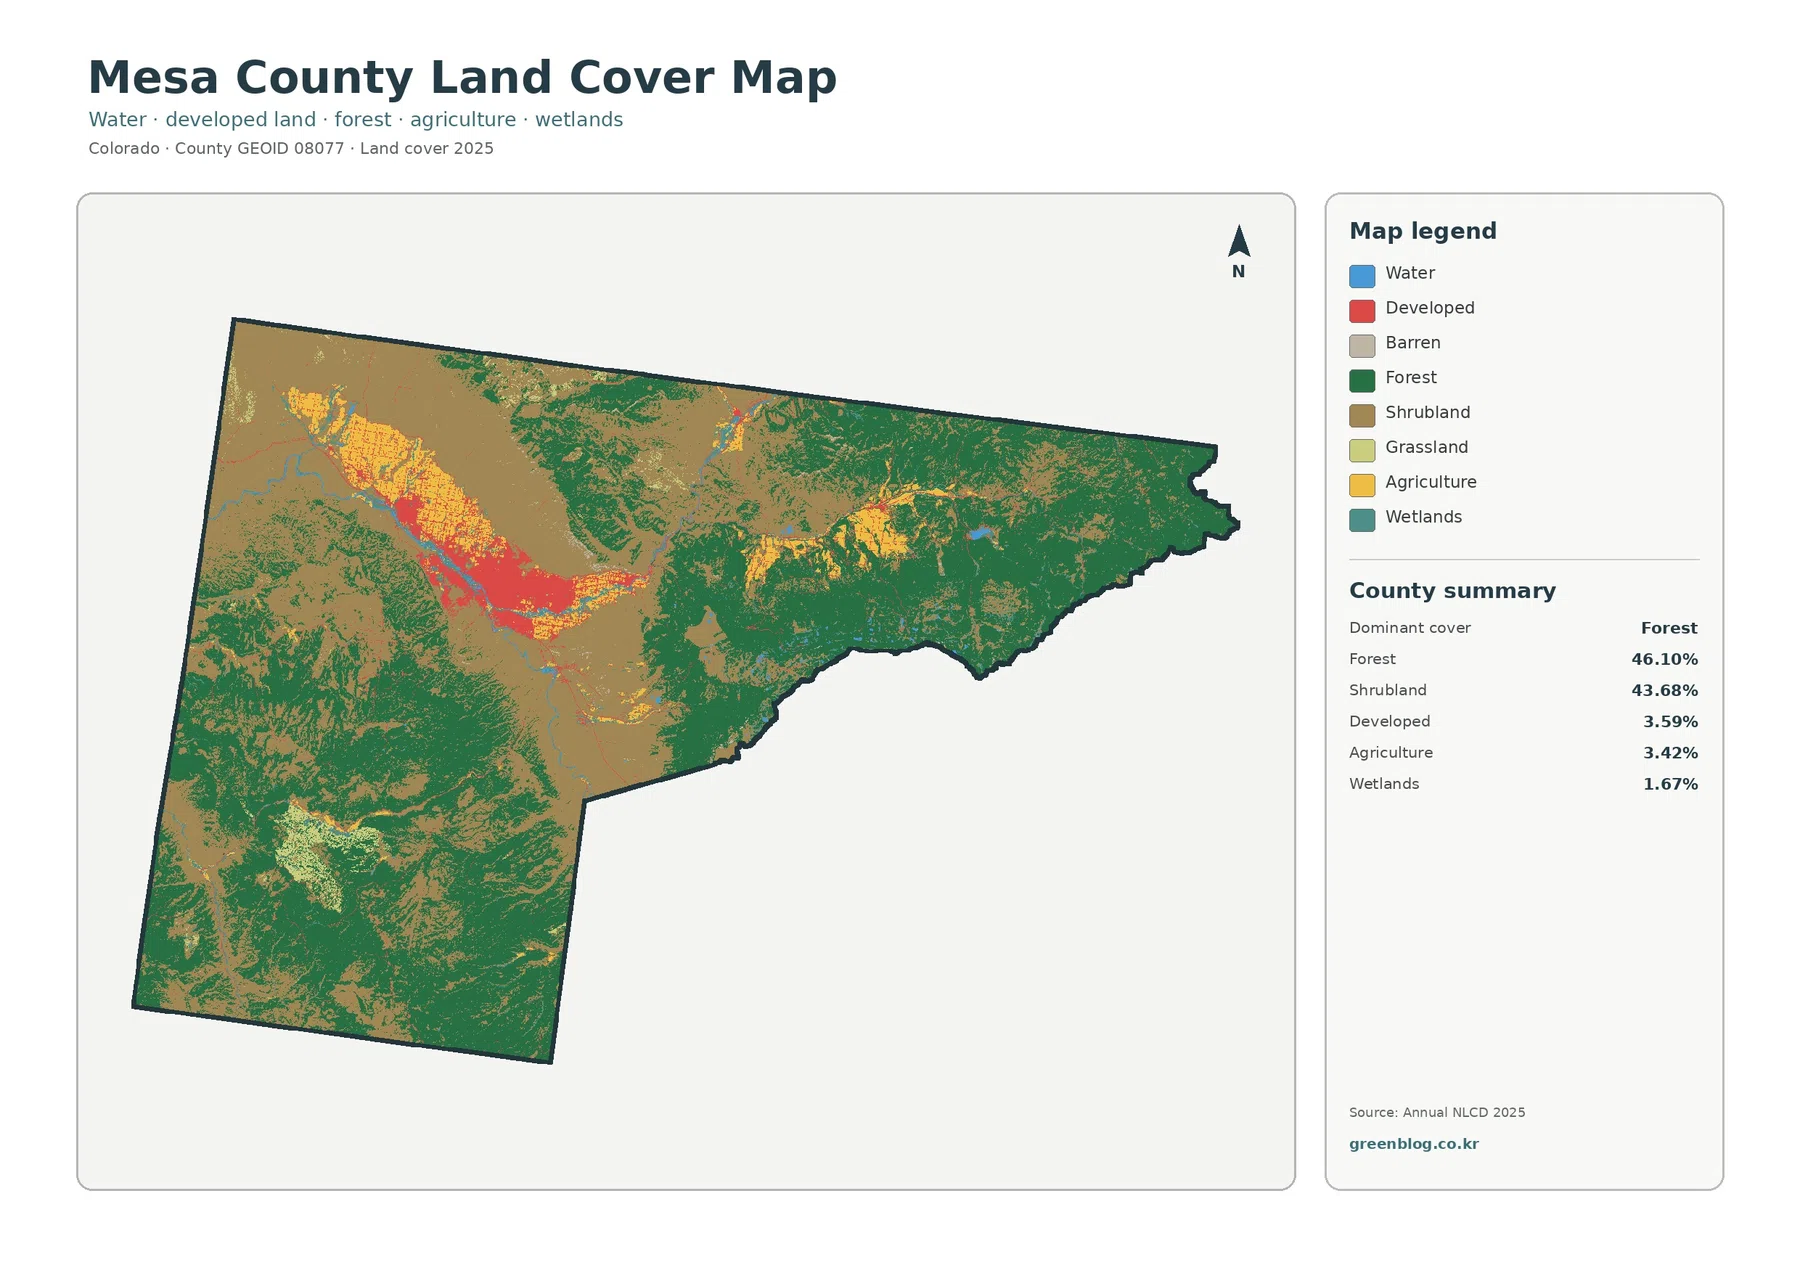
Developed land may represent only 3.59 percent of the county, but its location makes it visually prominent. The main red area is compact compared with the vast forest and shrubland regions, and agricultural cover sits close to it on several sides. This makes Mesa County a good example of why a land-cover percentage should always be read together with its map. A small countywide share can still be the dominant feature within one important valley.
The Grand Valley concentrates farming and development in a narrow part of a very large county
The broadest developed area appears around Grand Junction and stretches along the valley rather than spreading evenly across Mesa County. Agricultural land follows a similar general zone, though the farm patches are less continuous and often sit around the developed core. Outside that corridor, shrubland and forest quickly become the dominant colors. The contrast is especially clear because the county contains extensive uplands where mapped development is sparse.
Mesa County planning documents describe the Grand Valley as a broad valley associated with the Colorado and Gunnison rivers and recognize both agricultural communities and growing urban areas within the county. That local context helps explain why farming and development appear close together on the map, but the land-cover product does not map zoning or legal land use. A yellow agricultural cell describes surface cover in the classification, not a parcel’s legal designation, and a red developed cell does not indicate development rights.
The agricultural pattern is also uneven within the valley. Some areas form large yellow blocks, while other fields are broken up by development, water, shrubland, or other cover. Smaller agricultural patches appear farther east as well. Because agriculture totals only 3.42 percent countywide, those concentrated valley fields would be easy to underestimate if the summary were viewed without the map.
The forest-and-farmland view separates upland vegetation from valley agriculture
The forest-and-farmland map reduces some of the competition between land-cover colors and makes the relationship between natural vegetation and cultivated areas easier to follow. Forest occupies broad sections of the eastern and southern county, while shrub and grass cover fills much of the drier interior and northwest. Agriculture is concentrated in the Grand Valley and in a few smaller patches outside the main urban-agricultural corridor.
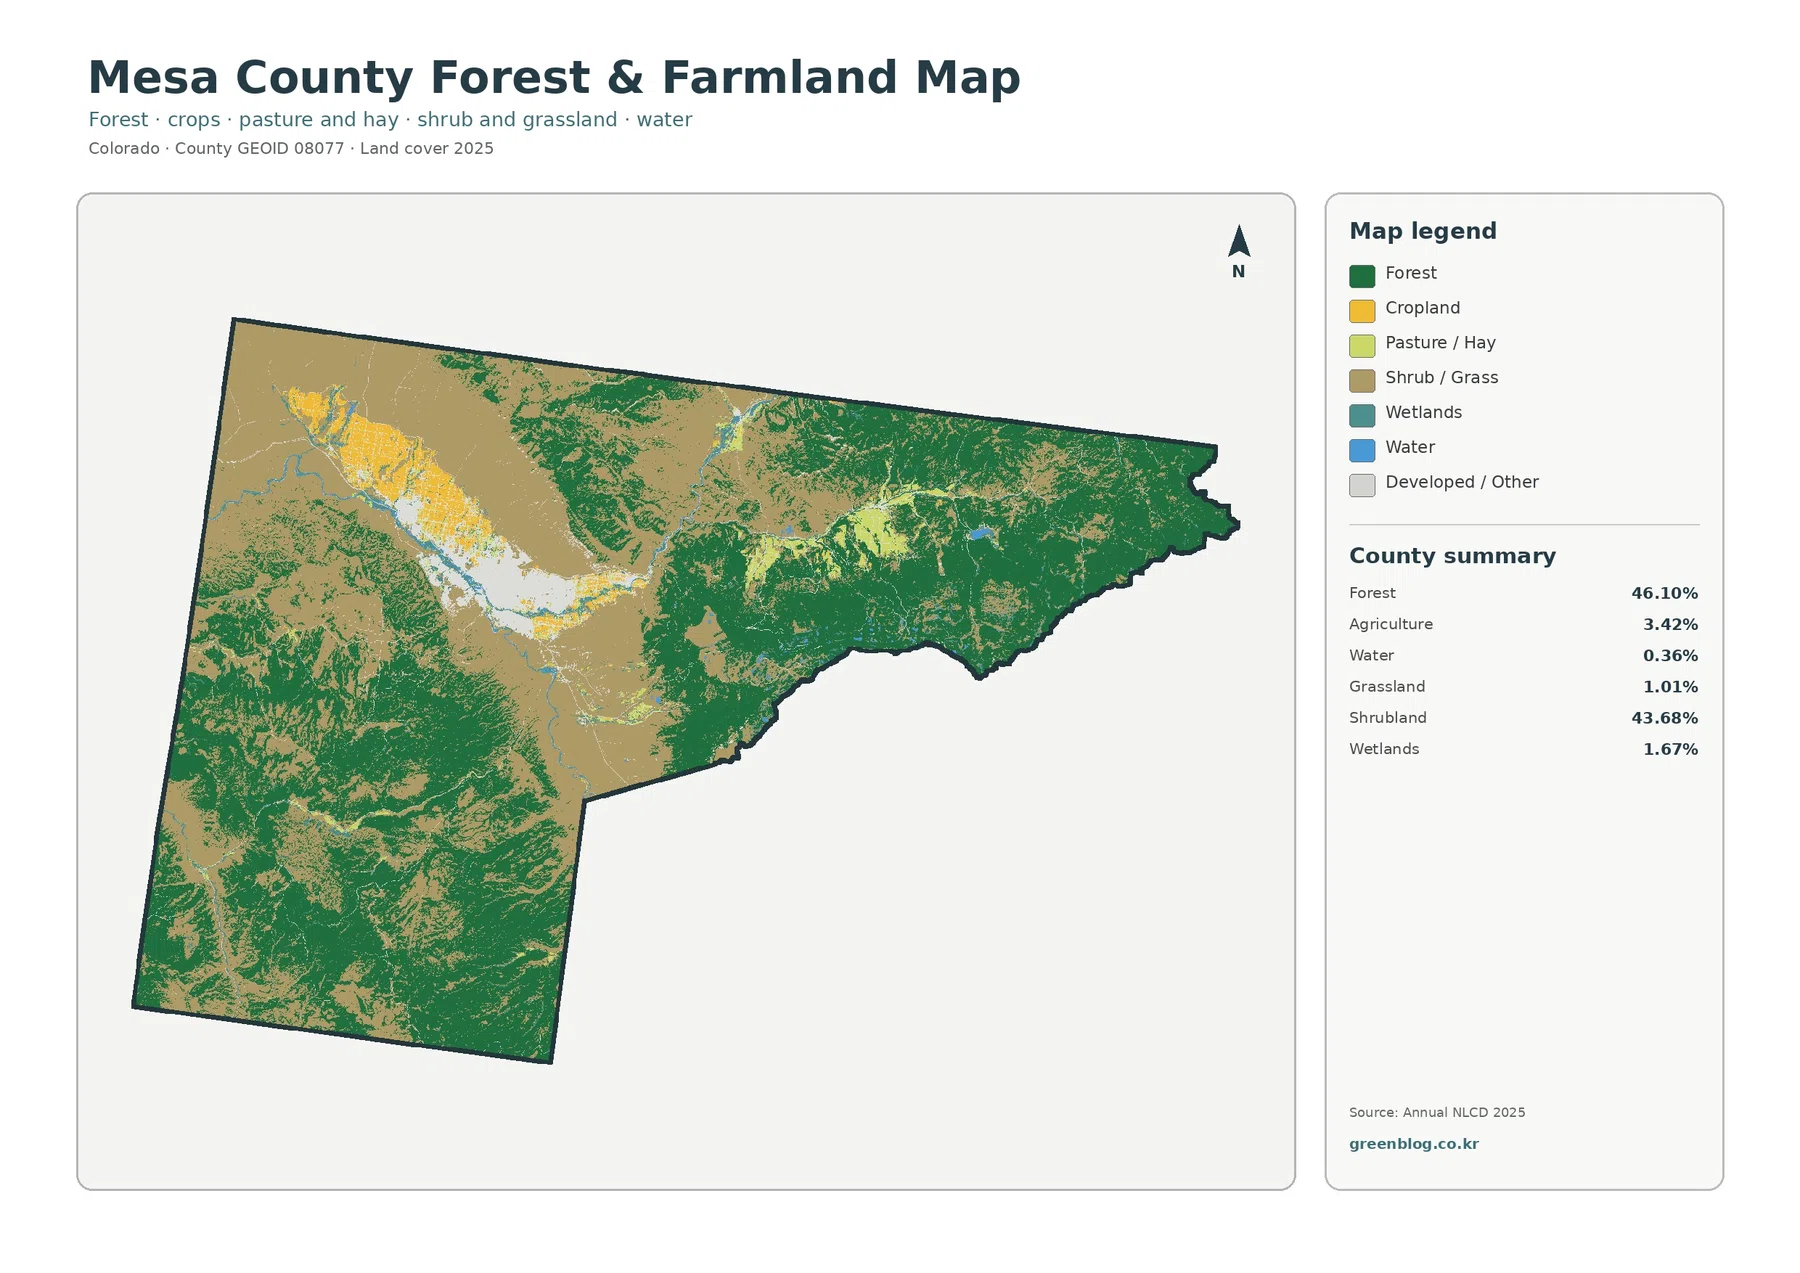
Agriculture stands out strongly even though its countywide share is modest. The farm colors are grouped rather than scattered uniformly, and they sit next to the developed valley in several places. That arrangement is useful for classroom or regional planning context because it shows where cultivated surfaces are concentrated relative to the county’s much larger areas of forest and shrubland. It does not identify crop type, irrigation method, orchard boundaries, or the legal status of individual agricultural parcels.
Forest is also a generalized class rather than a tree-by-tree inventory. Annual NLCD uses 30-meter raster cells, so a cell can contain trees, rock, shrubs, a narrow road, and open ground at the same time. Small groves or forest edges may be absorbed into another class, and the mapped boundary may not line up with a property line or a visible vegetation edge in aerial imagery. The 46.10 percent figure is most useful for broad county comparison.
River corridors add water and wetland cover through the Grand Valley
Water and wetlands occupy much less area than forest or shrubland, yet their location is easy to recognize once the valley is identified. Narrow blue and teal features run through parts of the Grand Valley and occur near both agricultural and developed cover. Mesa County’s resource management plan identifies the Colorado, Gunnison, and Dolores rivers as major perennial waterways and describes the Colorado River entering near De Beque, passing Palisade, and continuing west through the county.
The Colorado and Gunnison river system gives the valley a useful reference line when reading the maps. Agricultural patches, built surfaces, water, and wetlands appear close together in several places, while the surrounding uplands return quickly to shrubland and forest. That is a spatial association, not proof that one mapped cover caused another. Irrigation systems, water rights, floodplain rules, and river management require separate sources.
Narrow wetlands and small channels can also be underrepresented at this scale. A 30-meter cell may contain water, bank vegetation, a road, and dry ground, so the assigned class is a simplification. For watershed education, the map works well as a regional overview. For a site-level wetland boundary or a small irrigation ditch, higher-resolution imagery and specialized water or wetland data are more appropriate.
Impervious surfaces form a clear Grand Junction cluster despite a low countywide average
An impervious surface is pavement, a rooftop, a parking area, or another hard surface that does not readily absorb water. Mesa County’s mean impervious value is 1.24 percent, and 0.82 percent of the county is mapped at 50 percent or greater imperviousness. Developed cover totals 3.59 percent. These numbers are low across the county as a whole, but the map shows a strong concentration around Grand Junction and the surrounding Grand Valley.
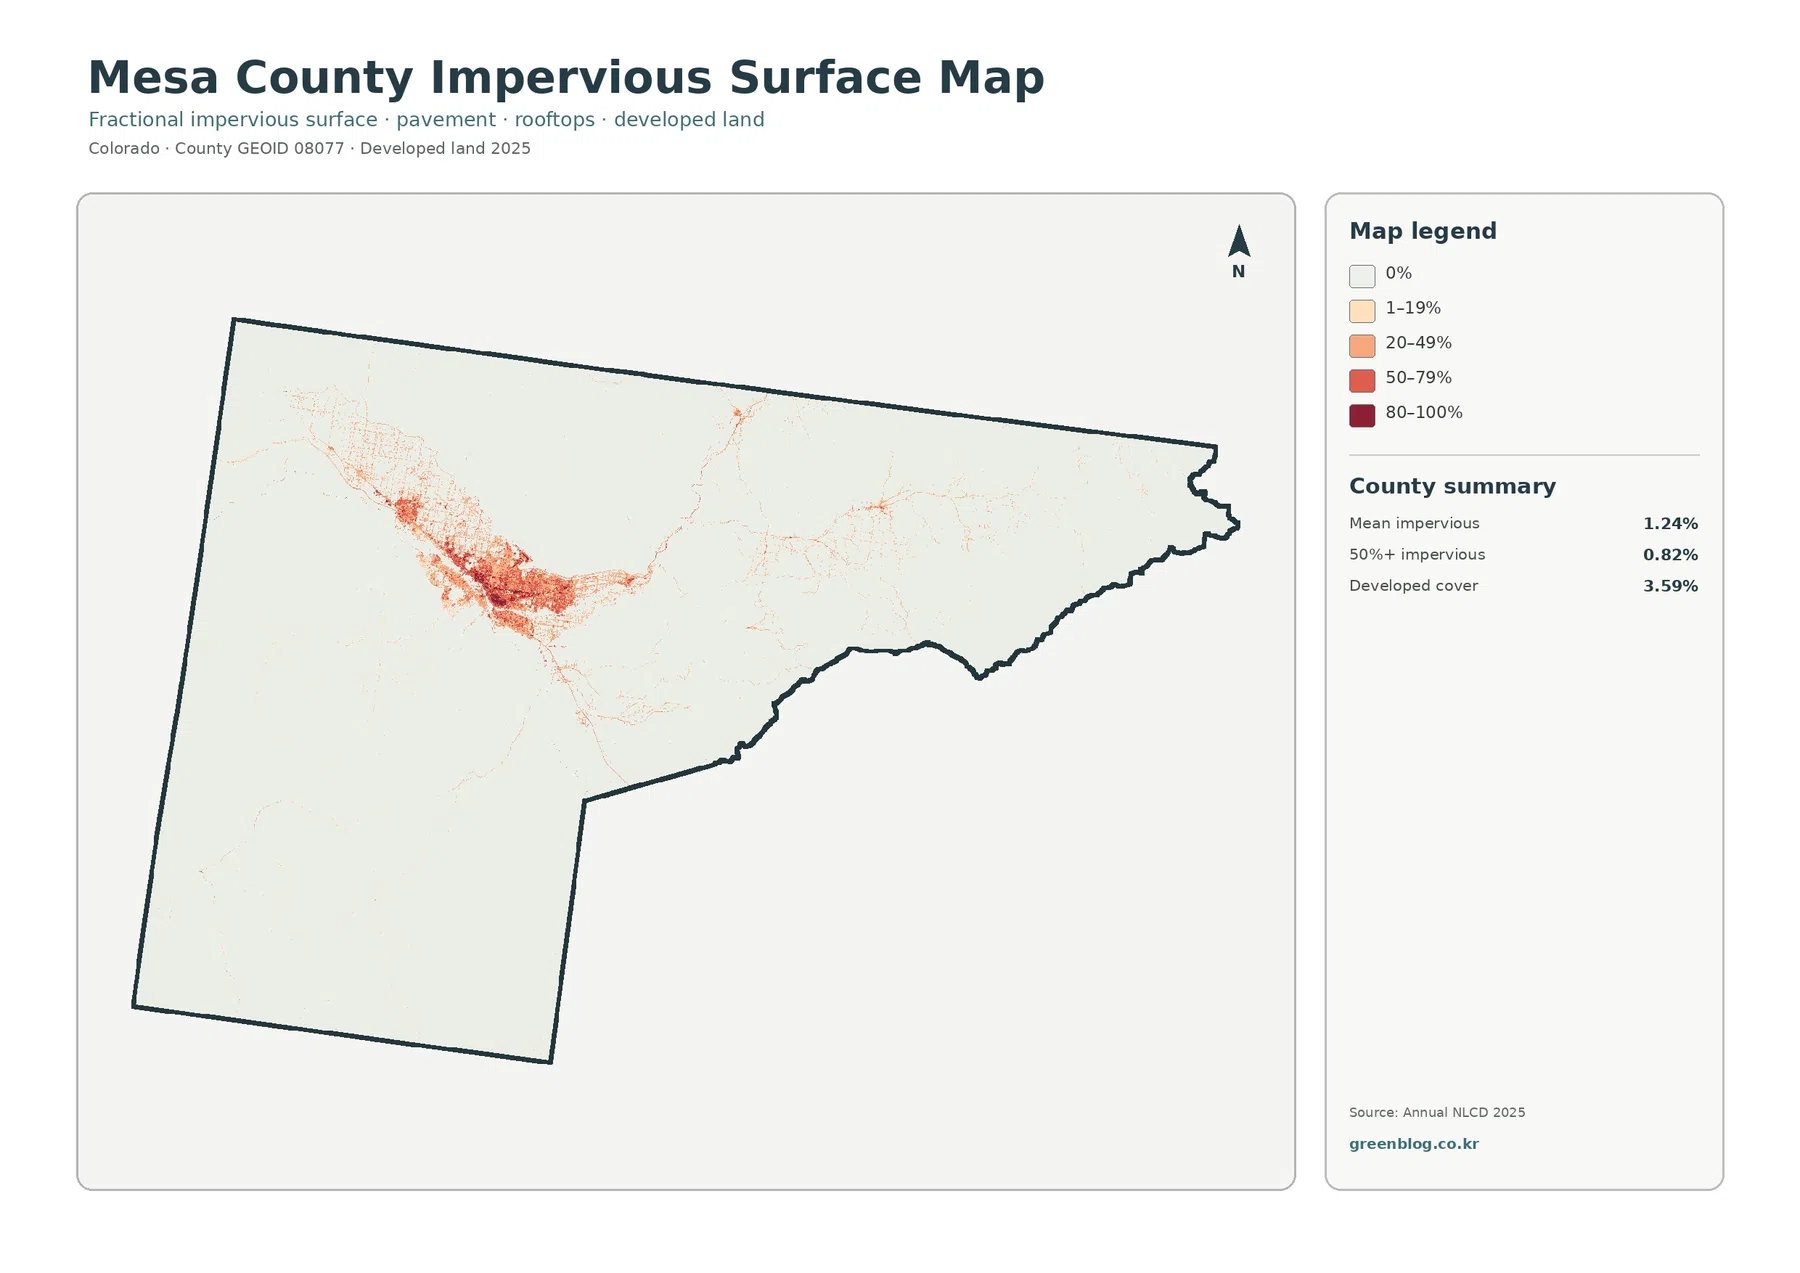
The most intense colors form a compact urban area and then extend outward in thinner lines and smaller patches. Farther into the forested and shrub-covered uplands, the map becomes almost entirely pale, showing how little hard surface is mapped there. This view is more effective than the general land-cover map when the goal is to isolate built surfaces because the dominant forest and shrub colors no longer compete for attention.
It should not be treated as a road map. Thin impervious lines may correspond to transportation surfaces, but parking lots, rooftops, industrial yards, and other hard surfaces can produce similar values. A specific road name, building use, parcel boundary, or development permit must be checked in county or municipal records. The impervious layer is best used to compare the relative concentration of built surfaces across the county.
The 1985–2025 comparison maps class differences across 9.58 percent of the county
The change map compares the mapped class at each location in 1985 with the class assigned in 2025. Mesa County shows a total class difference of 9.58 percent. The named components include 3.33 percent classified as forest loss, 1.16 percent classified to developed, 0.47 percent agricultural loss, and 4.47 percent in other differences. These are comparison categories, not direct measurements of legal land-use conversion.
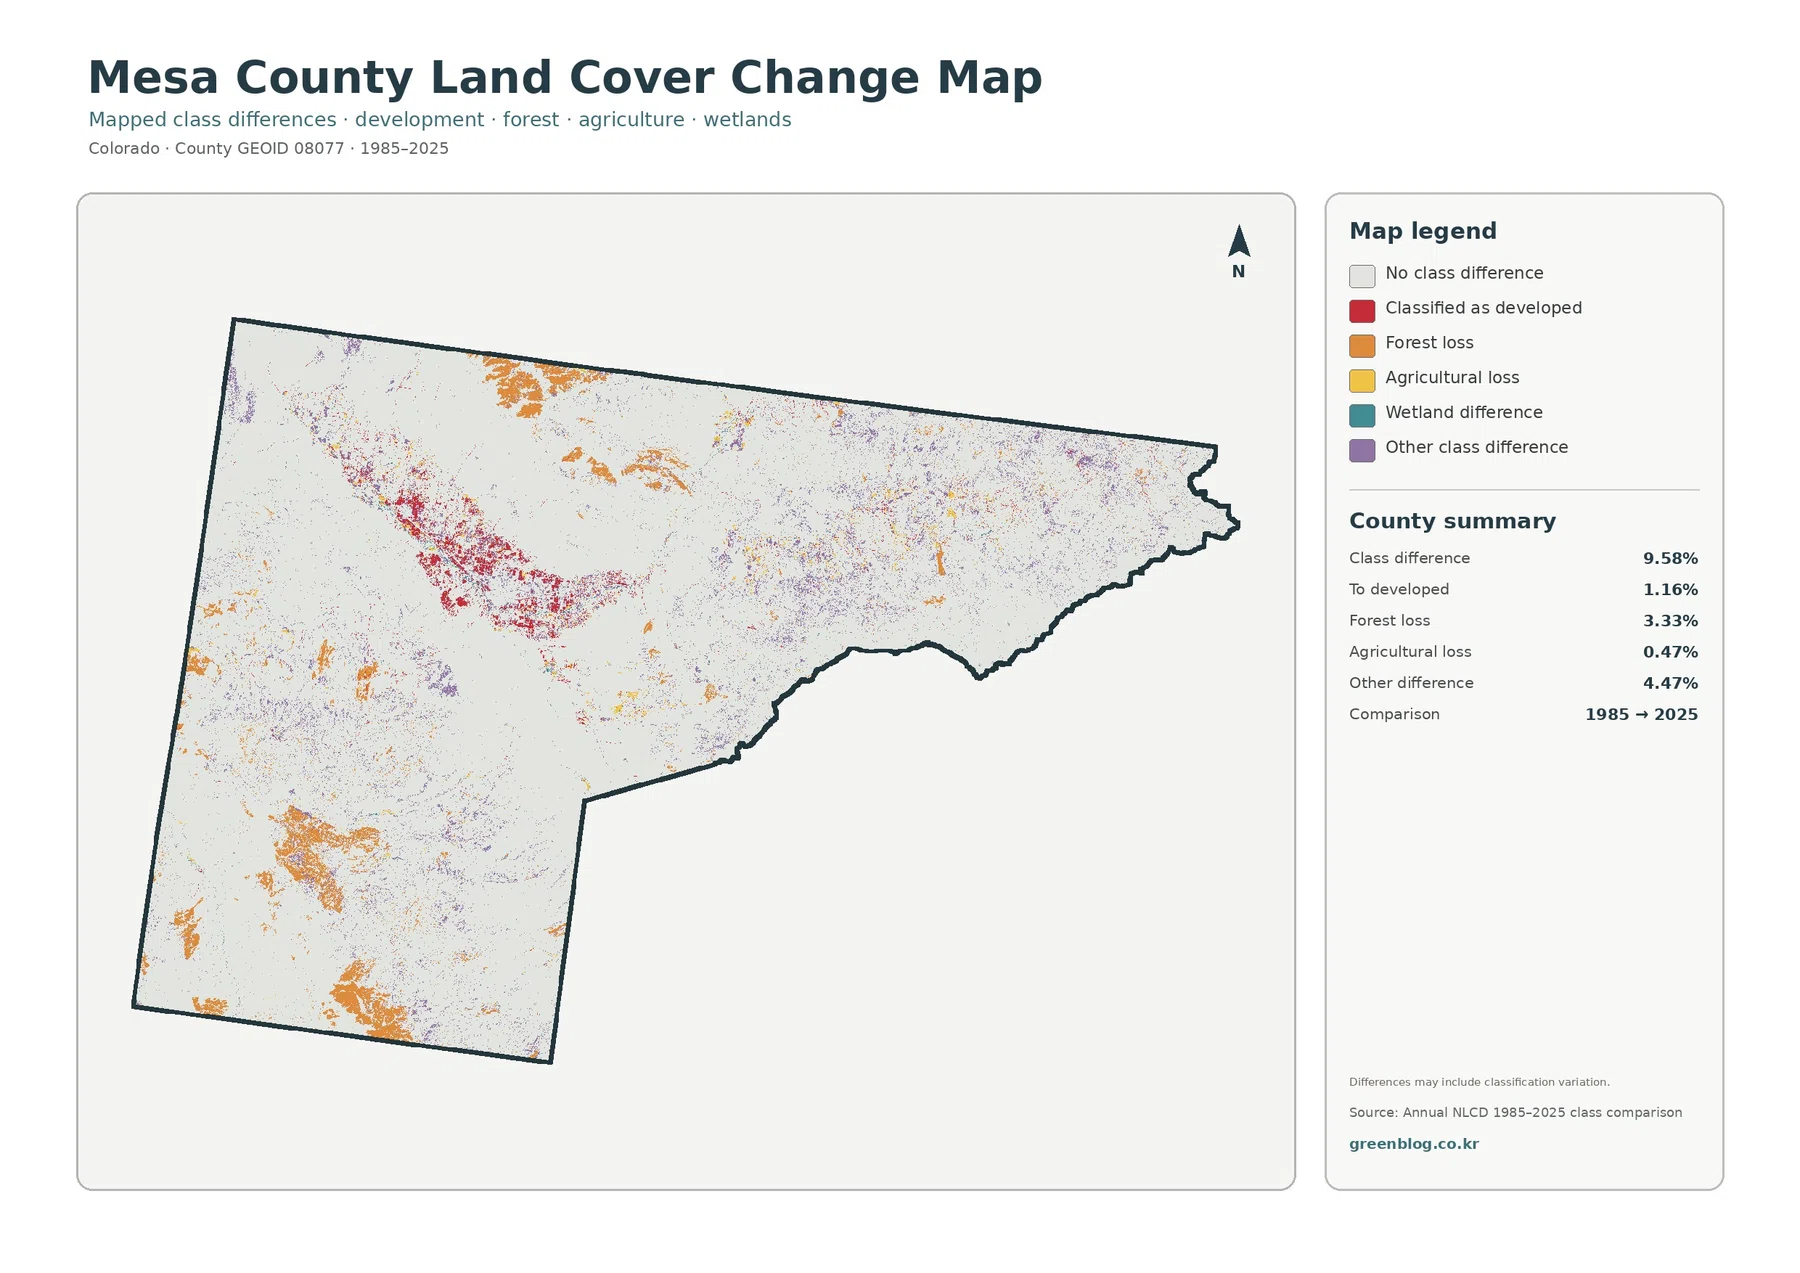
Red developed-change cells are most noticeable in and around the existing Grand Valley development cluster. Orange forest-loss patches occur in several forested parts of the county, including larger pieces in the north and south, while purple other differences are more broadly scattered. Agricultural-loss colors appear in smaller amounts around the valley. Reading these colors beside the 2025 maps helps distinguish a change category in a current forest area from one near an urban or agricultural area.
The 3.33 percent forest-loss value should not be restated as an exact 3.33 percent decline in the county’s forest resource. It means that this share of the county falls into the forest-loss category in the two-date classification comparison. Real vegetation change can be part of that pattern, but wildfire, vegetation recovery, harvest, seasonal conditions, mixed pixels, and classification uncertainty can also affect the assigned class. Intermediate-year imagery and forest or fire records are needed to determine a specific cause.
Mesa County’s mesas, canyons, forests, and valley create a strong east-west contrast
Mesa County’s official planning documents describe a landscape that includes Grand Mesa, the Book Cliffs, Colorado National Monument, McInnis Canyons, river valleys, agricultural communities, and the Grand Junction urban center. The land-cover maps do not label every one of those places, but they do show the large surface-cover differences associated with that varied setting. Broad forest and shrubland areas surround a relatively compact valley of farming, water, wetlands, and development.
For regional geography, the boundaries between colors are often more informative than any single class. Forest gives way to shrubland across large upland zones, shrubland approaches agricultural cover near the valley, and developed cover interrupts or borders cultivated areas around the urban center. Those transitions make Mesa County useful for explaining that land cover can change quickly across a short map distance when terrain and settlement patterns differ.
The maps still show association rather than cause. A developed corridor may sit near a river, farms may cluster on flatter valley ground, and forests may dominate higher terrain, but the land-cover images alone do not prove why those patterns formed. Historical settlement, water availability, transportation, public land, geology, climate, and planning all require additional evidence. Keeping that distinction clear prevents a descriptive map from being turned into an unsupported causal story.
Use the four maps in a sequence that matches the question
For a general county overview, begin with the 2025 land-cover map. It establishes the near-equal dominance of forest and shrubland and shows where agriculture, development, water, and wetlands break that pattern. If farming is the main subject, move next to the forest-and-farmland map. Its simpler legend makes the Grand Valley agricultural patches easier to trace against the surrounding natural cover.
The impervious map is the better choice when the question concerns paved and built surfaces. It removes most of the broad vegetation colors and makes the Grand Junction cluster much easier to isolate. For watershed or environmental education, the current map and farm map are usually more useful because they retain water, wetlands, vegetation, and agriculture together. Choosing the map by question keeps a small class from being mistaken for the most important countywide feature.
Use the change map after the current maps rather than before them. A colored difference cell has more meaning when the viewer already knows whether that area is presently forested, agricultural, developed, or shrub-covered. In a presentation, the sequence can move from current countywide pattern to agriculture, then to built surfaces, and finally to the 1985–2025 comparison. That order makes the visual story easier to follow without repeating the same explanation for each image.
Land cover is not zoning, ownership, or a development-rights map
Land cover classifies what the ground surface looks like in the imagery: forest, shrubland, agriculture, water, wetlands, developed cover, and related classes. Zoning is a legal planning designation, ownership identifies who holds property rights, and development rights depend on regulations, infrastructure, hazards, and other conditions. A cell classified as agriculture does not mean that a parcel is legally restricted to farming, and a developed cell does not grant permission for additional construction.
Mesa County maintains separate planning and property information for zoning, future land use, floodplains, wildfire conditions, roads, and other site-level questions. Those records should be used when a decision depends on a parcel or legal boundary. The maps on this page serve a different purpose: they provide a consistent regional view of physical surface cover and make it possible to compare vegetation, farming, water, and built surfaces across the county.
This distinction is particularly important in the Grand Valley, where agriculture and development sit close together. A land-cover map can show that those surfaces are adjacent, but it cannot establish an urban growth boundary, agricultural protection area, property ownership, or future development plan. For planning context it is a useful first layer; for an actual land-use decision it must be paired with the relevant county or municipal records.
The 30-meter raster and the mapping year set practical limits on detail
Annual NLCD is a Landsat-based raster product with 30-meter spatial resolution. A raster divides the landscape into grid cells and assigns a class or value to each cell. One cell can contain trees, shrubs, rock, a small road, a ditch, and bare ground at the same time. These mixed pixels are one reason narrow features may disappear and class boundaries may not line up exactly with a fence, parcel line, field edge, or stream bank.
The 2025 map is also a snapshot of the classification for that mapping year. Construction, paving, wildfire, vegetation recovery, crop changes, or flooding after the observation period will not appear. The change map compares 1985 and 2025, so it identifies where the two mapped classes differ but not the year when the change occurred. Recent aerial imagery or field observation is necessary for a current site-level check.
Within those limits, the maps are well suited to countywide comparison. They make the dominant forest and shrubland easy to quantify, show the Grand Valley concentration of agriculture and development, isolate impervious surfaces, and flag locations with long-term class differences. They are much less suitable for surveying a property boundary or measuring a narrow feature. Using the maps at the scale they were designed for produces more reliable conclusions.
Download the four original JPG maps for documents and side-by-side comparison
The downloadable ZIP contains all four original JPG maps for Mesa County, Colorado: the 2025 land-cover map, forest and farmland map, impervious/developed-land map, and the 1985–2025 land-cover class comparison. Because they use the same county extent, the images can be placed beside one another in reports, lessons, presentations, or reference sheets without having to realign separate map frames.
Each source JPG in the supplied asset manifest is 2480×1754 pixels. The package marks that size as not meeting its A3 high-resolution reference. If the map will be enlarged for a large poster, check sharpness at the intended print size first. For screen use, ordinary documents, moderate-size prints, and side-by-side comparison, the original JPGs are more convenient than the smaller WebP previews embedded in the article.
Frequently Asked Questions
What is the dominant land cover in Mesa County, Colorado?
Forest is the largest 2025 class at 46.10 percent, followed closely by shrubland at 43.68 percent. Together they cover nearly nine-tenths of the county. Agriculture and developed land each account for a little over three percent but are strongly concentrated in the Grand Valley.
Which map is best for seeing development around Grand Junction?
The impervious-surface map is the clearest choice because it highlights paved and built surfaces and makes the Grand Junction concentration stand out from the rest of the county. The general land-cover map is useful afterward for seeing how that urban cluster relates to nearby agriculture, water, wetlands, shrubland, and forest.
Does 3.33 percent forest loss mean Mesa County lost exactly that share of its forest?
No. The 3.33 percent value is the share of the county placed in the forest-loss category in the 1985–2025 class comparison. Real forest change may be part of the pattern, but wildfire, recovery, vegetation condition, imagery timing, mixed pixels, and classification differences can also affect the result. Intermediate-year imagery and forest or fire records are needed to measure and explain actual forest change.
Map File Information
This ZIP contains all four original JPG maps for Mesa County, Colorado: current land cover, forest and farmland, impervious/developed land, and the 1985–2025 mapped class comparison.
- Included Files: Use only the versions confirmed in the article and supplied images
- File Type: Use the confirmed download contents
- Intended Use: Printing, education, presentations, and map-based projects
Related Maps
- Adams County Colorado Land Cover Map
- Alamosa County Colorado Land Cover Map
- Arapahoe County Colorado Land Cover Map
Sources and References
These official sources provide the land-cover definitions, county boundary data, and local context for Mesa County’s Grand Valley, natural lands, and major river system.
- MRLC Annual NLCD Data – annual land-cover and related datasets
- USGS Annual NLCD Land Cover Classification – class definitions and documentation
- U.S. Census Bureau TIGER/Line Shapefiles – county boundary data
- Mesa County Mesa Together Master Plan – local context for Grand Junction, the Grand Valley, natural lands, and planning areas
- Mesa County Resource Management Plan – major waterways and natural-resource information
Green Map creates custom-edited map images using open geographic data sources such as geoBoundaries, Natural Earth, OpenStreetMap, and government open data.
These maps are edited visual materials, not raw data files, and are provided for education, documents, presentations, and graphic reference.