Gunnison County is mostly forest and shrubland, but the 2025 land-cover map also contains a broad open basin, Blue Mesa Reservoir, wetlands, and a few compact developed areas. Forest covers 54.25% of the county and shrubland 35.13%, so the most useful comparison is not city versus countryside but forested mountains versus the more open basin.
This page uses four maps to separate current land cover, forest and farmland, impervious surfaces, and mapped differences from 1985 to 2025. All four original JPG maps are packaged in one ZIP near the end of the article for printing, classroom use, presentations, or closer inspection.
Table of Contents
Forest and shrubland dominate, but the central basin changes the map
The 2025 summary lists forest at 54.25%, shrubland at 35.13%, wetlands at 2.72%, barren cover at 2.66%, grassland at 2.17%, agriculture at 1.40%, developed cover at 1.18%, and water at 0.50%. Forest plus shrubland account for nearly 89% of the county.
Large dark-green forest blocks occupy the west, northwest, east, and many high mountain margins. The central and south-central basin contains more tan shrubland and small areas of grassland, agriculture, and wetlands. Pale barren classes interrupt forest on several high ridges and open alpine-looking areas.
That distribution is more informative than calling Gunnison County simply “forested.” The interior basin is visibly more open than the mountain edges, and the forest–shrubland boundary changes repeatedly with local terrain.
Land cover is not zoning, ownership, or a parcel survey. Annual NLCD classifies the surface in 30-meter raster cells using remotely sensed information. A forest cell does not identify forest management, and a developed cell does not distinguish residential, commercial, or public land.
The simplified map makes the open basin easier to separate from forested mountains
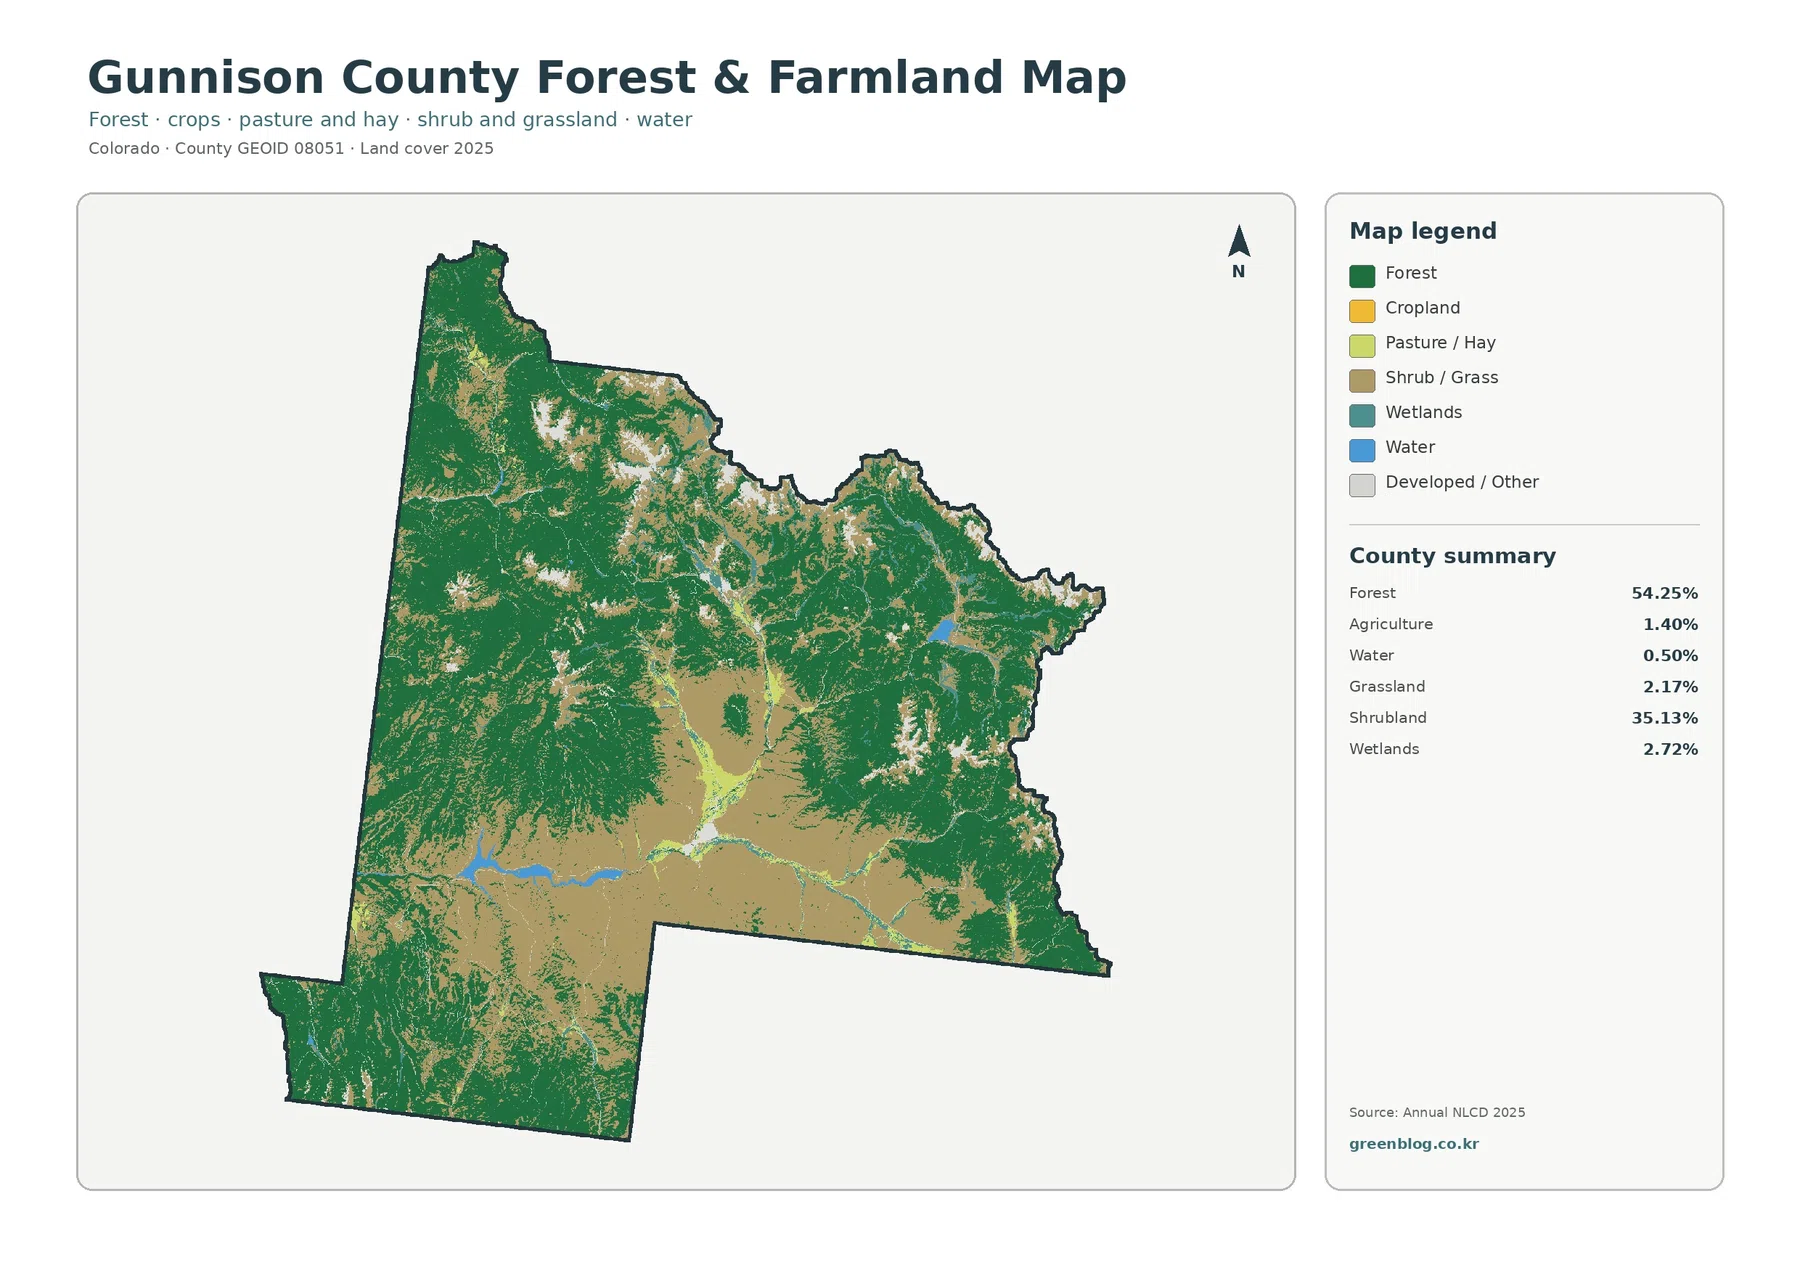
Reducing the number of legend classes makes the main natural-cover contrast clearer. Forest remains dark green around the outer mountain areas, while shrub-and-grass cover fills much of the open interior basin.
Agriculture covers only 1.40%. Yellow and light agricultural patches appear in selected parts of the central basin rather than forming a continuous farm belt. Their small size keeps the focus on forest versus open shrub-and-grass cover.
Blue Mesa Reservoir remains a useful location marker on this simplified view. Once the large blue water body is found, the more forested terrain to the west and north can be compared with the broader open cover to the east and south.
Agricultural pixels should not be treated as surveyed farm parcels. One 30-meter cell can contain grass, exposed soil, vegetation, a road, or several surface types. Ownership, crop type, grazing, and irrigation require separate local data.
Blue Mesa Reservoir stands out even though water covers only 0.50%
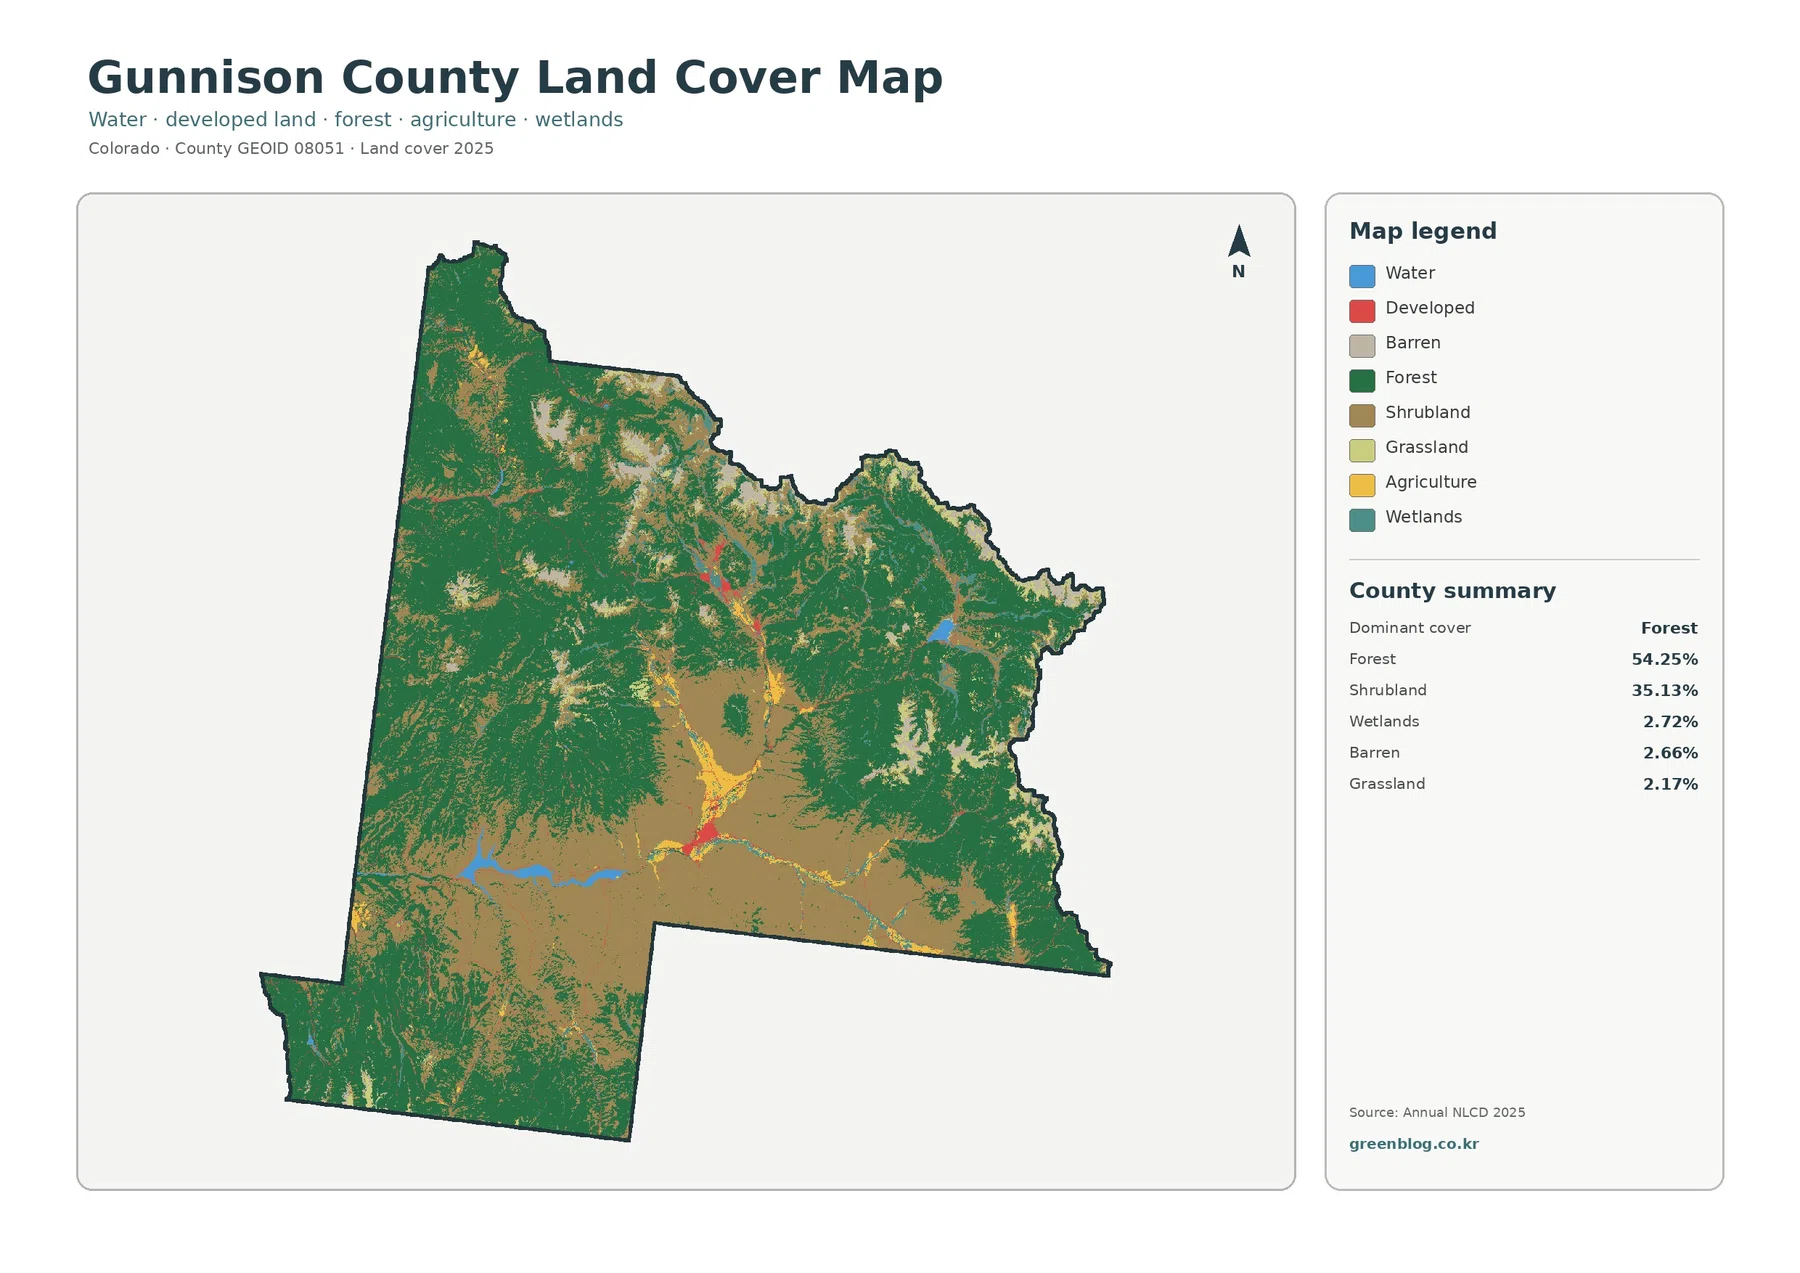
The most recognizable water feature is Blue Mesa Reservoir in the west-central county. National Park Service material places it west of Gunnison within Curecanti National Recreation Area and describes it as the largest and most accessible of the three Curecanti reservoirs.
Water is only 0.50% of the county, yet concentration gives the reservoir a much stronger visual presence than that percentage suggests. A single large water body is easier to notice than the same total area scattered among many tiny features.
Wetlands cover 2.72%, more than five times the open-water share. Blue-green wetland traces occur around parts of the reservoir and along narrow drainage-like routes through the basin. They are useful for broad context but are not legal wetland boundaries.
East and south of the reservoir, shrubland, grassland, and agriculture become more noticeable. Moving toward the mountain margins brings broad forest back into view. The reservoir therefore works as a practical anchor for understanding the transition from open basin to forested slopes.
A 0.26% mean impervious surface reveals very limited built cover
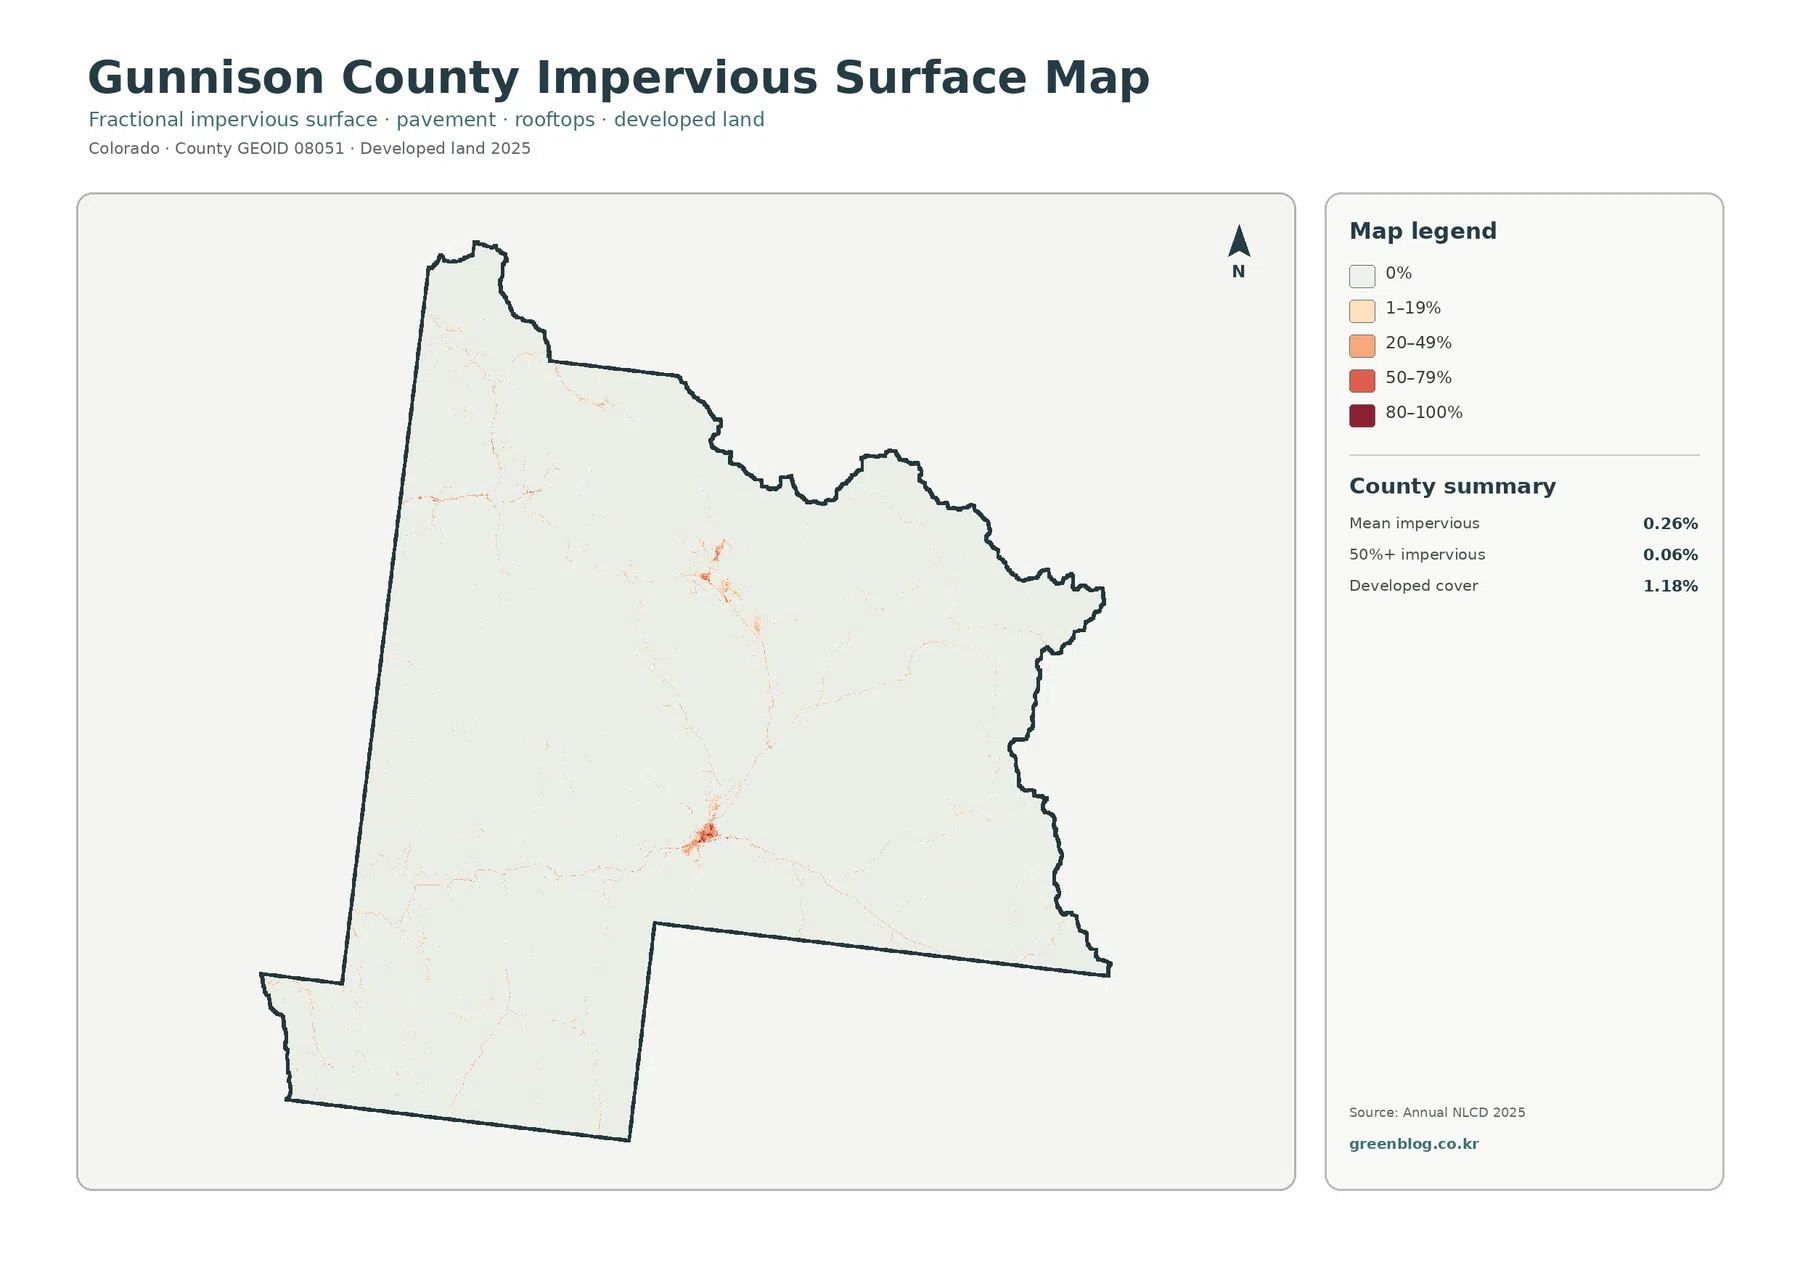
Impervious surface means pavement, rooftops, parking areas, and similar hard materials that reduce direct water infiltration. Gunnison County’s mean imperviousness is 0.26%, and cells mapped at 50% or greater imperviousness account for only 0.06% of the county.
Most of the map is almost white. Higher values form one noticeable cluster in the south-central basin and a smaller cluster farther north, with narrow road-like traces extending between or away from those areas.
Developed cover at 1.18% is a different measurement. The land-cover map assigns cells to developed classes, while fractional imperviousness estimates how much of each cell is physically covered by pavement, roofs, or another hard surface.
Mountain settlements often contain substantial vegetation and open ground between buildings and roads, so developed cover can be much larger than mean imperviousness. Gunnison County GIS and its Map Viewer provide parcel, address, aerial imagery, and other local layers for questions that need more detail.
The 1985–2025 class-difference footprint is relatively small at 4.31%
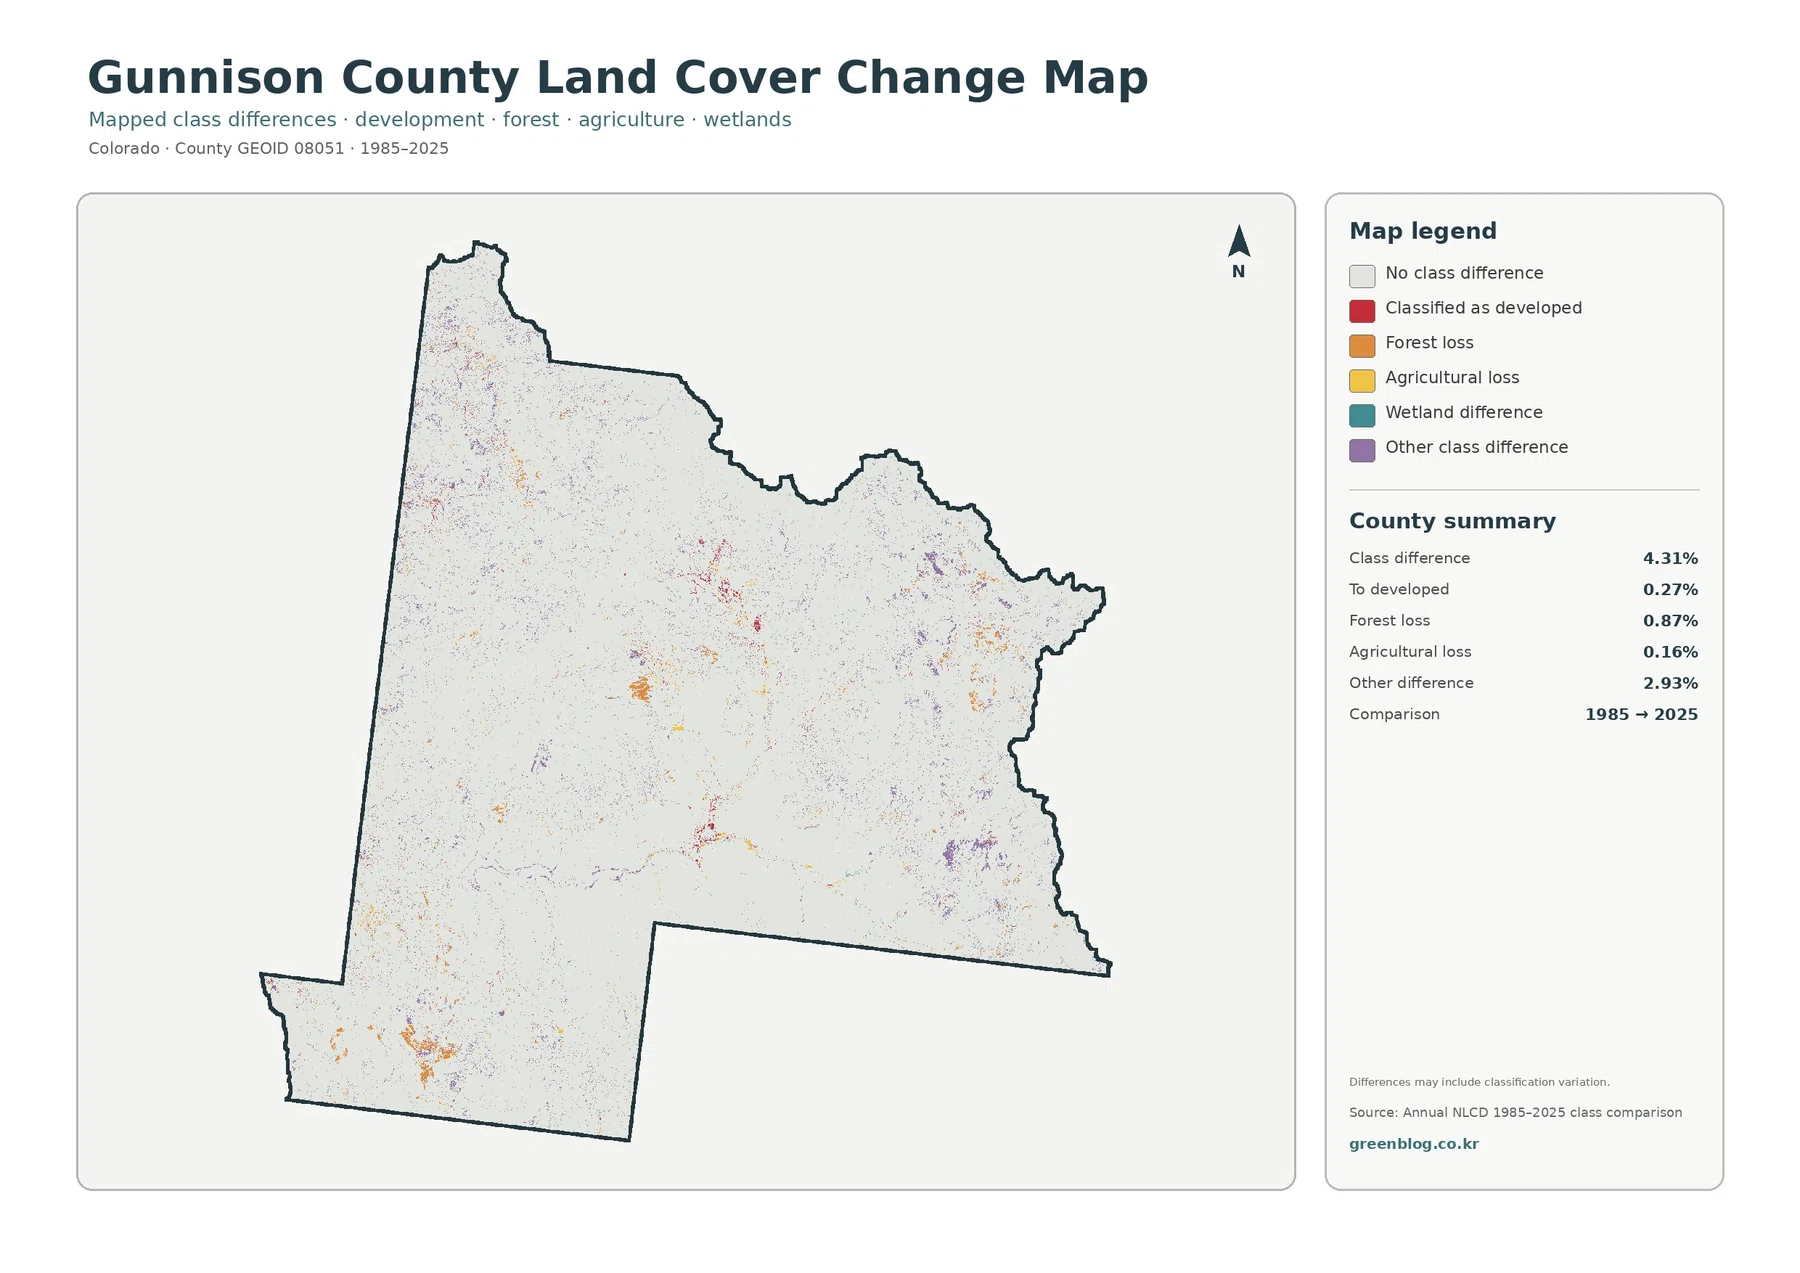
Mapped classes differ across 4.31% of Gunnison County between 1985 and 2025. Other class difference is the largest category at 2.93%, followed by forest loss at 0.87%, conversion to developed at 0.27%, and agricultural loss at 0.16%.
Red conversion-to-developed pixels appear near some of the same south-central and north-central settlement areas that show current imperviousness. They do not represent the complete 2025 developed footprint; they mark cells that shifted into a developed class in the two-date comparison.
Orange forest-loss patches occur in several western, eastern, and southwestern areas. The 0.87% category does not identify why the class changed. Fire, vegetation disturbance, timber change, recovery, and classification variability require additional evidence.
Purple other-difference pixels account for 2.93% and are scattered across the county. Because the map notes that class differences can include classification variation, isolated pixels should not automatically be treated as confirmed physical change.
Use Blue Mesa as an anchor, then move into the open Gunnison basin
As a location anchor, Blue Mesa Reservoir is easy to identify on the current and simplified maps, making it a practical starting point for comparing all four views. On the impervious map, most nearby terrain remains pale; the change map adds only scattered differences around the broader natural landscape.
Moving east into the central basin brings more shrubland, grassland, agriculture, and the strongest developed cluster. Moving toward the outer mountains returns to broad forest. That sequence explains the county more clearly than any single percentage.
The National Park Service places Blue Mesa west of Gunnison and notes access by U.S. Highway 50. Because the supplied land-cover images do not label roads or town boundaries, Gunnison County’s GIS or Map Viewer is more appropriate for exact route and property locations.
Development remains secondary to natural cover. Forest and shrubland together approach 89%, while developed cover is only 1.18%. The impervious and change layers therefore work best as additions to the basic forest–basin pattern rather than as the main story.
What 30-meter raster cells can and cannot tell you
Annual NLCD is produced with 30-meter raster cells. One cell can contain trees, shrubs, grass, soil, water, pavement, or buildings at the same time, yet the land-cover layer assigns a representative class. Fractional imperviousness estimates hard-surface share separately.
Small countywide percentages can still create strong local features. Water is 0.50%, developed cover 1.18%, and highly impervious cells 0.06%, but Blue Mesa and the main settlement clusters remain easy to see because their pixels are geographically concentrated.
The 4.31% class-difference figure cannot be added to or subtracted from current cover percentages. Forest loss at 0.87% is not current forest area, and conversion to developed at 0.27% is not the entire current developed class.
Current land-cover and impervious maps represent 2025. New construction, fire effects, vegetation recovery, or reservoir-edge changes after that year may not appear, so current site decisions need newer local information.
Choose the Gunnison County map that matches the question
Use the general land-cover map first for a complete county overview. It places forest, shrubland, Blue Mesa Reservoir, wetlands, grassland, agriculture, barren cover, and small developed areas in one frame.
The forest-and-farmland map is better for contrasting forested mountains with the open basin. The impervious map is best for locating the hardest-surfaced settlement areas, while the change map is appropriate when the question involves differences between 1985 and 2025.
Pair current land cover with the change map when discussing long-term differences. That keeps current forest separate from forest loss and current development separate from conversion to developed.
For classroom or presentation use, three areas give a clear structure: Blue Mesa Reservoir, the open central Gunnison basin, and the forested mountain margins. Together they show the county’s main land-cover contrasts without repeating the same map description four times.
Download the four Gunnison County JPG maps
The ZIP contains four original JPG files: general land cover, forest and farmland, impervious/developed land, and 1985–2025 land-cover change. The article’s WebP images are optimized for quick online viewing, while the JPG files are better for separate inspection and printing.
Keep each map’s title, year, and legend when reusing it. Current forest and forest loss, developed cover and imperviousness, and current development and conversion to developed are related but different measurements.
Frequently Asked Questions
What are the dominant land-cover classes in Gunnison County?
At 54.25%, forest is the largest 2025 class, followed by shrubland at 35.13%. Together they cover about 89% of the county, although their relative importance changes between mountain slopes and the more open basin.
Why is Blue Mesa Reservoir so visible if water covers only 0.50%?
Water is concentrated rather than evenly distributed. A large reservoir occupying one compact area is visually prominent even when the total countywide water share is small.
Does the 4.31% 1985–2025 class difference equal physical land change?
No. It represents cells whose mapped classes differ between the two years. Real surface change can contribute, but classification variation may also be present, so a specific cause requires additional imagery or local records.
Map File Information
The download ZIP contains four original Gunnison County land-cover JPG maps.
- Included Files: Use only the versions confirmed in the article and supplied images
- File Type: Use the confirmed download contents
- Intended Use: Printing, education, presentations, and map-based projects
Related Maps
- Adams County Colorado Land Cover Map
- Alamosa County Colorado Land Cover Map
- Arapahoe County Colorado Land Cover Map
Sources and References
- MRLC Annual NLCD Data – official access point for Annual NLCD products and data.
- USGS Annual NLCD Land Cover Classification – official documentation for interpreting Annual NLCD classes and 30-meter raster data.
- Gunnison County Geographic Information Services – official county GIS information for parcels, addresses, aerial photography, and local geographic data.
- Gunnison County Map Viewer – official county map service for local geographic reference.
- Curecanti National Recreation Area – Reservoirs – National Park Service information about Blue Mesa Reservoir and the Curecanti reservoirs.
Green Map creates custom-edited map images using open geographic data sources such as geoBoundaries, Natural Earth, OpenStreetMap, and government open data.
These maps are edited visual materials, not raw data files, and are provided for education, documents, presentations, and graphic reference.