Hinsdale County is a high-mountain landscape where forest covers 51.72% of the 2025 map, but broad grassland, shrubland, barren alpine surfaces, wetlands, and water keep the county from looking uniformly forested. Lake San Cristobal provides a clear central landmark, while developed cover remains concentrated around a few narrow settlement and road areas.
The four views on this page separate current land cover, forest and open land, impervious surfaces, and mapped class differences from 1985 to 2025. All four original JPG maps are available together in one ZIP for printing, classroom use, presentations, and detailed comparison.
Table of Contents
Forest dominates, but the western and northern high country opens up
The 2025 summary puts forest first at 51.72%, followed by grassland at 18.66%, shrubland at 15.24%, barren cover at 7.95%, and wetlands at 4.61%. Agriculture is 0.43%, water 0.50%, and developed cover 0.88%. The county is therefore overwhelmingly natural, but several natural-cover classes occupy substantial areas.
Large dark-green forest blocks fill much of the east, south, and interior. Moving toward the west and northwest, forest breaks more often into pale grassland, shrubland, and barren-looking high-elevation surfaces. Similar openings appear along high ridges elsewhere, producing a patchwork rather than a single continuous forest.
Hinsdale County’s official website describes a county covered by mountains, including five peaks above 14,000 feet and more than twenty above 13,000 feet. The Continental Divide crosses the county twice. A 2025 county wildfire plan gives an elevation range from about 8,000 feet at the southern boundary to 14,309 feet on Uncompahgre Peak.
Those elevation facts are not measurements from the land-cover map, but they help explain why forest gives way to grassland, shrubland, and barren surfaces in some high-country areas. The same wildfire plan notes that three national forests and four wilderness areas cover large parts of Hinsdale County.
The county also reports that about 96.5% of its land is public. That ownership pattern should not be confused with the NLCD classes: public land can contain forest, shrubland, grassland, water, or barren cover. Still, it provides useful local context for why development occupies such a small share of the county.
Lake San Cristobal anchors the water and wetland pattern
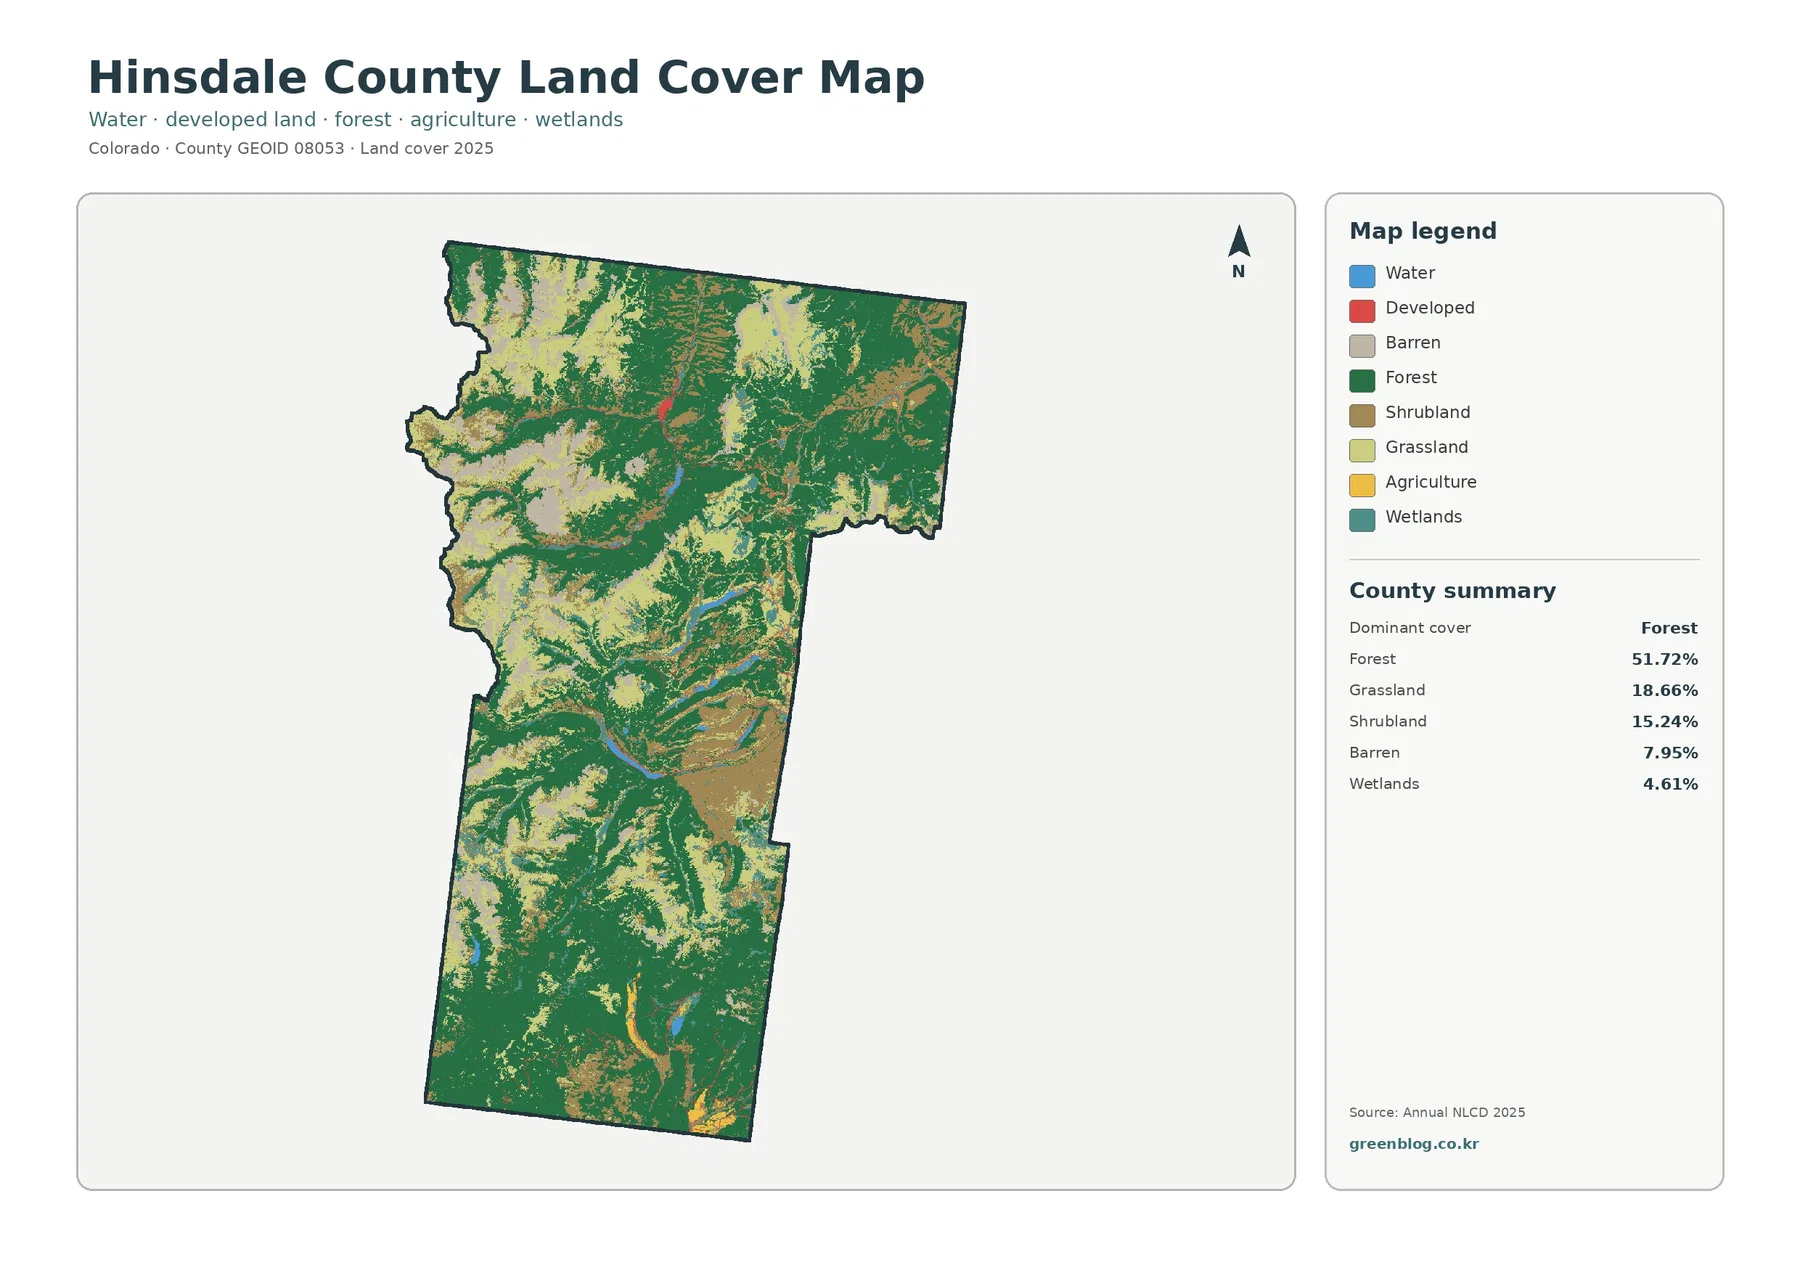
A blue water body near the county’s center is one of the easiest features to locate on the current map. Hinsdale County explains that the Slumgullion Earth Flow dammed the Lake Fork of the Gunnison River and created Lake San Cristobal. That local geologic history makes the lake more than a generic water patch on the map.
Water covers only 0.50% of the county, yet concentration makes the lake visually prominent. Surrounding forest, shrubland, grassland, and wetland colors create a strong contrast around the water. Small water features elsewhere are much less obvious at web-preview scale.
Wetlands cover 4.61%, far more than open water. Blue-green wetland traces follow narrow valley and drainage-like routes in several parts of the county. The 2025 wildfire plan identifies the Lake Fork of the Gunnison River, Cebolla Creek, Henson Creek, and the Rio Grande headwaters among important waterways in Hinsdale County.
The NLCD wetland class is useful for broad landscape context, but it is not a legal wetland determination. Narrow mountain valleys can contain mixed water, vegetation, soil, and developed surfaces within the same 30-meter neighborhood, so site-specific boundaries require more detailed data.
A simplified legend makes the forest-to-open-cover transition easier to follow
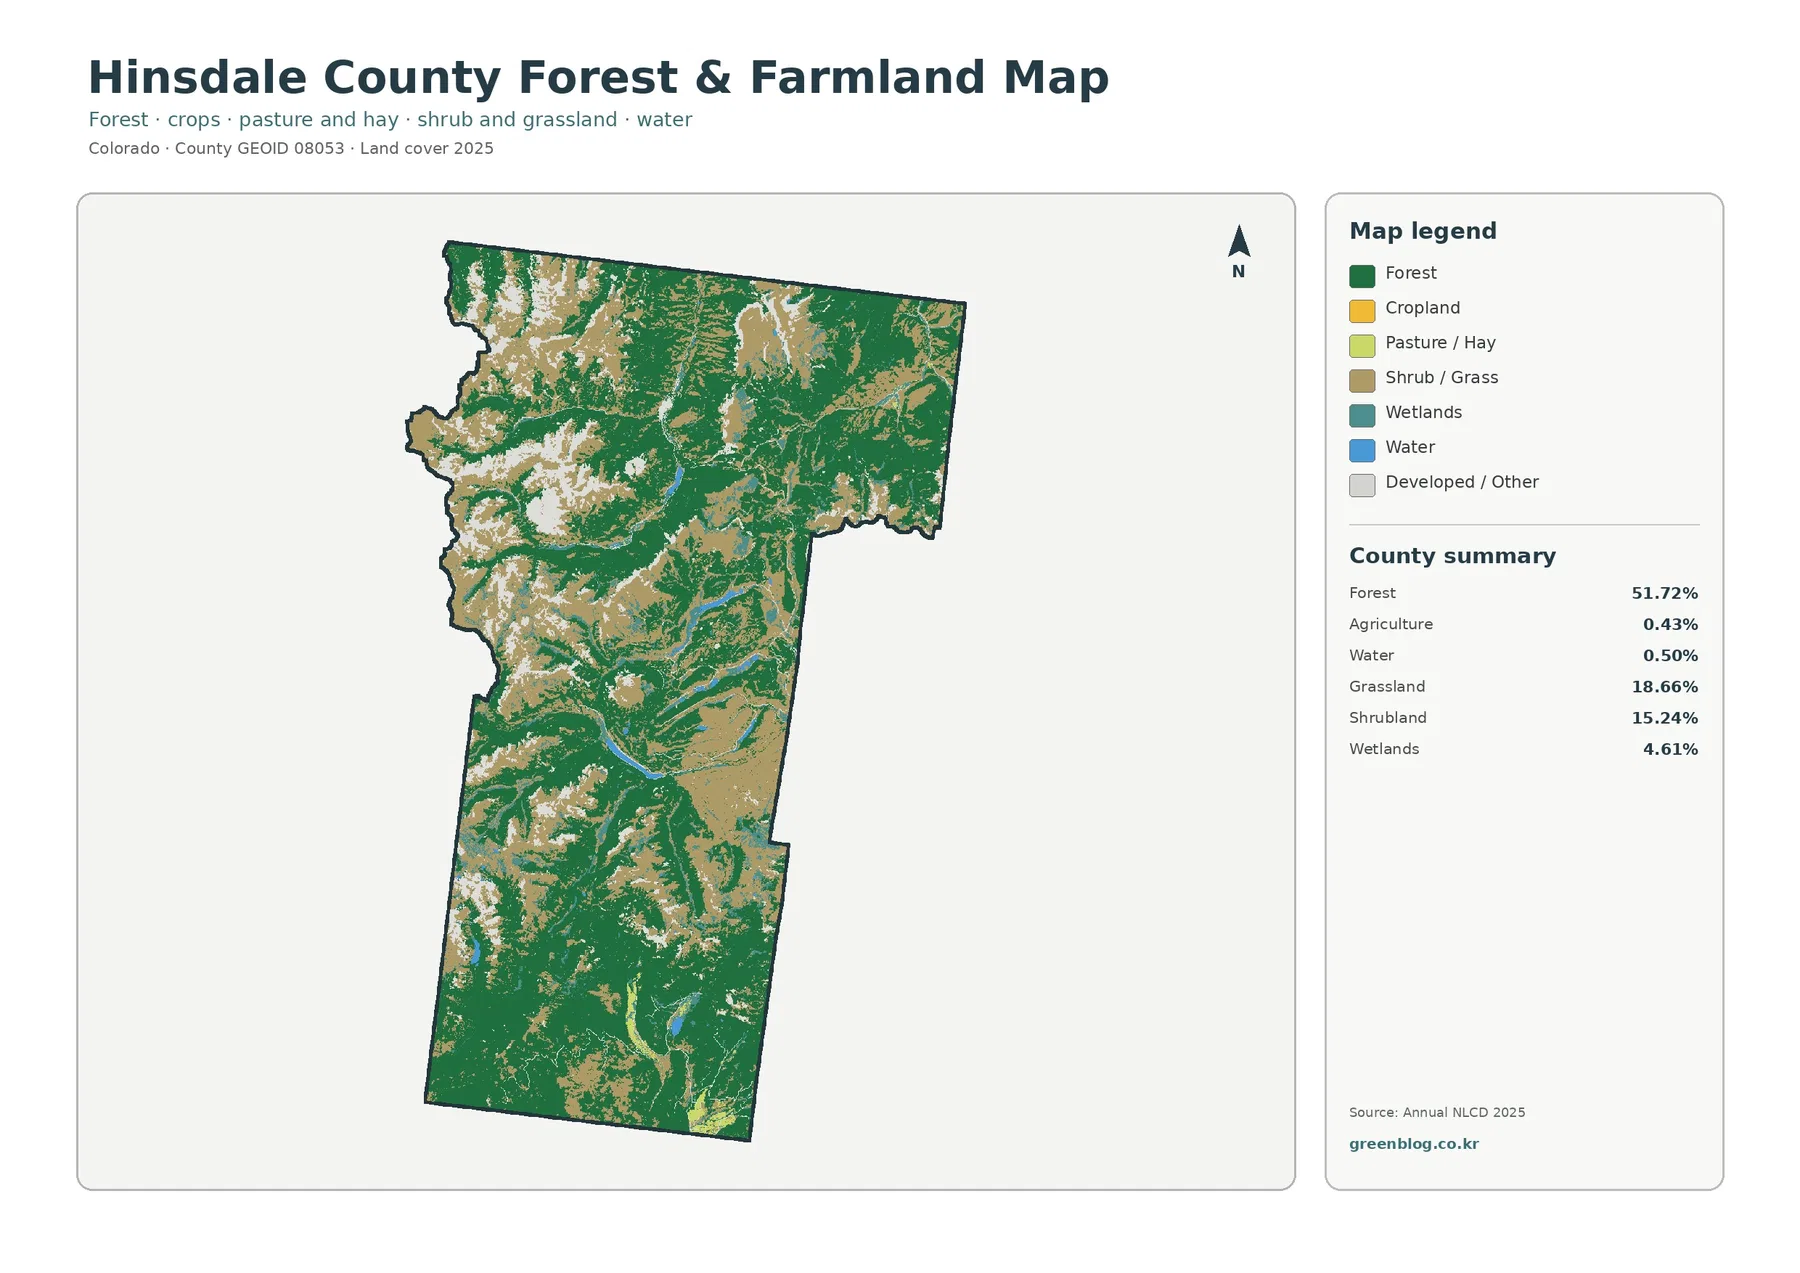
With fewer classes in the legend, forest stands out as broad dark-green areas through the interior, east, and south. Shrub-and-grass cover becomes more obvious in the west and northwest, where open high-country surfaces interrupt the forest more frequently.
Agriculture accounts for only 0.43%. Small yellow or light agricultural patches appear in limited valley-like areas rather than forming a continuous farming district. For Hinsdale County, this map is therefore more useful for comparing forest with open natural cover than for studying cropland.
Open surfaces also occur in the southern and northern high country, where forest breaks into grass, shrub, or barren-looking patches. Those areas are easier to explain with the simplified map because the reader does not have to distinguish every detailed NLCD class at once.
Official county material lists the San Juan, Rio Grande, and Grand Mesa–Uncompahgre–Gunnison national forests as major land-management areas. Forest-colored pixels do not equal national-forest boundaries, however. Surface cover and administrative ownership are separate datasets and should remain separate in any interpretation.
Lake City is the clearest concentration of hard surfaces
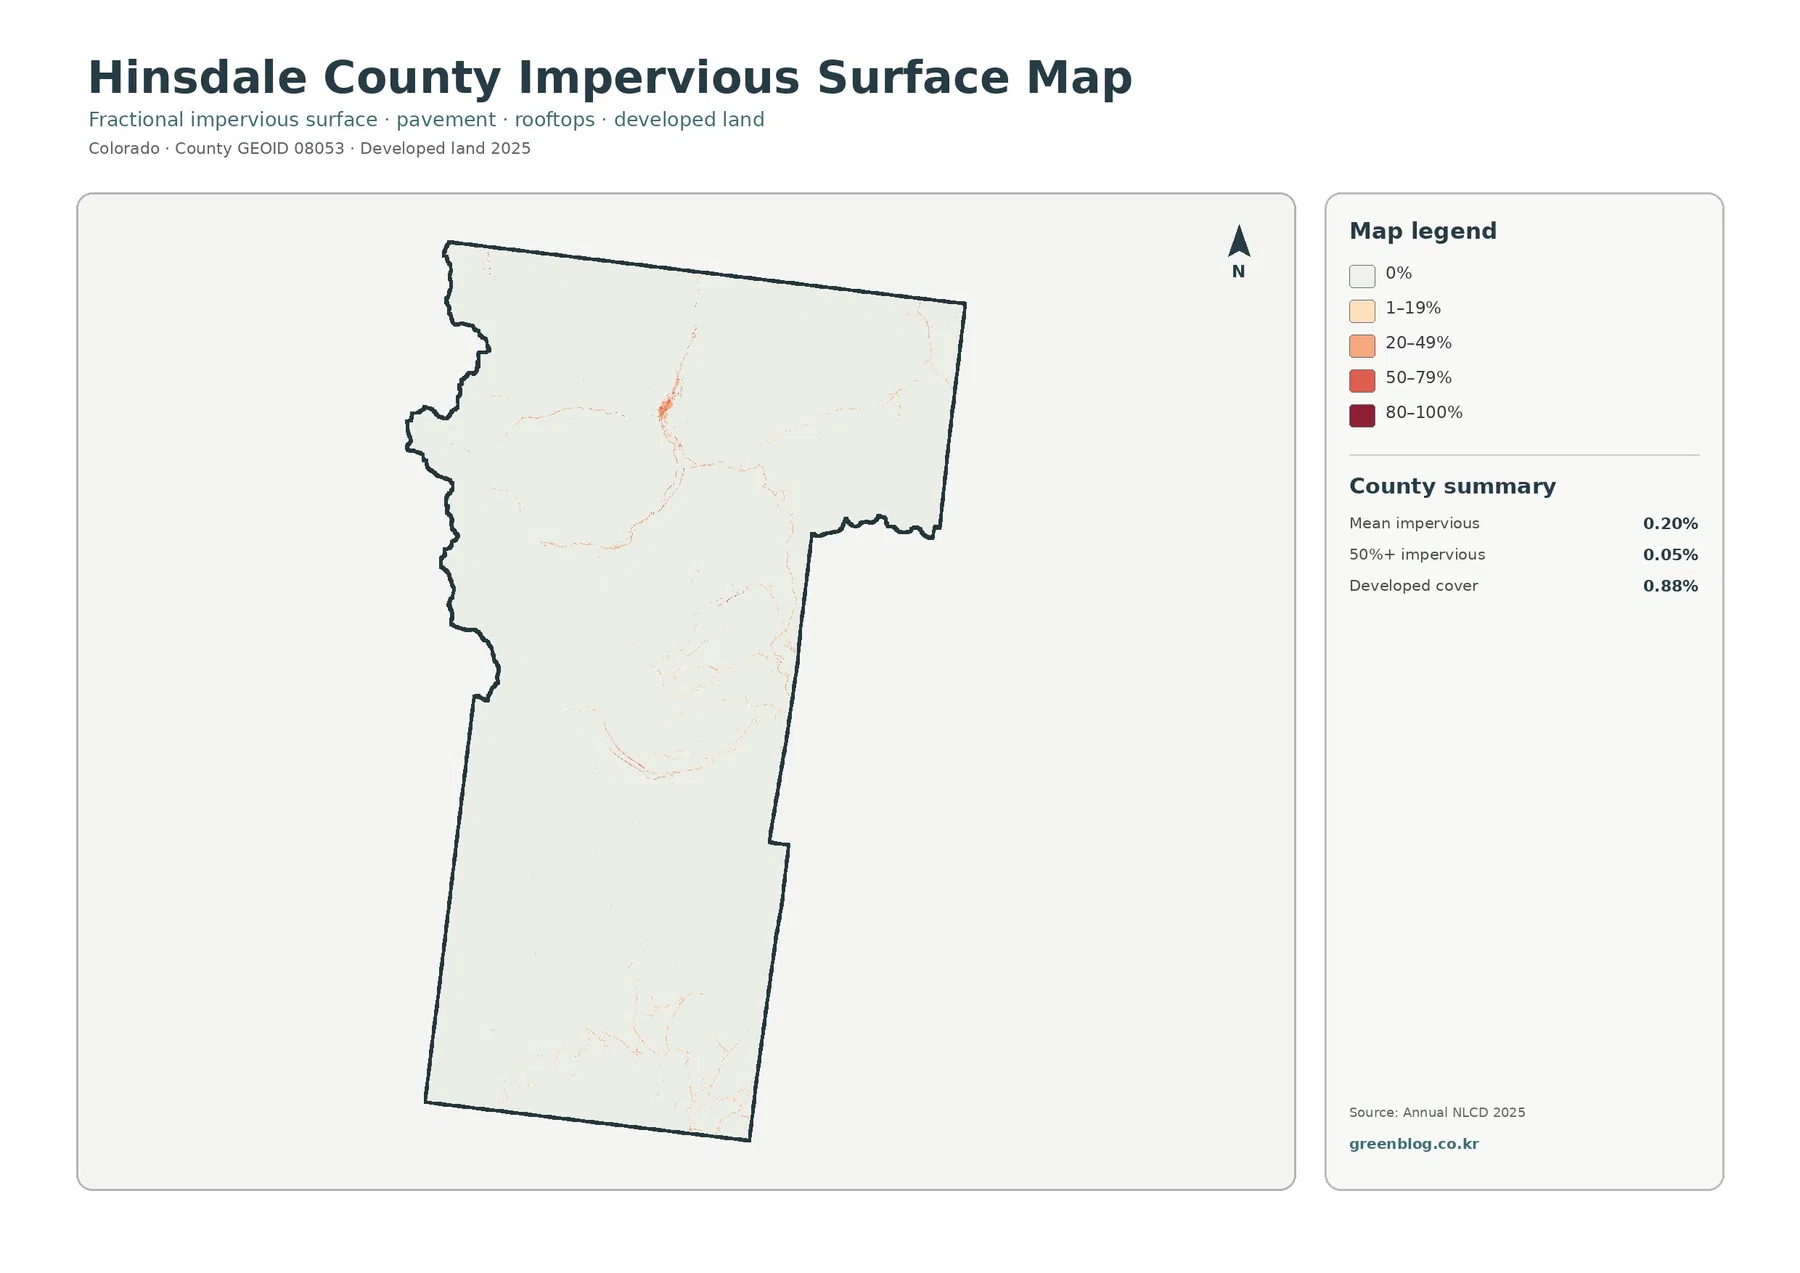
Impervious surface means pavement, rooftops, parking areas, and other hard materials that limit how quickly water can soak into the ground. Mean imperviousness is only 0.20% in Hinsdale County, and cells mapped at 50% or greater imperviousness cover just 0.05%.
Most of the map is almost white. A small cluster in the north-central part of the county contains the clearest orange and red values. Hinsdale County and the Town of Lake City both identify Lake City as the county seat, and the town is the county’s only incorporated municipality, making it a useful reference point for the main built concentration.
Thin impervious traces extend away from that settlement area along road-like routes. Other tiny developed spots appear farther south and west, but they remain minor compared with the surrounding forest and open land. The map visually reinforces how little hard-surface coverage exists countywide.
Developed land cover is 0.88%, while mean imperviousness is 0.20%. Those values differ because land cover assigns a categorical developed class, whereas the impervious product estimates how much of each cell is physically covered by hard material. A mountain settlement can include buildings and roads while still retaining large amounts of vegetation and soil.
Forest loss is the largest named category in the 1985–2025 comparison
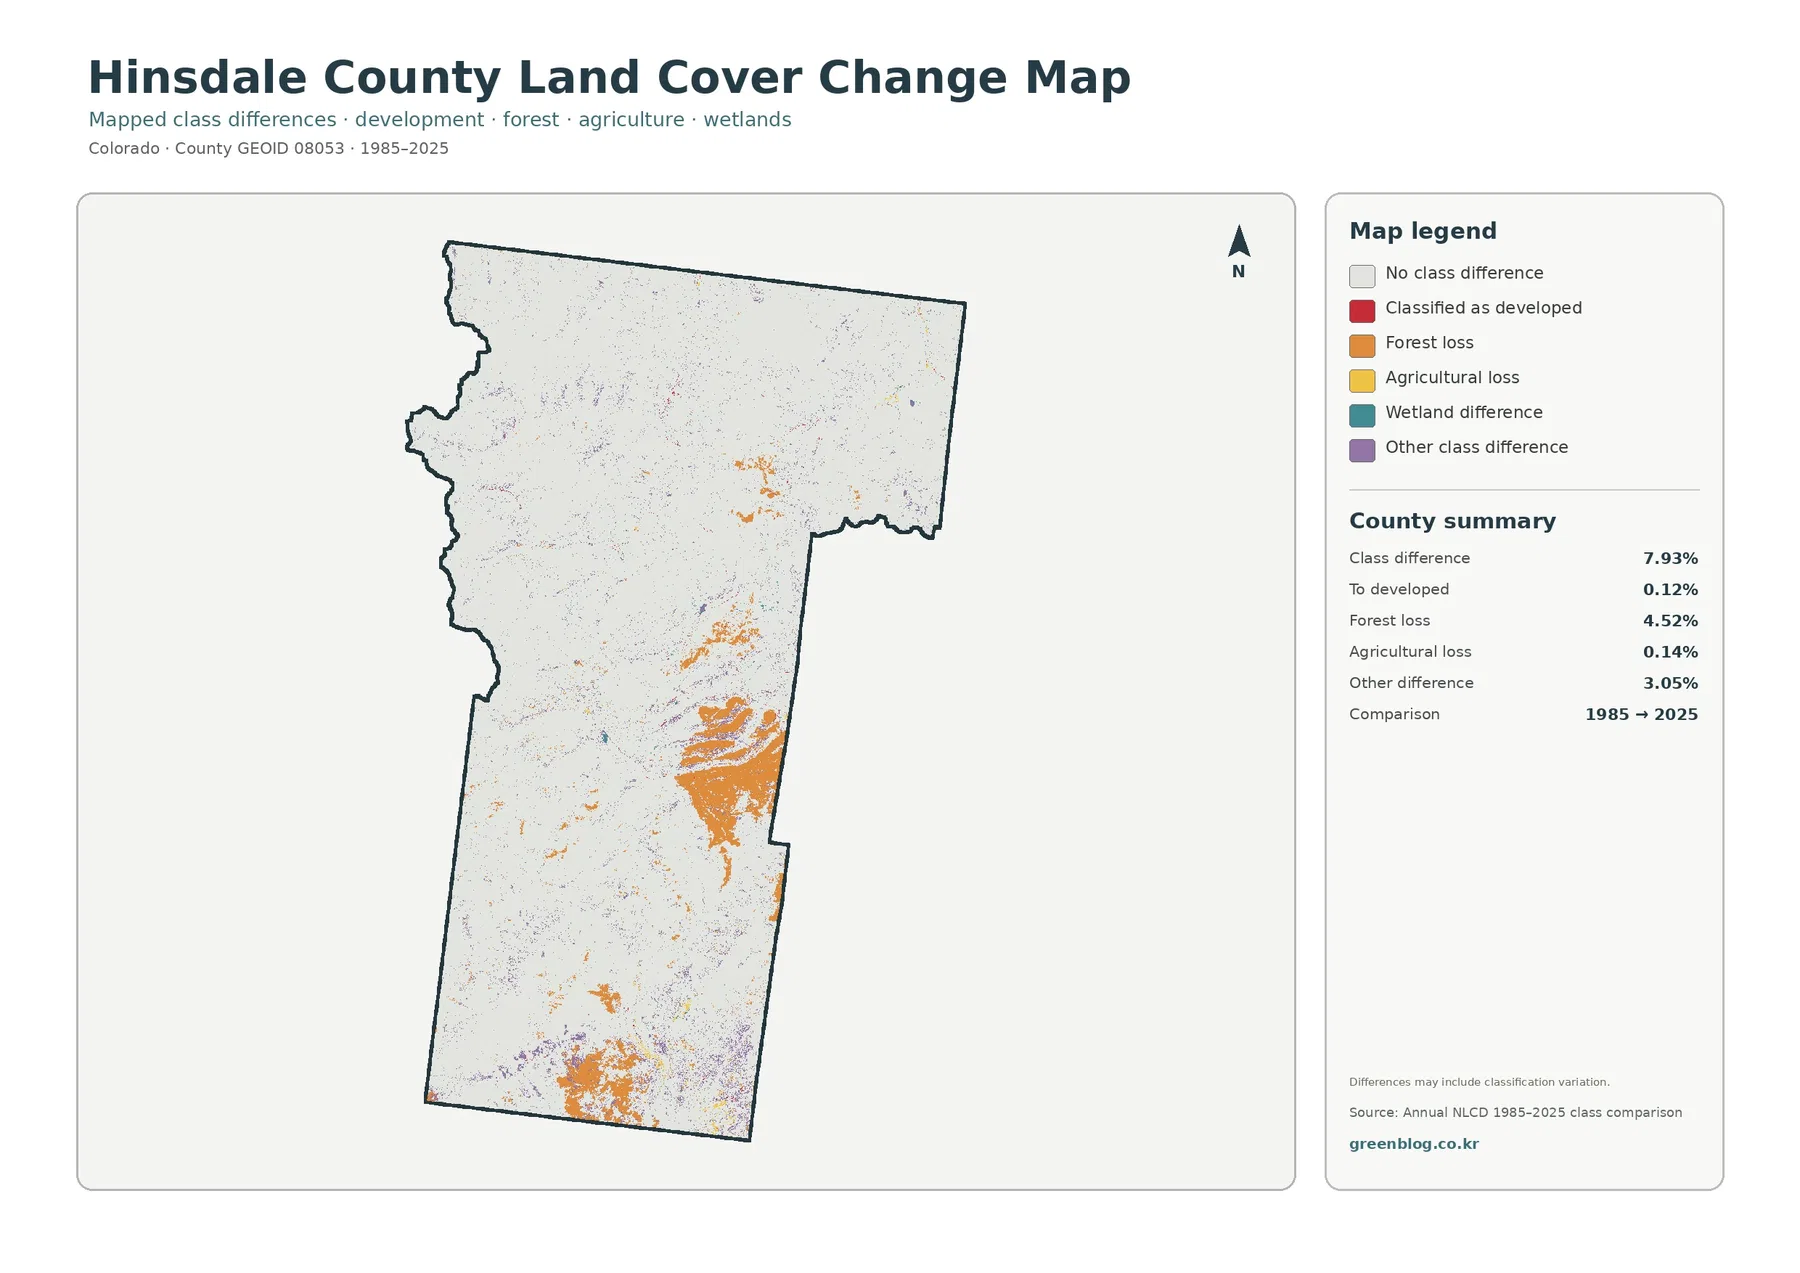
Mapped classes differ across 7.93% of Hinsdale County between 1985 and 2025. Forest loss accounts for 4.52%, other class difference for 3.05%, agricultural loss for 0.14%, and conversion to developed for 0.12%. Most of the county remains in the no-class-difference background.
Orange forest-loss areas are especially prominent in the south-central county and near the southern end. Smaller orange patches occur farther north and east. Their distribution is much more important on this change map than the very small development-conversion category.
The 4.52% forest-loss value does not identify a cause. Hinsdale County’s 2025 Community Wildfire Protection Plan provides extensive wildfire and forest context, but the NLCD change map itself cannot distinguish fire from other vegetation disturbance, development, recovery, or classification variability.
Red conversion-to-developed pixels are sparse and appear mainly around existing settlement or road areas. Current developed cover is 0.88%, while conversion to developed is 0.12%. The first describes 2025 cover; the second describes a specific two-date class change.
Frequently Asked Questions
Why does Lake San Cristobal stand out if water covers only 0.50% of Hinsdale County?
Water is concentrated rather than evenly distributed. A relatively large lake in one compact area is visually prominent against forest and shrubland even when the countywide water percentage is small.
Why is developed cover 0.88% while mean imperviousness is only 0.20%?
Developed cover is a categorical land-cover class, while imperviousness estimates the fraction of pavement, rooftops, and other hard surfaces within each cell. Developed mountain areas can still contain substantial forest, grass, and exposed soil.
Does 4.52% forest loss mean that amount of forest was definitely destroyed?
No. The 4.52% figure is the share of cells placed in the forest-loss category in the 1985–2025 comparison. Real change may be included, but the map does not identify the cause and classification variability may also contribute.
Thirty-meter cells are useful for county patterns, not parcel boundaries
Annual NLCD is raster data produced with 30-meter cells. A cell can contain trees, grass, shrubs, water, soil, pavement, or buildings at the same time, yet the land-cover product assigns a representative class. Fractional imperviousness estimates the share of hard surface separately.
That scale matters in a roadless mountain county with narrow valleys and small settlements. Water at 0.50%, developed cover at 0.88%, and highly impervious cells at 0.05% can be visually strong when concentrated but nearly disappear when they occur as thin lines.
The 7.93% class-difference value also should not be added to or subtracted from current cover percentages. Forest loss at 4.52% is a change category, not an earlier forest total, and other difference at 3.05% does not represent one single physical process.
Current land-cover and impervious maps represent 2025. Wildfire, forest recovery, new roads, building activity, or other changes after that year may not appear. More recent county or agency information is necessary for current site decisions.
Choose the map according to the feature you need to explain
Start with the general land-cover map for a complete county overview. It brings together the dominant forest, western high-country openings, Lake San Cristobal, wetlands, agriculture, and the small Lake City development pattern in one legend.
The forest-and-farmland version is better when the main question is forest versus open natural cover. Because agriculture is only 0.43%, its strongest use in Hinsdale County is simplifying the forest–shrub–grass transition rather than locating extensive farming.
Use imperviousness for hard-surface concentration around settlements and roads. Choose the change map for questions involving 1985–2025 differences, especially the south-central forest-loss patches. Pairing a specialized map with current land cover reduces the risk of mixing unlike statistics.
For classroom or presentation use, Lake City, Lake San Cristobal, and the southern mountains form a practical three-part comparison. Together they show settlement, water and wetlands, forest, high-country openings, and long-term class change inside one exceptionally mountainous county.
Download the four Hinsdale County JPG maps
The downloadable ZIP contains four original JPG files: general land cover, forest and farmland, impervious/developed land, and 1985–2025 land-cover change. The WebP images in the article are optimized for quick online viewing, while the JPG files can be opened separately for closer inspection and printing.
Keep each map’s title, year, and legend when reusing it. Current forest and forest loss, current development and conversion to developed, and developed cover and imperviousness are related but different measurements.
Map File Information
The download ZIP contains four original Hinsdale County land-cover JPG maps.
- Included Files: Use only the versions confirmed in the article and supplied images
- File Type: Use the confirmed download contents
- Intended Use: Printing, education, presentations, and map-based projects
Related Maps
- Adams County Colorado Land Cover Map
- Alamosa County Colorado Land Cover Map
- Arapahoe County Colorado Land Cover Map
Sources and References
- MRLC Annual NLCD Data – official access point for Annual NLCD products and data.
- USGS Annual NLCD Land Cover Classification – official documentation for interpreting Annual NLCD classes and 30-meter raster data.
- Hinsdale County official website – county information about Lake City, Lake San Cristobal, public lands, mountains, and the Continental Divide.
- 2025 Hinsdale County Community Wildfire Protection Plan – local information about elevation, forests, wilderness, waterways, and wildfire context.
- Town of Lake City – official town information identifying Lake City as the county seat and only incorporated municipality in Hinsdale County.
Green Map creates custom-edited map images using open geographic data sources such as geoBoundaries, Natural Earth, OpenStreetMap, and government open data.
These maps are edited visual materials, not raw data files, and are provided for education, documents, presentations, and graphic reference.