Saratoga County has one of the clearest west-to-east land-cover contrasts in this New York map series. Forest covers 50.88% of the county in the 2025 summary and forms broad, continuous areas across the west and northwest. Farther east, agriculture, wetlands, and developed land become much more prominent, while large water bodies such as Great Sacandaga Lake and Saratoga Lake break up the pattern. The four maps on this page separate those features so the county can be read as a landscape rather than as a single percentage.
The original JPG versions of all four maps are available together in one download. Use the general land-cover map for the overall pattern, the forest-and-farmland view for natural and agricultural cover, the impervious-surface map for pavement and rooftops, and the 1985–2025 change map for cells whose classification differs between the two dates. Land cover describes what is physically covering the surface; it does not establish zoning, ownership, parcel boundaries, development rights, or regulatory wetland limits.
Table of Contents
A county split between large forest blocks and a busier east
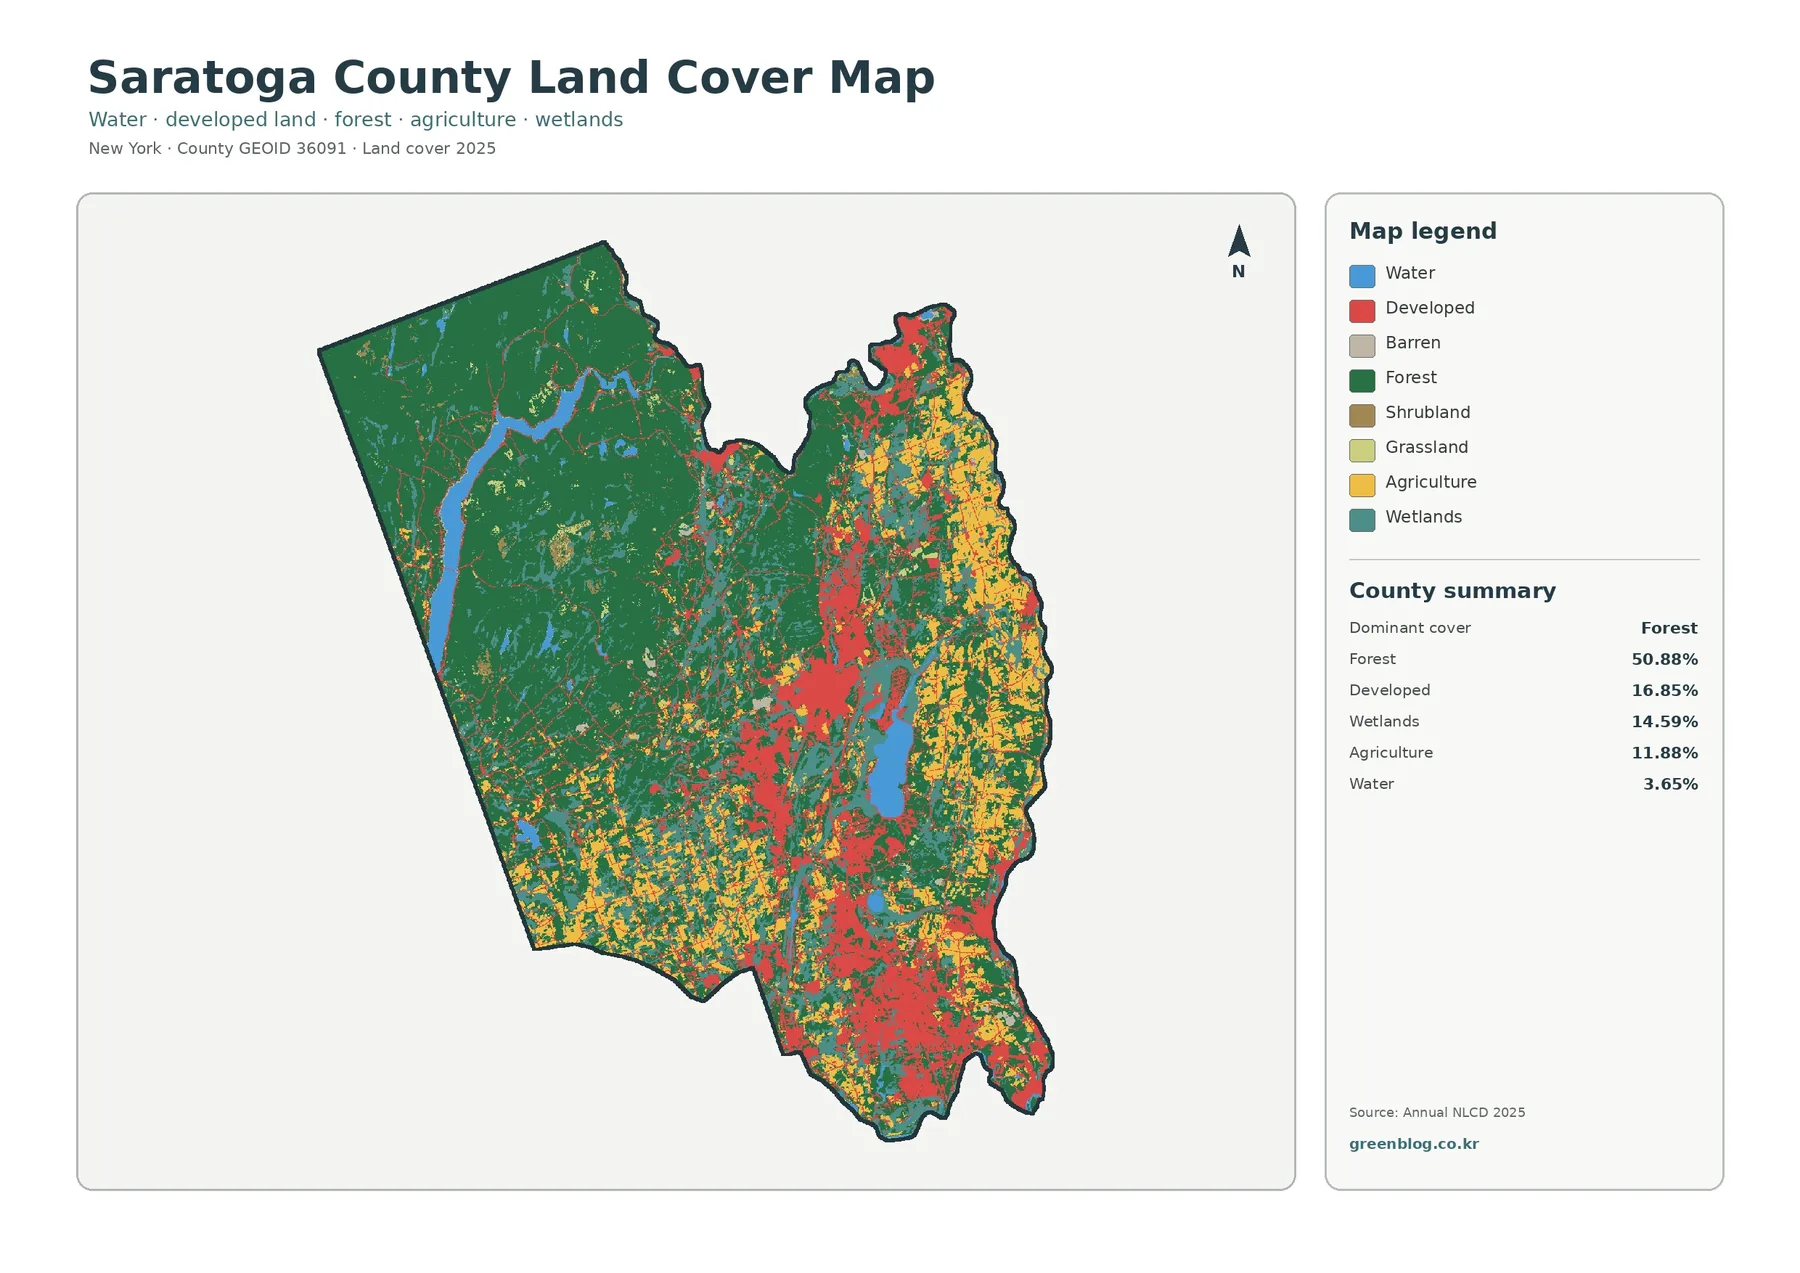
Green dominates the western half of the county, but the same color becomes more fragmented toward the center and east. That visual difference matters as much as the countywide total. A 50.88% forest share does not mean every town is half wooded. Instead, the map places much of the continuous forest in the west and northwest, while eastern and southern areas contain a finer mix of farms, wetlands, developed surfaces, and smaller wooded patches. Reading the pattern this way avoids turning one summary number into a description of every local landscape.
Developed cover accounts for 16.85% of the 2025 summary. The strongest concentrations form around the central and southern part of the county, including the Saratoga Springs area and the sequence of communities extending south toward Malta, Round Lake, Clifton Park, and Halfmoon. A separate developed concentration appears in the northeast around Moreau and the South Glens Falls side of the county. The map does not draw municipal boundaries or label every road, so those place names are geographic reference points rather than a claim that each colored cell belongs to a particular municipality.
Agriculture covers 11.88% and is especially visible across the east and northeast. Large yellow fields appear in a much more continuous pattern there than in the heavily forested west, with additional agricultural pockets scattered through central and southern areas. Saratoga County’s Planning and Economic Development Department lists two consolidated agricultural districts that include towns across the eastern, central, and southern county. Those district boundaries are not the same thing as the yellow land-cover cells, but the program confirms that farming remains an important part of the county’s working landscape.
Wetlands make up 14.59%, a larger share than agriculture. Teal areas occur around lakes and drainage corridors, but they also appear among forests and farm country rather than forming one isolated wetland zone. This is an important part of the Saratoga pattern because a quick glance at only forest and development would miss a substantial portion of the county. The Annual NLCD wetland class is a generalized surface classification, however, and should not be substituted for an official regulatory wetland delineation.
Water covers 3.65% in the summary, yet it has a strong visual presence because several large water bodies occupy distinctive positions. Great Sacandaga Lake stands out on the western side, Saratoga Lake is prominent closer to the central-southeastern portion, and river corridors define other county edges. Saratoga County’s hazard-mitigation planning material identifies the Hudson, Mohawk, and Sacandaga rivers along with Great Sacandaga Lake and Saratoga Lake as important parts of the county’s hydrology. The land-cover map does not describe flow, water quality, or shoreline ownership, but it does show where water interrupts or borders other surface types.
This general map is therefore the best starting point for orientation. It establishes the large western forest, the more agricultural east, the central-southern development concentrations, and the county’s major water pattern before the more specialized maps remove or de-emphasize some classes. Once those reference areas are familiar, the forest, impervious, and change maps become easier to compare without losing track of location.
Wetlands, lakes, and farm country shape the eastern half
The eastern side of Saratoga County is not simply the opposite of the forested west. Agriculture and wetlands share the landscape with developed places, smaller forests, and water. That mix can be seen especially well around the eastern and southeastern parts of the county, where yellow agricultural cells and teal wetland cells occur close to red developed cover. The result is a patchwork rather than a single broad land-cover block, which makes scale and context important when interpreting any one color.
Saratoga County has an active Farmland and Open Space Program that dates to 2003. The county planning department states that the program has preserved several thousand acres of farmland and open space, and its agricultural-district program includes towns such as Moreau, Northumberland, Saratoga, Stillwater, Wilton, Ballston, Charlton, Galway, Malta, Milton, and others. These official programs help explain why farm and open-space questions remain locally significant. They do not prove that any specific mapped agricultural cell is protected land, because land-cover classification and legal preservation status are separate datasets.
Water also helps organize the eastern and southern landscape. Saratoga Lake sits near developed and wetland areas rather than inside one large forest block, while Round Lake and the Mohawk River are among the water bodies listed by New York State DEC for public boating access in Saratoga County. Along the east, the Hudson River forms a long regional boundary. These waterways create useful reference points when comparing the maps, but their presence should not be used to infer flood risk or water quality without hydrologic and engineering data designed for those questions.
The wetland share deserves special attention when preparing a classroom or environmental presentation. At 14.59%, wetlands are not a marginal class in the county summary. Their scattered placement beside farms, woods, lakes, and developed surfaces also gives students a good example of why land cover changes over short distances. A zoomed-in view can be used to ask where wetland cells meet other classes, but a 30-meter raster should not be treated as a precise boundary for a small marsh, stream edge, or parcel.
Forest and farmland look very different when development is muted
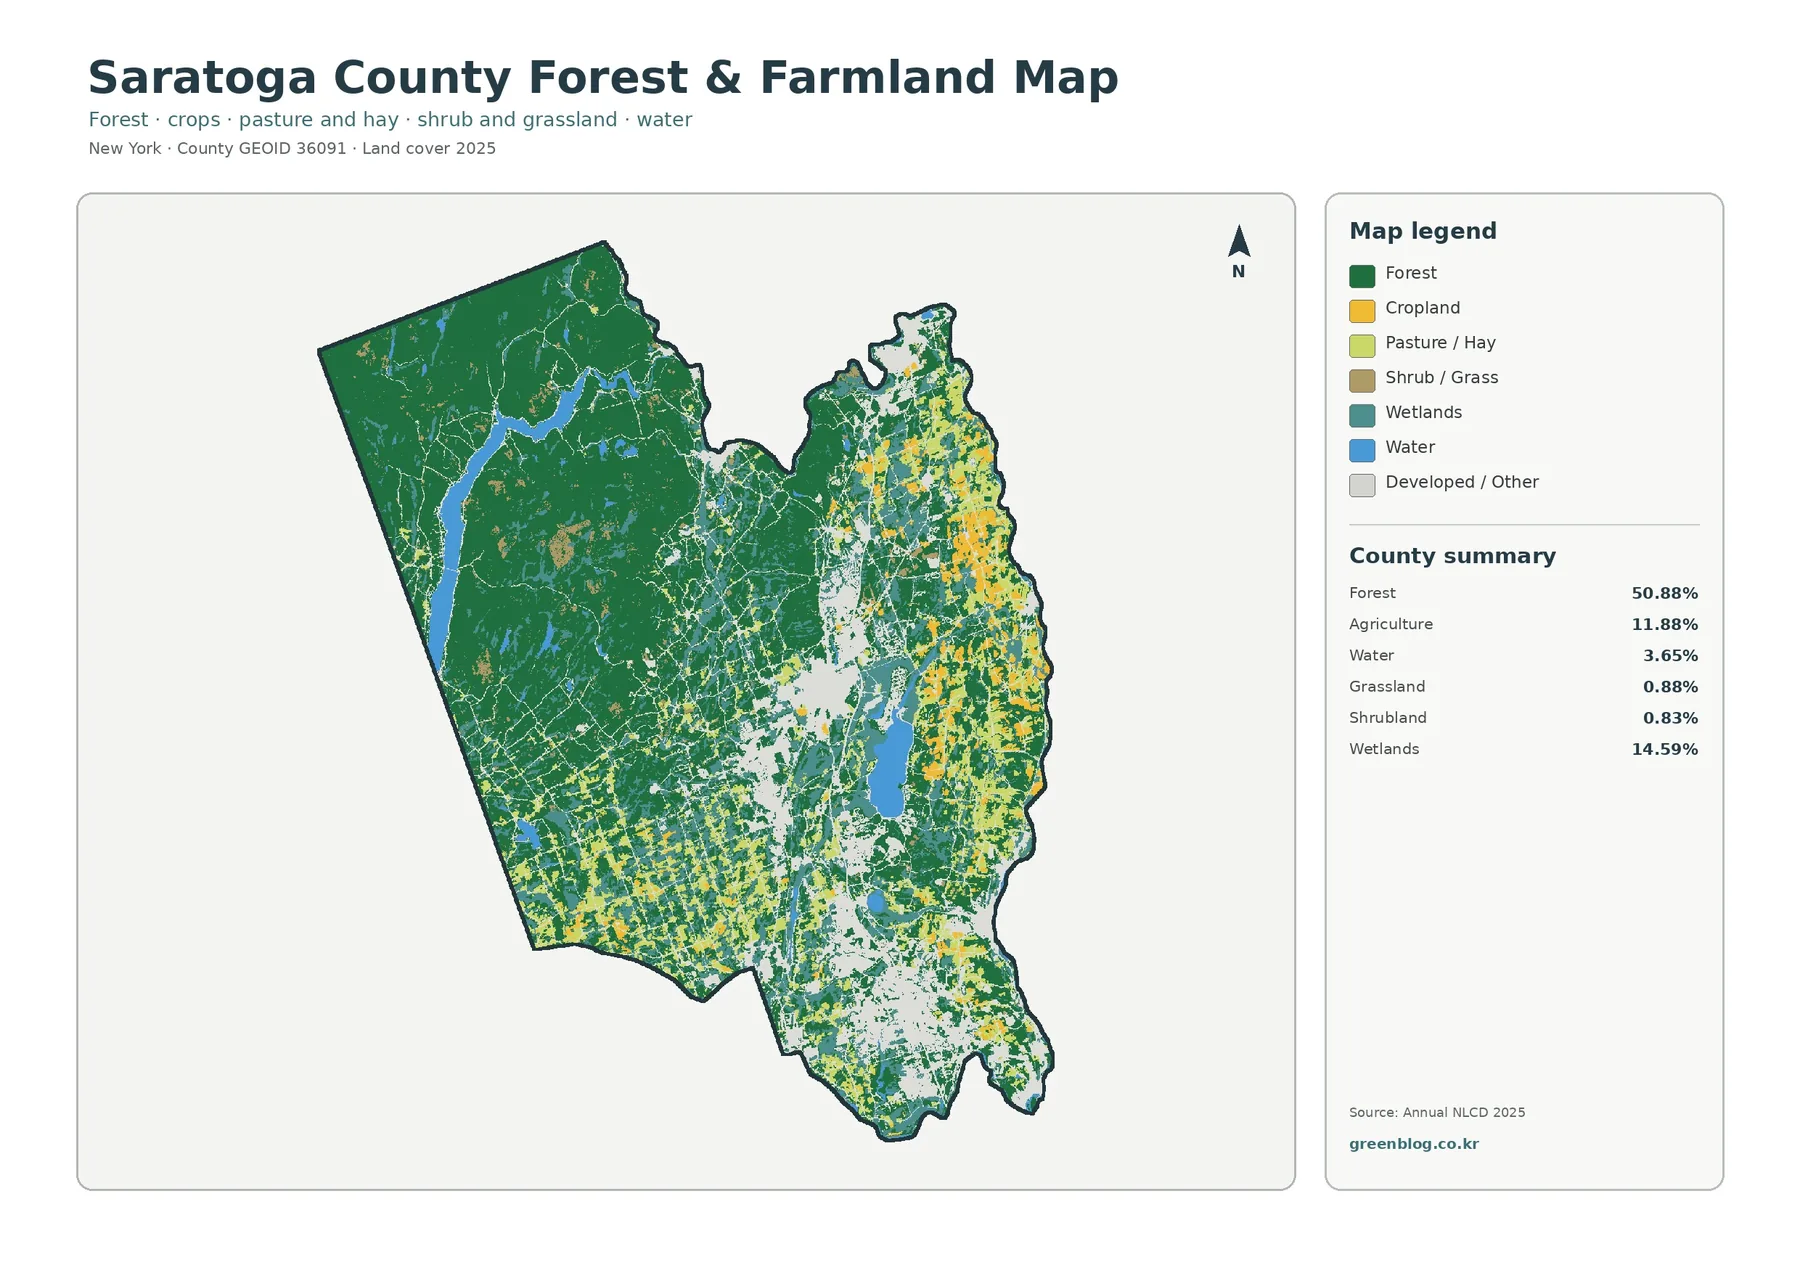
Removing the strong developed-land colors makes the western forest block even more obvious. Forest remains at 50.88%, but its form changes sharply across the county. West of the main developed corridor, broad green areas remain connected over long distances. Moving east, forest breaks into smaller patches among farms, wetlands, roads, and settlements. That contrast is useful for habitat or open-space discussions because two places with forest present can have very different patch size and continuity.
New York State DEC’s Wilcox Lake Wild Forest provides useful regional context for the western pattern. DEC describes the unit as roughly 125,000 acres of Adirondack Forest Preserve spread across several counties, including the Saratoga County towns of Corinth, Day, Edinburg, Greenfield, Hadley, and Providence. The land-cover map does not display the preserve boundary, so not every green cell in western Saratoga County belongs to this unit. Still, the official description supports the broader point that the western county is connected to an extensive Adirondack forest landscape.
Agriculture is much more concentrated toward the east. At 11.88% countywide, it is far smaller than forest, yet its yellow areas form a conspicuous band of fields and open agricultural land in the eastern half. Smaller agricultural patches also appear elsewhere, including portions of the south and center. This distribution is more informative than the percentage alone because it shows that farmland is not evenly scattered through the forested west.
Grassland accounts for 0.88% and shrubland for 0.83%. Those are small totals, but they appear as minor transition areas and open patches rather than disappearing from the map. Small categories are especially sensitive to raster generalization: a 30-meter cell may contain grass, trees, pavement, or field edges at the same time. For broad county comparison these classes are still useful, but individual patches should be checked against higher-resolution imagery if the exact local surface matters.
The same map also keeps wetlands and water visible, which prevents the natural landscape from being reduced to forest versus farmland. Great Sacandaga Lake interrupts the western forest, while smaller water and wetland features are embedded throughout the county. In the east, wetland cells often appear close to agricultural and developed areas. For an educational map, this view is especially useful because it places farms, forest, wetlands, and water in one frame without letting the developed class dominate the page.
Impervious surface narrows the developed pattern to roads, rooftops, and centers
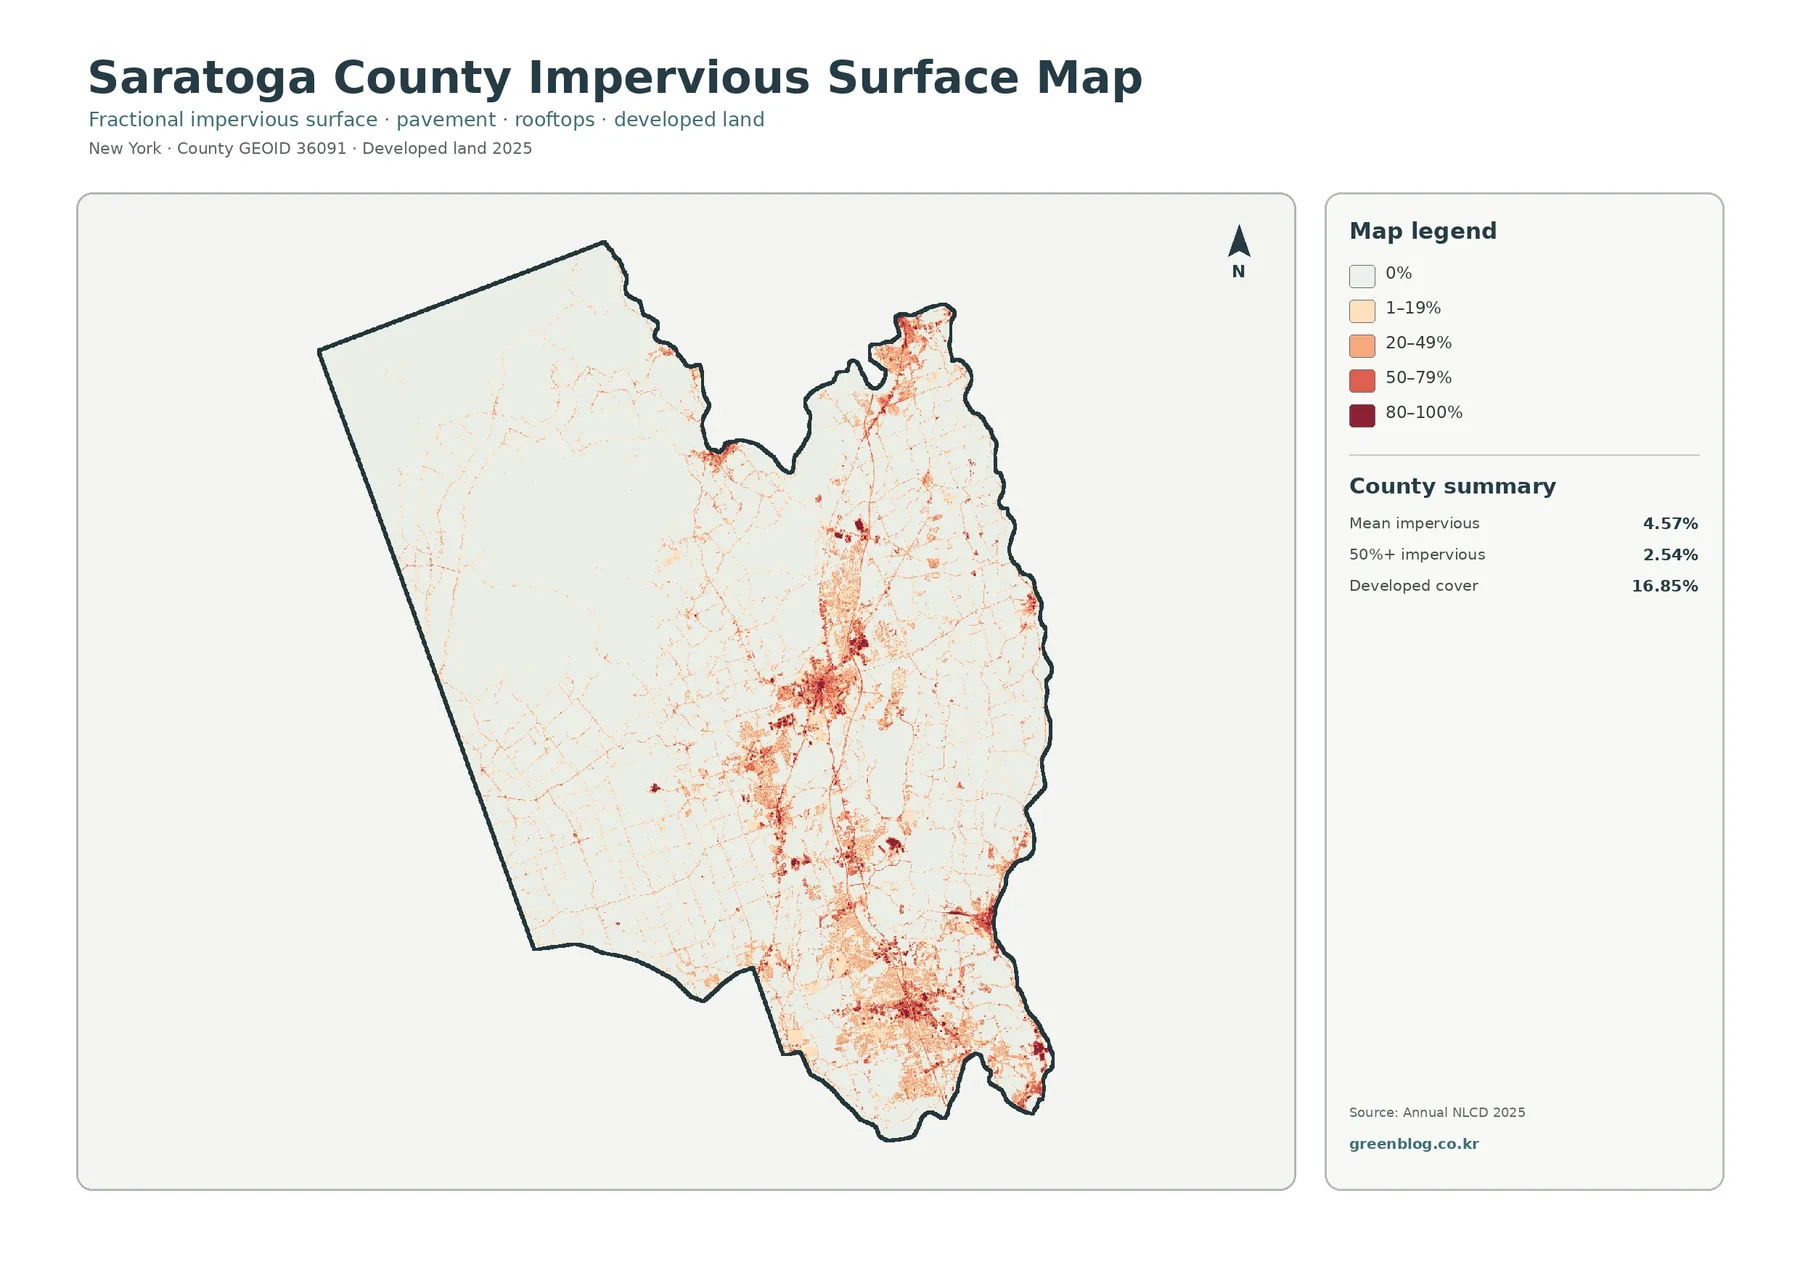
Impervious surface is a different measure from developed land. It refers to surfaces such as pavement, parking areas, and rooftops that do not readily allow water to soak into the ground. Saratoga County’s mean impervious value is 4.57%, and 2.54% of the mapped area falls in cells with at least 50% impervious cover. Those figures are much smaller than the 16.85% developed-cover share because a developed cell can still contain lawns, trees, soil, and other permeable surfaces.
The darkest tones concentrate around Saratoga Springs and continue south through the central-southern developed corridor. Stronger patches also appear in the southeast around Clifton Park and Halfmoon, while a smaller northeastern concentration is visible near Moreau. Thin colored lines connect many of these areas, reflecting paved transportation surfaces and built-up corridors. The pattern does not identify road names by itself, but it clearly distinguishes dense paved centers from surrounding lower-density developed land.
Western Saratoga County looks almost blank by comparison. Most of the broad forest region remains in the zero or very-low impervious classes, with narrow road traces and small developed pockets standing out against a pale background. That makes the map effective for explaining how a county can contain both large wild or rural areas and compact concentrations of hard surface. It also shows why the general developed class should not be interpreted as a direct measure of pavement.
Impervious maps are often used as an entry point for discussions about runoff, but the color alone does not measure flood hazard, water quality, or heat exposure. Rainfall, soil, slope, drainage infrastructure, stream capacity, vegetation, and building form all matter. A dark area on this map means a greater share of hard surface within the raster cell. Any claim about flooding or environmental risk needs additional datasets designed for that purpose.
For planning or presentation work, the strongest comparison is often the general land-cover map beside the impervious map. The first identifies where development is one of the dominant surface classes; the second shows how intensely the surface is paved or roofed within those developed areas. This side-by-side approach can reveal green or low-impervious spaces inside broader developed zones without implying anything about zoning or future development rights.
The 1985–2025 map is a screening tool for change, not a cause map
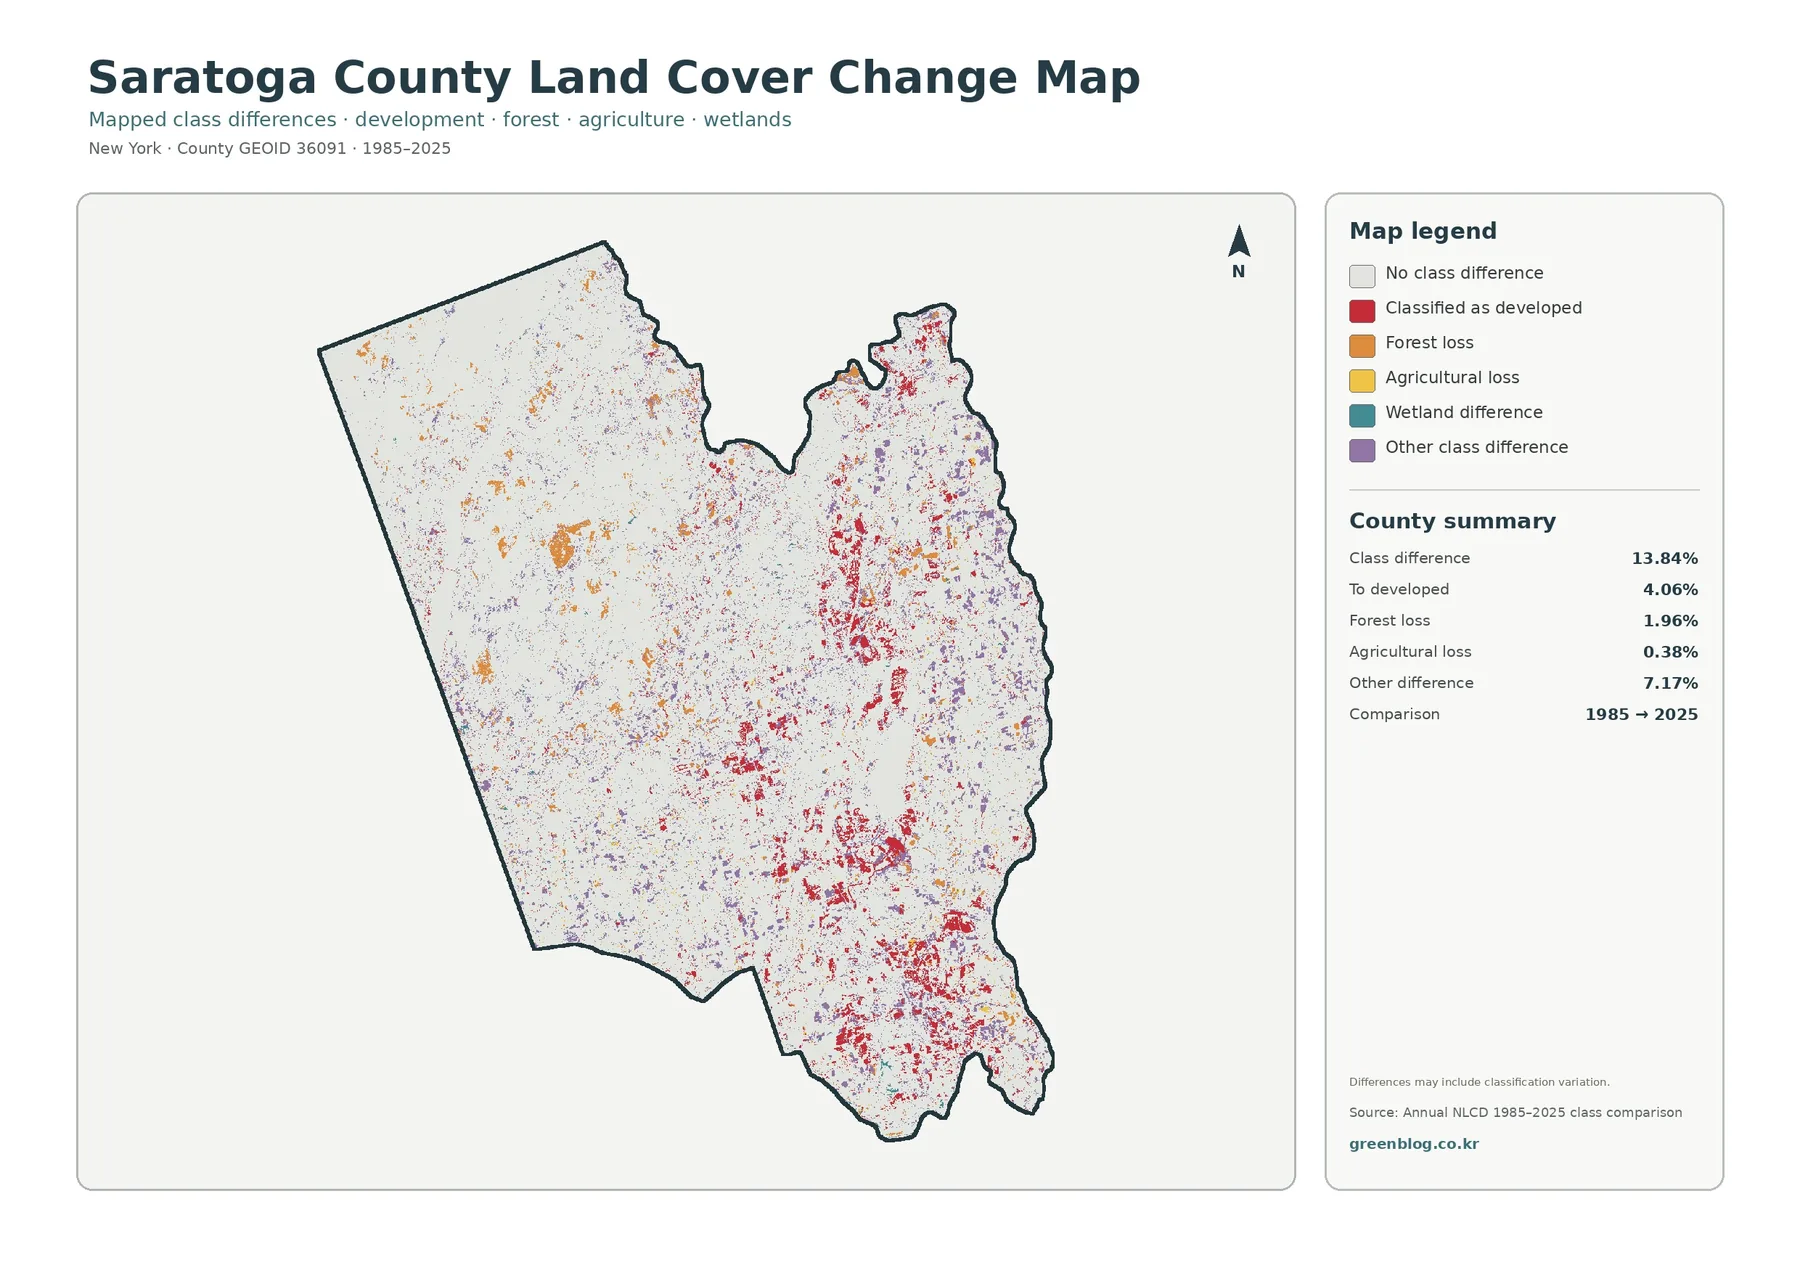
The change layer compares classifications for 1985 and 2025. The county summary reports a class difference for 13.84% of the mapped area. Within the displayed change categories, 4.06% is classified as change to developed, 1.96% as forest loss, 0.38% as agricultural loss, and 7.17% as other class difference. These values describe differences between two mapped classifications; they should not be presented as a complete accounting of legal land-use conversion over forty years.
Red change-to-developed cells cluster along much of the same central and southern zone that contains the county’s strongest current impervious pattern. Additional red areas occur in the northeast and in smaller scattered pockets. The overlap is useful for finding places to investigate, but it does not establish why development occurred. A road, subdivision, commercial project, or other cause would need to be confirmed with dated aerial imagery, local records, or planning documents.
Orange forest-loss cells appear in more dispersed patches, including parts of the western forest and edges of wooded areas nearer developed and agricultural land. Because the forest-loss total is 1.96%, the map should be read at both scales: broad areas where many changed cells occur together and isolated pixels where classification may be sensitive to edges or mixed cover. A few scattered cells should not be described as a large clearing without checking higher-resolution evidence.
Agricultural loss is listed at 0.38% and is less visually dominant. Some changed cells occur within or near eastern farm country, but the raster layer cannot identify whether a particular farm changed ownership, left an agricultural district, or was formally converted to another legal use. Saratoga County’s agricultural-preservation programs are useful background for local research, yet their boundaries and dates must be compared directly before drawing policy conclusions.
The 7.17% other-difference category is the largest of the listed change groups. Purple and other non-red cells are scattered widely, reminding the reader that change between classifications is not synonymous with urbanization. Wetland, water, forest, grass, shrub, and agricultural boundaries can shift between mapped classes, and some variation may arise from imagery or classification methods. That is why the change map works best as a screening layer that tells you where to look next.
A practical workflow is to begin with the 2025 land-cover map, identify the current surface at a location of interest, and then check whether the change map marks that same place. If it does, historical imagery or local records can be added to determine what actually happened. This order keeps current condition, mapped change, and documented cause as three separate questions instead of collapsing them into one assumption.
Using Great Sacandaga Lake and Saratoga Lake as map reference points
Large water bodies make excellent orientation features because their shapes remain recognizable across the different map themes. Great Sacandaga Lake provides an anchor for the western forest landscape. DEC’s Wilcox Lake Wild Forest page notes that the Saratoga County Boat Launch gives access to the northeastern part of Great Sacandaga Lake, while the same page places several Saratoga County towns within the surrounding forest unit. These references help connect the mapped blue water and green forest to a real regional setting without turning the land-cover layer into a recreation or property map.
Saratoga Lake serves a different role in the county. It lies close to developed areas, wetlands, smaller forest patches, and agricultural land, so the surrounding colors change rapidly over short distances. New York State Parks maintains the Saratoga Lake State Boat Launch, and DEC’s county boat-launch list also includes Round Lake, Moreau Lake, and Mohawk River access points. Those official references confirm the variety of water environments present in the county, although the land-cover map itself says nothing about access rules or water conditions.
The Hudson and Mohawk rivers provide additional geographic context along the county’s eastern and southern sides. Saratoga County’s hazard-mitigation plan describes the Hudson as following the eastern border for a long distance and the Mohawk along the south, with the Sacandaga system draining part of the interior. When a map reader sees wetlands and developed land close to these water corridors, it is reasonable to describe the spatial proximity. It is not reasonable to infer flood cause, water quality, or regulatory status without the appropriate hydrologic datasets.
These named features are useful because they make the four thematic maps easier to compare. Instead of trying to memorize the county outline, a reader can use Great Sacandaga Lake in the west, Saratoga Lake near the center-southeast, and the Hudson side in the east as reference points. From there, forest continuity, farm patterns, impervious concentrations, and change cells can be compared at the same locations.
Choosing the right map for a classroom, report, or local comparison
For a quick county profile, start with the general 2025 land-cover map. It gives the most balanced summary of forest, development, wetlands, agriculture, and water. The 50.88% forest share is an important headline, but pairing it with the location of the forest prevents an overly simple description. Mentioning the eastern farms, substantial wetland share, and central-southern development produces a more accurate picture of Saratoga County.
For natural-resource or rural-landscape work, the forest-and-farmland map is the better choice. It makes the western forest block and eastern farm areas easy to distinguish, while still preserving water and wetland context. It can support lessons about habitat pattern, agricultural landscapes, open space, or the way multiple cover types meet around lakes and settled areas. Legal conservation status still requires official preserve, easement, or parcel information.
For built-surface questions, use the impervious map. Its strongest advantage is that it separates broad developed land from the actual concentration of hard surfaces. A student can compare Saratoga Springs or the southeastern corridor with the western forest and immediately see why “developed” and “mostly paved” are not interchangeable descriptions. This map is also useful in a presentation where the goal is to show relative built intensity rather than municipal land use.
Use the 1985–2025 layer only when the question involves change. It works best beside the current land-cover map, not by itself. A red cell becomes more meaningful after the reader knows whether the current surface is part of a developed center, a road corridor, or a small isolated patch. The same approach applies to forest-loss and agricultural-loss cells. Comparing maps first and researching causes second keeps the interpretation grounded.
The four-map set can also be used for county-to-county comparison across New York. Rather than comparing only percentages, look at where each class sits within the county, how continuous the forest is, whether agriculture forms broad blocks or small patches, how water shapes the outline, and whether impervious surfaces form a compact center or several separate corridors. Saratoga County is especially useful for this kind of exercise because the western forest and eastern mixed landscape are visually distinct.
Download the four Saratoga County JPG maps
The download ZIP contains four original JPG files: the 2025 general land-cover map, the forest-and-farmland map, the impervious-surface/developed-land map, and the 1985–2025 land-cover-change map. Each file includes its own legend and county summary so it can be opened and used independently. The set is suitable for printing, classroom worksheets, presentations, county comparisons, and reference graphics when a larger image is more useful than the web preview.
Choose the file according to the question you are trying to answer. Use the general map for the overall county, the forest-and-farmland map for natural and agricultural cover, the impervious map for hard-surface intensity, and the change map for locations where classifications differ between the two dates. Keeping all four files together makes it easier to compare the same part of Saratoga County under different map themes.
Scale, classification, and what the maps cannot tell you
Annual NLCD land cover is raster data, meaning the landscape is divided into a grid and each cell receives a representative class. At the roughly 30-meter scale used for this type of land-cover mapping, one cell can contain trees, lawn, pavement, rooftops, field edges, or water at the same time. The result is appropriate for countywide pattern analysis but not for surveying a parcel boundary or locating a very narrow feature with legal precision.
A mixed pixel is simply a grid cell containing more than one real-world surface. Mixed pixels are common along forest edges, shorelines, narrow wetlands, roads, and the boundary between fields and developed land. The classification must still assign or summarize that cell in a simplified way. This is why a small patch can look slightly larger, smaller, or more fragmented than it appears in high-resolution aerial photography.
Time is another limitation. The general and impervious maps use the 2025 data shown in the package, while the change layer compares 1985 with 2025. Construction, vegetation recovery, agricultural change, or wetland change after the observation year will not appear. The change map also does not describe every intermediate year, so it cannot tell the full sequence of events between the two endpoints.
The maps also have no legal land-use authority. Forest does not mean public park; agriculture does not mean an agricultural-district parcel; developed cover does not identify residential, commercial, or industrial zoning; and the wetland class does not replace a regulatory wetland map. Anyone making a decision about permits, ownership, zoning, conservation restrictions, or parcel boundaries should use the current official records from the relevant local or state agency.
Countywide percentages should be read as summaries rather than local measurements. A mean impervious value of 4.57% does not describe every neighborhood, just as 50.88% forest does not mean every town has the same forest share. Saratoga County contains strong internal contrasts, so the summary table and the spatial pattern should always be used together. The number tells how much is mapped; the map tells where it is mapped.
Frequently Asked Questions
What is the largest land-cover class in Saratoga County?
Forest is the largest class in the 2025 summary at 50.88%. It is most continuous in the western and northwestern parts of the county, while central and eastern areas contain a more mixed pattern of forest, agriculture, wetlands, and development.
Why do wetlands account for 14.59%?
Wetland cells are distributed through several parts of Saratoga County rather than one single zone. They appear around lakes and drainage areas, within or beside forests, and close to agricultural and developed land in the east. The percentage refers to the Annual NLCD classification and is not a legal wetland delineation.
Why is developed cover 16.85% while mean impervious cover is only 4.57%?
A developed land-cover cell can include lawns, trees, soil, and other permeable surfaces in addition to roads and buildings. The impervious layer measures the share of hard surface such as pavement and rooftops, so its countywide mean is expected to be lower than the total developed-land share.
Does the 13.84% change value mean that much land was developed?
No. The 13.84% figure is the share of cells whose classification differs between 1985 and 2025. Change to developed is listed separately at 4.06%, while forest loss, agricultural loss, and other class differences make up additional categories. Classification and imagery differences can also contribute, so site-specific causes need separate evidence.
Map File Information
The ZIP contains the four original Saratoga County JPG maps covering 2025 land cover, forest and farmland, impervious/developed surface, and 1985–2025 land-cover change.
- Included Files: general land cover, forest/farmland, impervious/developed land, and land-cover change maps
- File Type: ZIP containing four original JPG maps
- Intended Use: printing, classroom use, presentations, county comparison, and map-based reference work
Related Maps
- Albany County Land Cover Map
- Allegany County New York Land Cover Map
- Bronx County New York Land Cover Map
Sources and Reference Material
- MRLC Annual NLCD Data – official access to Annual NLCD land-cover and impervious-surface datasets
- USGS Annual NLCD Land Cover Classification – official descriptions of the land-cover classes used in Annual NLCD
- Saratoga County Planning and Economic Development – county information on agricultural districts, farmland and open-space preservation, and planning
- NYSDEC Wilcox Lake Wild Forest – official context for Adirondack Forest Preserve lands and Great Sacandaga Lake access in western Saratoga County
- NYSDEC Boat Launch Sites for Saratoga County – official listing of Saratoga Lake, Round Lake, Moreau Lake, Mohawk River, and other county water access sites
Green Map creates custom-edited map images using open geographic data sources such as geoBoundaries, Natural Earth, OpenStreetMap, and government open data.
These maps are edited visual materials, not raw data files, and are provided for education, documents, presentations, and graphic reference.