Bonner County is overwhelmingly forested on the supplied 2025 classification, but water is nearly as important to its visual identity. Forest accounts for 69.11% of the county, while open water covers 9.64% and shrubland 9.61%. Developed land is 4.00% and wetlands are 3.72%, with much smaller agricultural and grassland shares. The Bonner County Idaho Land Cover Map therefore shows a place where large lakes divide broad forest blocks and where settlement is concentrated around only a few corridors.
The page compares four supplied views: current land cover, forest and farmland, impervious surface with developed land, and the 1985–2025 endpoint difference layer. Each WebP appears next to the discussion, and the four original 2480 × 1754-pixel JPG files are packaged in one ZIP below. The most revealing comparisons follow the same locations around Lake Pend Oreille, the Priest Lake extension, the Sandpoint side of the main lake, and the westward corridor toward the county line.
Table of Contents
Lake Pend Oreille breaks a 69.11% forest landscape into distinct north, east, and west patterns
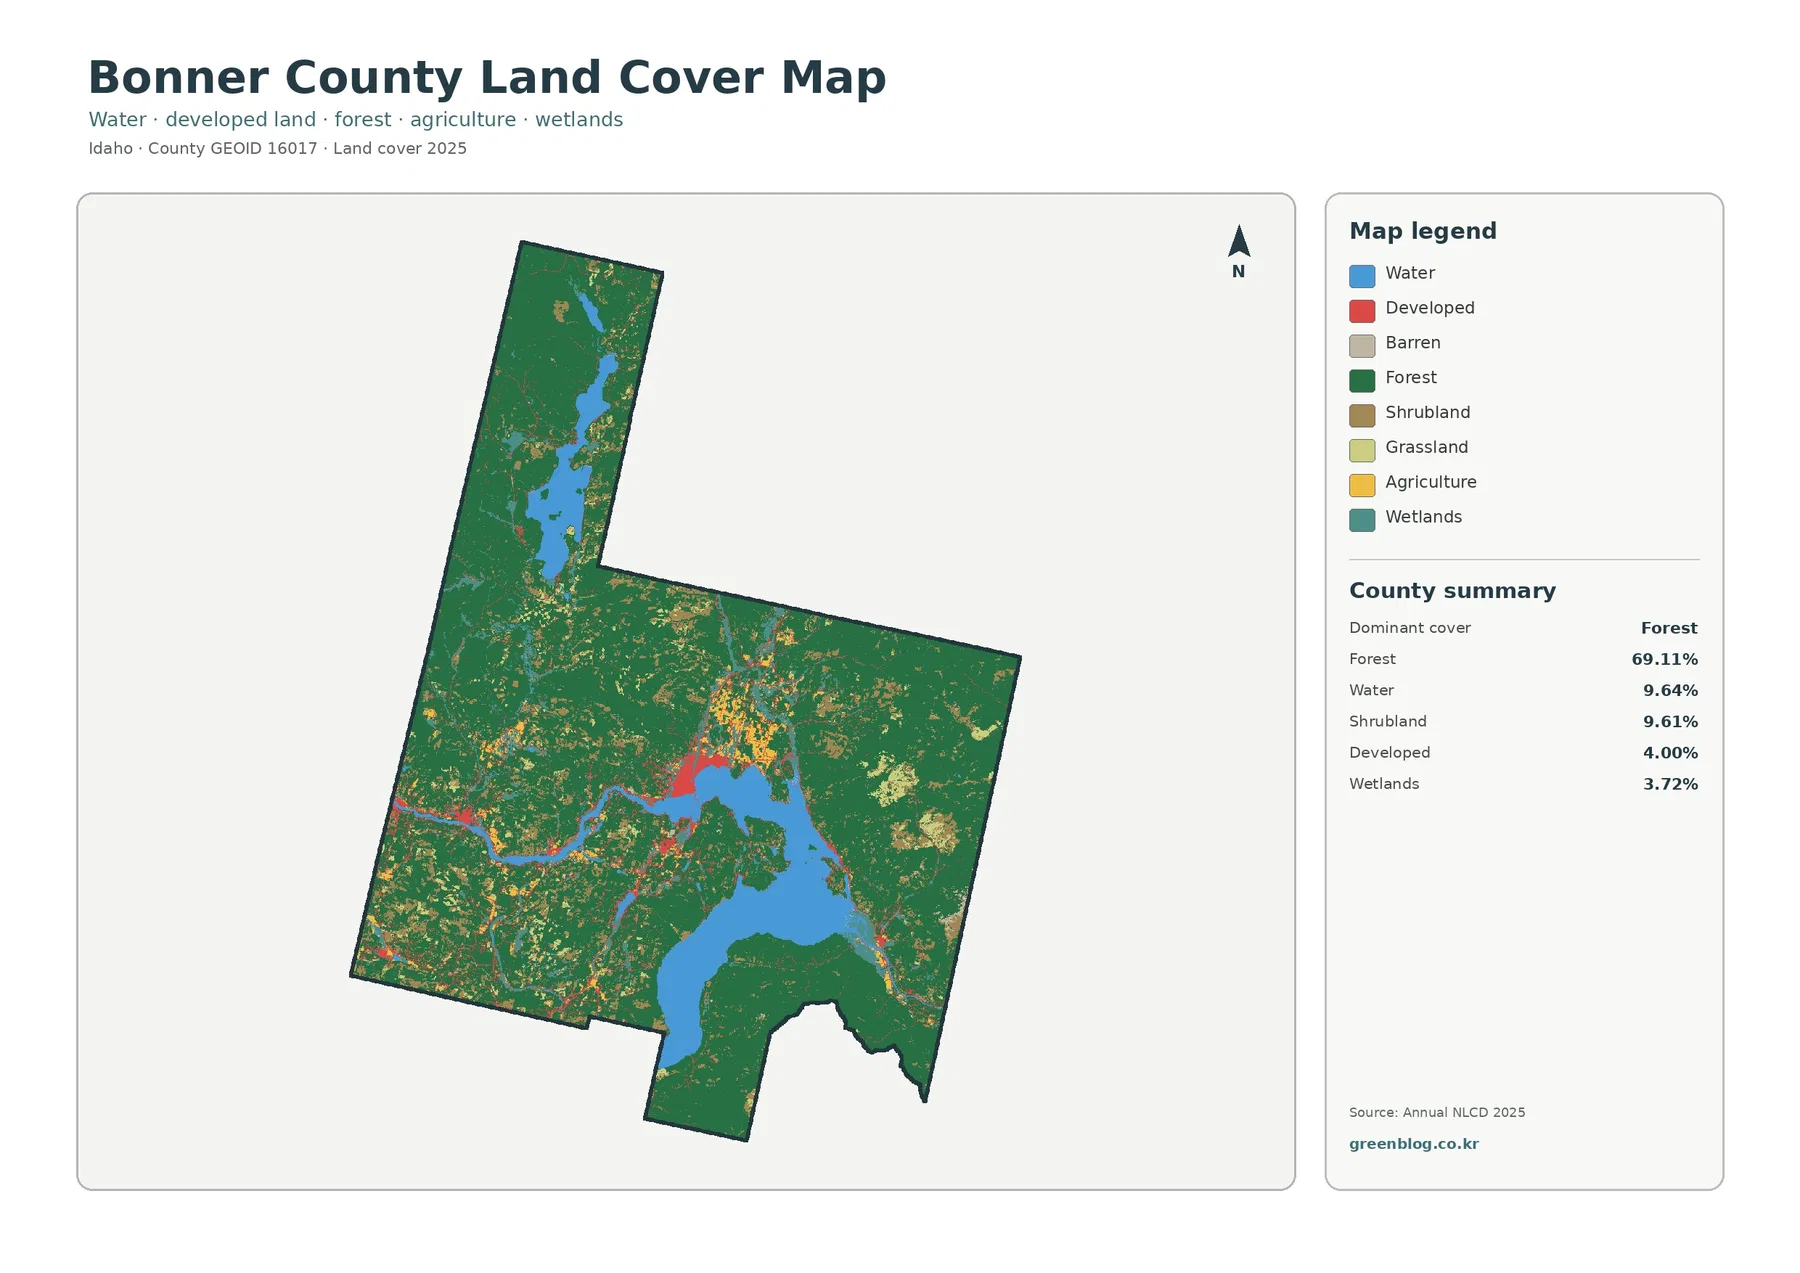
Dark green forest fills most of the county outline, including the long northern extension and much of the eastern and southern land around Lake Pend Oreille. The 69.11% share is not expressed as one uninterrupted block, however. Large blue water bodies, lighter shrub and grass patches, wetlands, and small developed clusters interrupt the forest in very different ways depending on location. The east side of the main lake remains particularly forest-heavy, while the northwest side contains a much more varied mix.
Open water covers 9.64% of the supplied classification. The large central blue shape is Lake Pend Oreille, and the northern extension contains the Priest Lake system. Bonner County planning material separately describes about 9.1% of the county’s total area as surface water and identifies Lake Pend Oreille as Idaho’s largest natural lake. Those numbers come from different sources and should not be treated as the same measurement, yet both show why water occupies such a large share of the county’s geographic footprint.
Shrubland is 9.61%, almost equal to the mapped water share, but its distribution is much more fragmented. Brown patches are frequent in the west and southwest and appear in smaller openings through the interior. Grassland adds 2.35% and agriculture 1.37%. Because several open-cover classes can appear pale or yellowish, an open-looking patch should not automatically be called farmland. The simplified vegetation layer is needed to separate cultivated ground from shrub and grass cover.
Wetlands account for 3.72%. Teal bands and patches occur near lakes, stream-connected lowlands, and several valleys. They are distinct from the 9.64% open-water class: blue marks exposed water surfaces, while wetland classes can contain vegetation and saturated ground. That distinction matters around Lake Pend Oreille and Priest Lake, where blue and teal often occupy neighboring parts of the landscape.
The Sandpoint side of Lake Pend Oreille contains the county’s strongest developed concentration
Developed cover totals 4.00%, but it is far from evenly distributed. The largest red concentration sits on the northwest side of Lake Pend Oreille, with smaller developed traces extending west, north, and around nearby shore and valley areas. Bonner County’s current comprehensive-planning material identifies Sandpoint as the county seat, and county planning also recognizes separate areas such as Priest River/Oldtown, Sagle, Selle Valley, and Southwest Bonner County. The land-cover image itself does not draw those legal boundaries, so the red pixels should be read as developed surface rather than municipal limits.
The contrast around the northwest shore is sharp because forest and water begin immediately outside the built concentration. Westward, the developed pattern becomes thinner and more linear instead of forming one continuous urban area. Farther north in the Priest Lake extension, red cover is sparse relative to forest and water. This difference between a compact center, connecting traces, and a lightly developed northern lake district is one of the clearest spatial patterns in the four supplied images.
Bonner County’s GIS office maintains county spatial data and an online GIS Viewer for government and public reference. That service and the NLCD layer answer different questions. The land-cover image classifies surface types at county scale, while parcel boundaries, ownership, named roads, tax records, and legal property questions belong in county GIS or other authoritative records.
Only 1.37% is agricultural, and the cultivated patches stay small beside the forest blocks
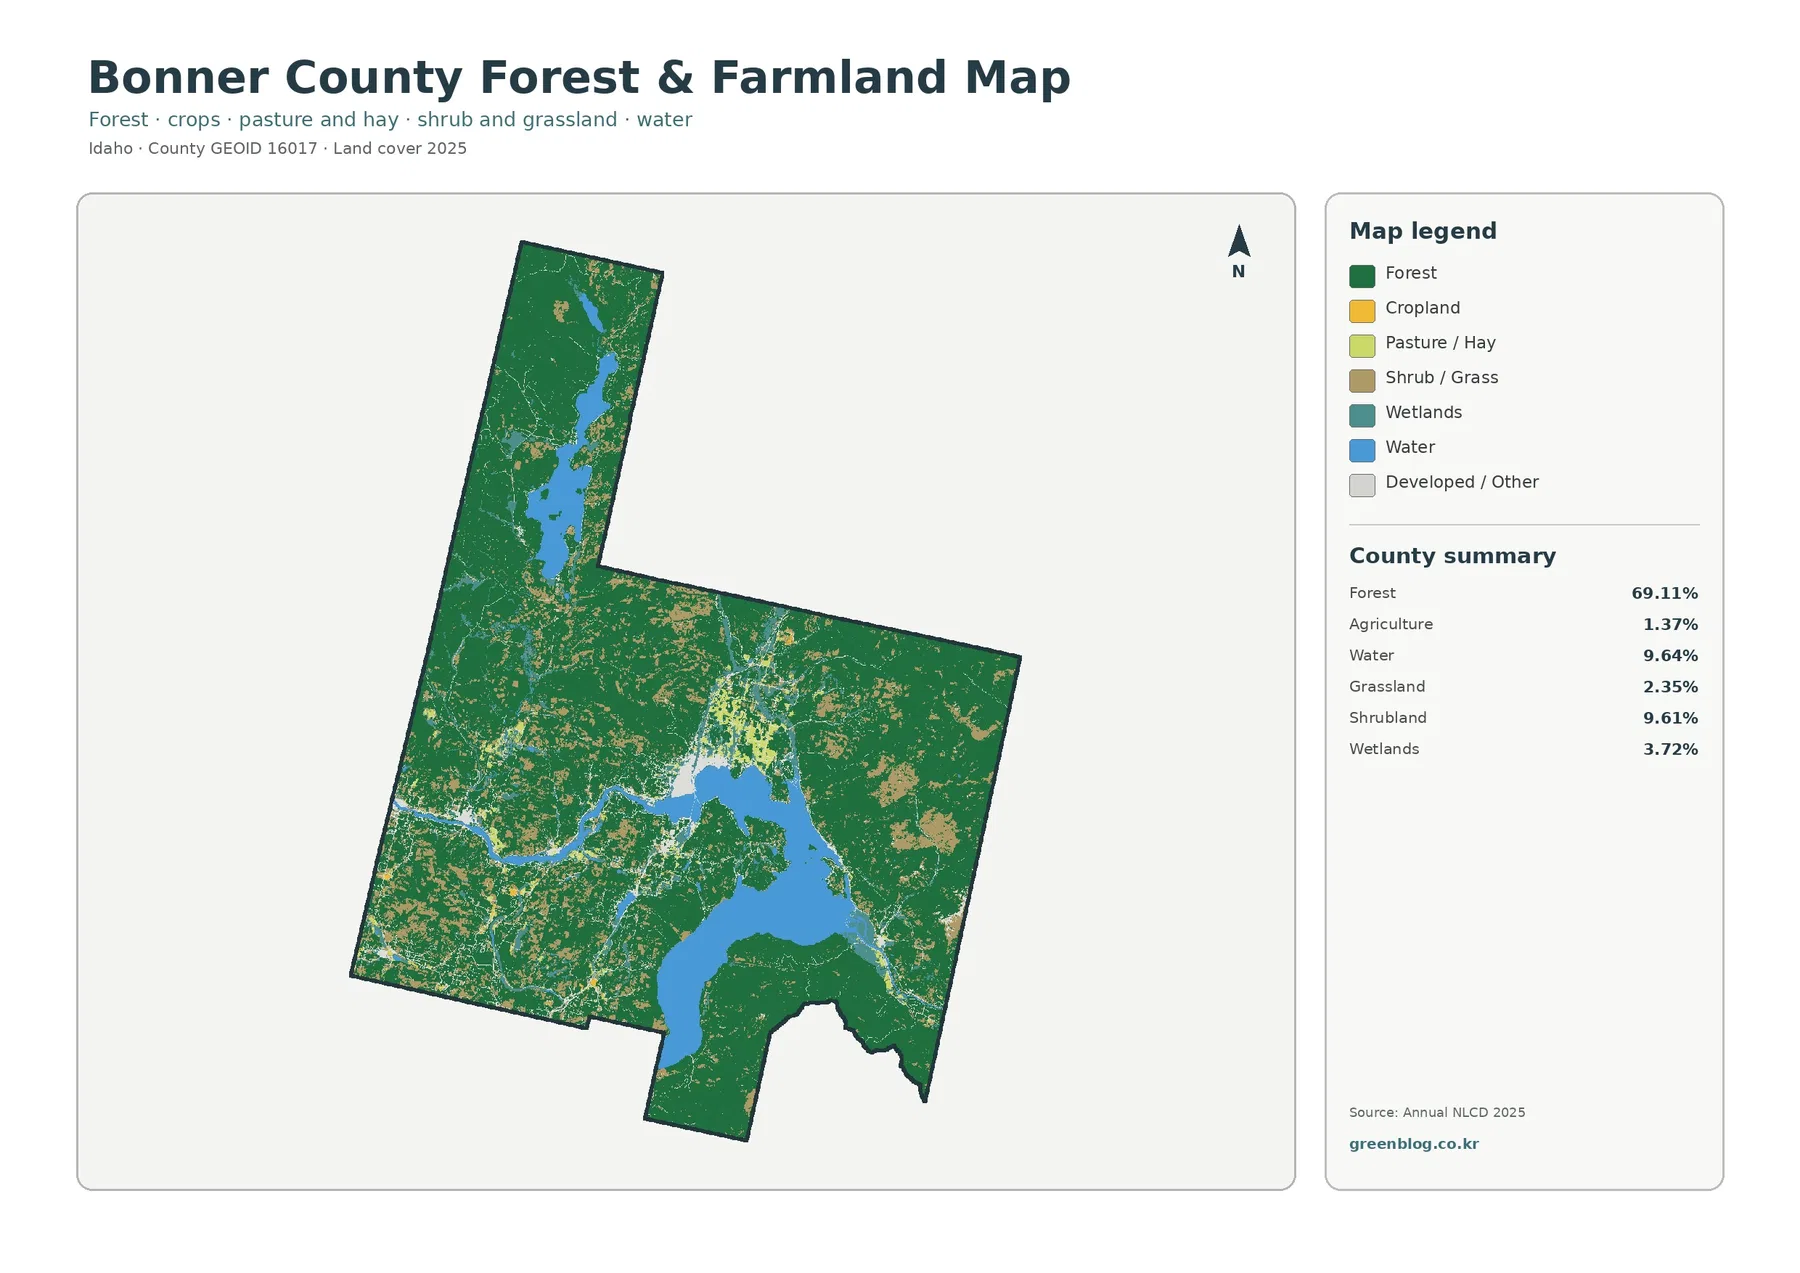
Removing several minor classes makes the forest pattern even more dominant. Much of the north and east remains solid green, while shrub-and-grass openings break up the west and southwest. Yellow agricultural areas are small and scattered, appearing as compact patches or narrow valley features rather than a countywide belt. The 1.37% agricultural share is therefore visible not only in the summary but in the limited size of the yellow areas.
North and northwest of Lake Pend Oreille, agriculture, grassland, shrubland, wetlands, and developed/other surfaces form a more finely divided mosaic than the heavily forested east side. In the eastern half, cultivated yellow is scarce and large green blocks dominate. The same countywide forest percentage produces very different local landscapes because open and developed classes cluster in selected valleys rather than spreading evenly through the mountains.
The Priest Lake extension remains mostly forest and water with small open-cover interruptions. Some pale or tan patches appear there, but the legend separates cropland, pasture/hay, shrub/grass, wetlands, water, and developed/other. A light patch cannot be assigned to agriculture without checking its class. Crop type, farm ownership, irrigation status, and parcel use are beyond what the supplied classification can establish.
This vegetation image also shows why the 9.61% shrubland share matters. Shrub and grass cover forms a substantial transition between forest and the smaller farm or developed areas, especially in the western half of the county. Without that class, the landscape could be misread as a simple forest-versus-farmland division, which the supplied data does not support.
A 1.05% mean impervious value hides a compact hard-surface center and several thin corridors
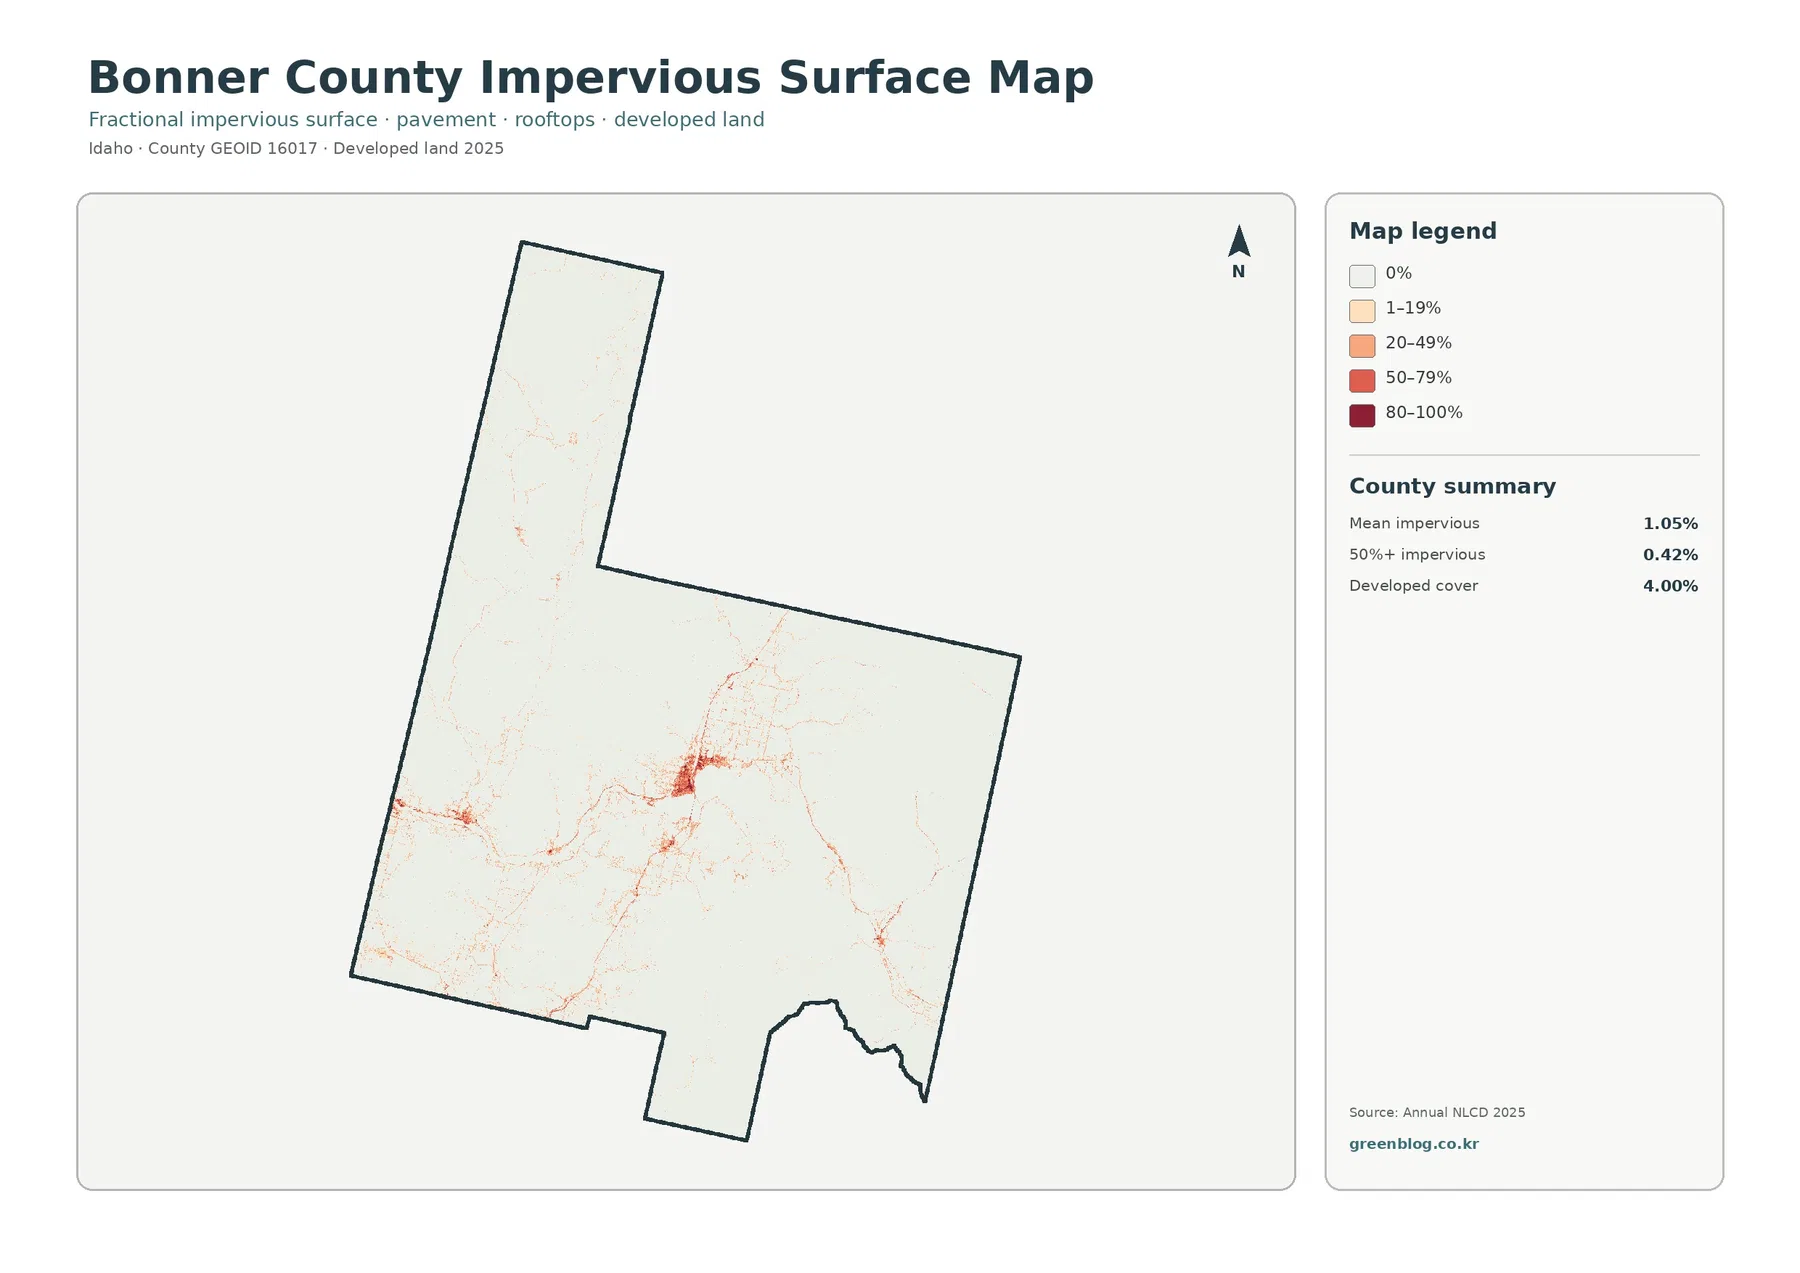
Impervious surface represents rooftops, pavement, parking areas, and other hard cover that prevents water from readily soaking into the ground. Bonner County’s mean impervious value is 1.05%, and only 0.42% of the county lies in cells with at least 50% impervious cover. Those averages are low because forest, lakes, wetlands, shrubland, and other non-built surfaces occupy most of the county.
The distribution is far more concentrated than the countywide average suggests. The darkest cluster appears northwest of Lake Pend Oreille, matching the general location of the largest developed patch on the current land-cover image. Thin orange lines and smaller nodes extend westward and northward, and a few separate concentrations appear closer to the southern and eastern edges. The Priest Lake extension remains mostly pale, with only faint linear traces.
Developed cover is 4.00%, substantially higher than the 1.05% mean impervious value. The difference is expected because a developed land-cover class can include lawns, trees, exposed soil, and other permeable surfaces around buildings and roads. The impervious layer isolates the hard portion within and between those developed areas. A residential area can therefore be classified as developed without being close to 100% pavement or roof.
The thin lines on this image are not a substitute for a road map. They indicate hard-surface fractions within raster cells but do not provide route names, traffic status, public access, or ownership. Bonner County GIS is the appropriate source for parcel and local mapping questions. The impervious layer should be interpreted only as the concentration of hard surface relative to the county’s much larger natural-cover background.
Forest-loss classifications account for more than half of the 16.57% endpoint difference
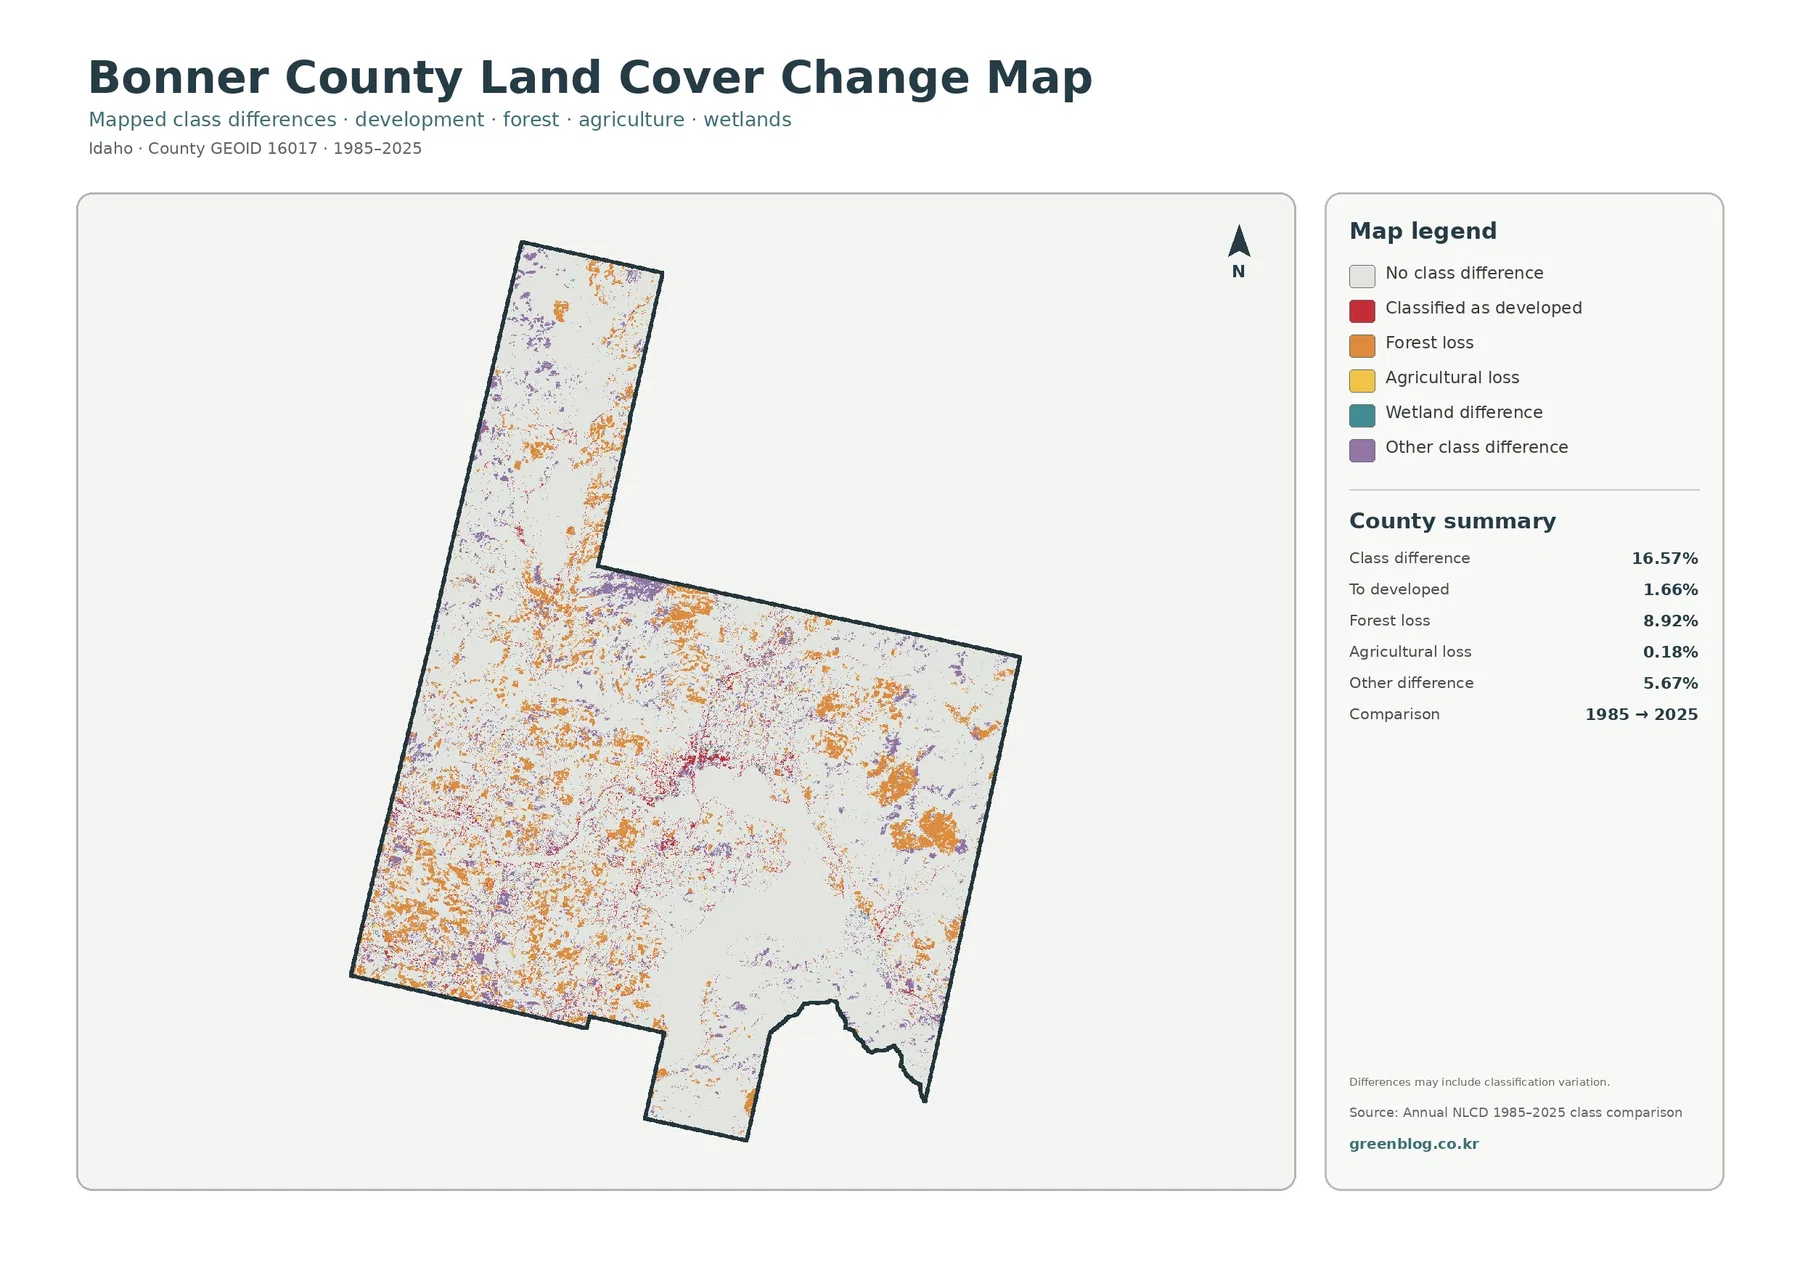
The supplied comparison marks 16.57% of Bonner County with a different class at the 1985 and 2025 endpoints. Forest loss is the largest listed category at 8.92%. Cells classified to developed account for 1.66%, agricultural loss is 0.18%, and other class difference is 5.67%. The total is therefore not a measure of urban growth. Most of the mapped endpoint difference belongs to forest loss and other non-developed class changes.
Orange forest-loss patches are spread through the southwest, west, interior, and northern extension. They do not form one single clearing front. Red developed-change cells are more concentrated near the northwest side of Lake Pend Oreille and along some of the same corridors highlighted by the impervious layer, but small red marks occur elsewhere as well. Purple other-difference areas are scattered among forest and open-cover zones throughout the county.
“Forest loss” on this layer has a narrow classification meaning: a cell was forest at one endpoint and another class at the other. The image cannot determine whether the cause was timber harvest, wildfire, vegetation succession, road construction, development, or classification variation. The map itself warns that class differences may include classification variation. A cause requires intermediate-year imagery and additional records.
Agricultural loss is only 0.18%, and that category should not be interpreted as farmland converted directly to buildings. It only records that the endpoint class differs from agriculture in the specified cells. The same logic applies to the broader 5.67% other-difference category, which can contain changes among shrubland, grassland, forest, wetland, barren, or other classes without any development conversion.
Large lakes are a structural part of Bonner County, not a minor background feature
Bonner County planning documents describe Lake Pend Oreille as Idaho’s largest natural lake, covering about 90,000 acres, and also identify Priest Lake and Upper Priest Lake as major natural features in the northwest part of the county. That county context matches the supplied land-cover image, where blue water occupies 9.64% and forms large continuous surfaces rather than narrow stream lines alone.
Lake Pend Oreille also provides a fixed reference for comparing surrounding land cover. The northwest shore contains the strongest developed and impervious concentration, the east side is much more heavily forested, and the north side contains a finer mix of forest, open vegetation, wetlands, and development. Reading the shore zones separately prevents a large lake from being treated as an empty gap between otherwise similar land areas.
The long Priest Lake extension shows another combination. Forest and water dominate, while agriculture and hard-surface cover remain limited. Comparing that northern extension with the Lake Pend Oreille core makes clear that two lake districts inside the same county can have very different settlement density and surrounding vegetation patterns.
Compare the four files by location, not by treating their legends as interchangeable
Start with the 2025 overview to establish where forest, water, shrubland, wetlands, and development dominate. Then examine the forest-and-farmland image at the same location to separate cultivated yellow from shrub-and-grass openings. Around the northwest shore, the impervious layer adds another distinction by showing where rooftops and pavement are concentrated within the broader developed class.
The endpoint layer must be read differently. Its orange, red, purple, and other colors describe differences between 1985 and 2025 rather than current surface classes. A place that is green forest on the 2025 map can still carry an orange or purple mark on the change image because the two endpoint classifications differ. The colors from the change legend should never be transferred to the current-cover legend.
For a report about the Sandpoint-side settlement pattern, current cover and impervious surface can be placed together. For forest and open-land comparison, current cover and the simplified vegetation image provide the direct contrast. The endpoint layer belongs next to a current image only when the subject is long-term class difference. Keeping two large images readable preserves more information than shrinking all four into a single crowded panel.
Thirty-meter cells and the 2025 observation date limit site-level conclusions
Annual NLCD is a raster product, so the landscape is divided into square cells. At the commonly used 30-meter cell size, one predominant class is assigned even when trees, grass, pavement, a building, and water share the same small area. Along Bonner County’s shorelines, wetlands, narrow valleys, and small developed corridors, that generalization can make boundaries look blockier or wider than they are on the ground.
Increasing the display size cannot restore parcel detail that is absent from the original cells. A thin road may merge into adjacent developed pixels, a narrow wetland may appear discontinuous, and a field edge may look rectangular. Survey boundaries, zoning, ownership, access rights, wetland jurisdiction, building approval, and current road status require specialized and current records rather than this county-scale classification.
The current maps carry the supplied 2025 observation year. Construction, wildfire, timber activity, vegetation recovery, agricultural changes, or water-level differences after that date may not appear. The change image is also an endpoint comparison rather than a year-by-year history. A location may have changed several times between 1985 and 2025 without those intermediate stages being visible in the final two-date layer.
Each original JPG measures 2480 × 1754 pixels. The files can be placed in documents, classroom materials, and presentation layouts, but the supplied asset manifest does not identify them as meeting an A3 high-resolution reference. Large-format printing should be proofed first, and the original aspect ratio should be preserved so Bonner County’s long northern extension and lake shapes are not distorted.
Frequently Asked Questions
What is the dominant land-cover class in Bonner County?
Forest is the largest 2025 class at 69.11%. Open water follows at 9.64% and shrubland at 9.61%, while developed land is 4.00% and wetlands are 3.72%.
Why does water cover such a large share of Bonner County?
Lake Pend Oreille occupies a large central part of the county, and the northern extension contains Priest Lake and Upper Priest Lake. County planning documents also describe surface water as a major part of Bonner County’s total area.
Does the 16.57% class difference mean that much of the county became developed?
No. Only 1.66% is listed as classified to developed. Forest loss is 8.92%, agricultural loss 0.18%, and other class difference 5.67%, so the total combines several kinds of endpoint classification change.
Sources and Reference Data
- MRLC Annual NLCD Data – official access point for Annual NLCD land-cover and comparison products
- USGS Annual NLCD Land Cover Classification – definitions for forest, water, shrubland, developed land, wetlands, agriculture, and other classes
- Bonner County Comprehensive Plan – official county planning material for land use, natural resources, agriculture, transportation, and related topics
- Bonner County GIS – official county GIS Viewer and spatial-data resources
Map File Information
The ZIP contains four original JPG files covering Bonner County's 2025 land cover, forest and farmland, impervious surface and developed land, and 1985–2025 endpoint class differences.
- Included Files: 4 high-resolution JPG land cover map files shown in this article
- File Type: JPG files in a ZIP archive
- Intended Use: Printing, education, presentations, and map-based projects
Related Maps
Green Map creates custom-edited map images using open geographic data sources such as geoBoundaries, Natural Earth, OpenStreetMap, and government open data. These maps are edited visual materials, not raw data files, and are provided for education, documents, presentations, and graphic reference.