Forest is the largest class on the supplied 2025 Boise County image at 45.72%, but it does not cover the county evenly. Broad forest blocks dominate much of the center and south, while shrubland at 33.79% and grassland at 16.93% occupy large open areas toward the northeast, east, and parts of the west. Developed land is only 1.79%, so the small settlement concentrations are conspicuous mainly because they sit inside a very large mountain landscape. This Boise County Idaho Land Cover Map focuses on those contrasts.
The page includes four views: 2025 land cover, forest and farmland, impervious surface with developed land, and a 1985–2025 endpoint comparison. The WebP images can be examined in the article, and the four original 2480 × 1754-pixel JPG files are available together in one ZIP below. Comparing the same area across the set separates forest, open vegetation, small settlement nodes, and long-term classification differences without treating them as the same type of information.
Table of Contents
Large forest blocks occupy the county interior while open cover expands toward the edges
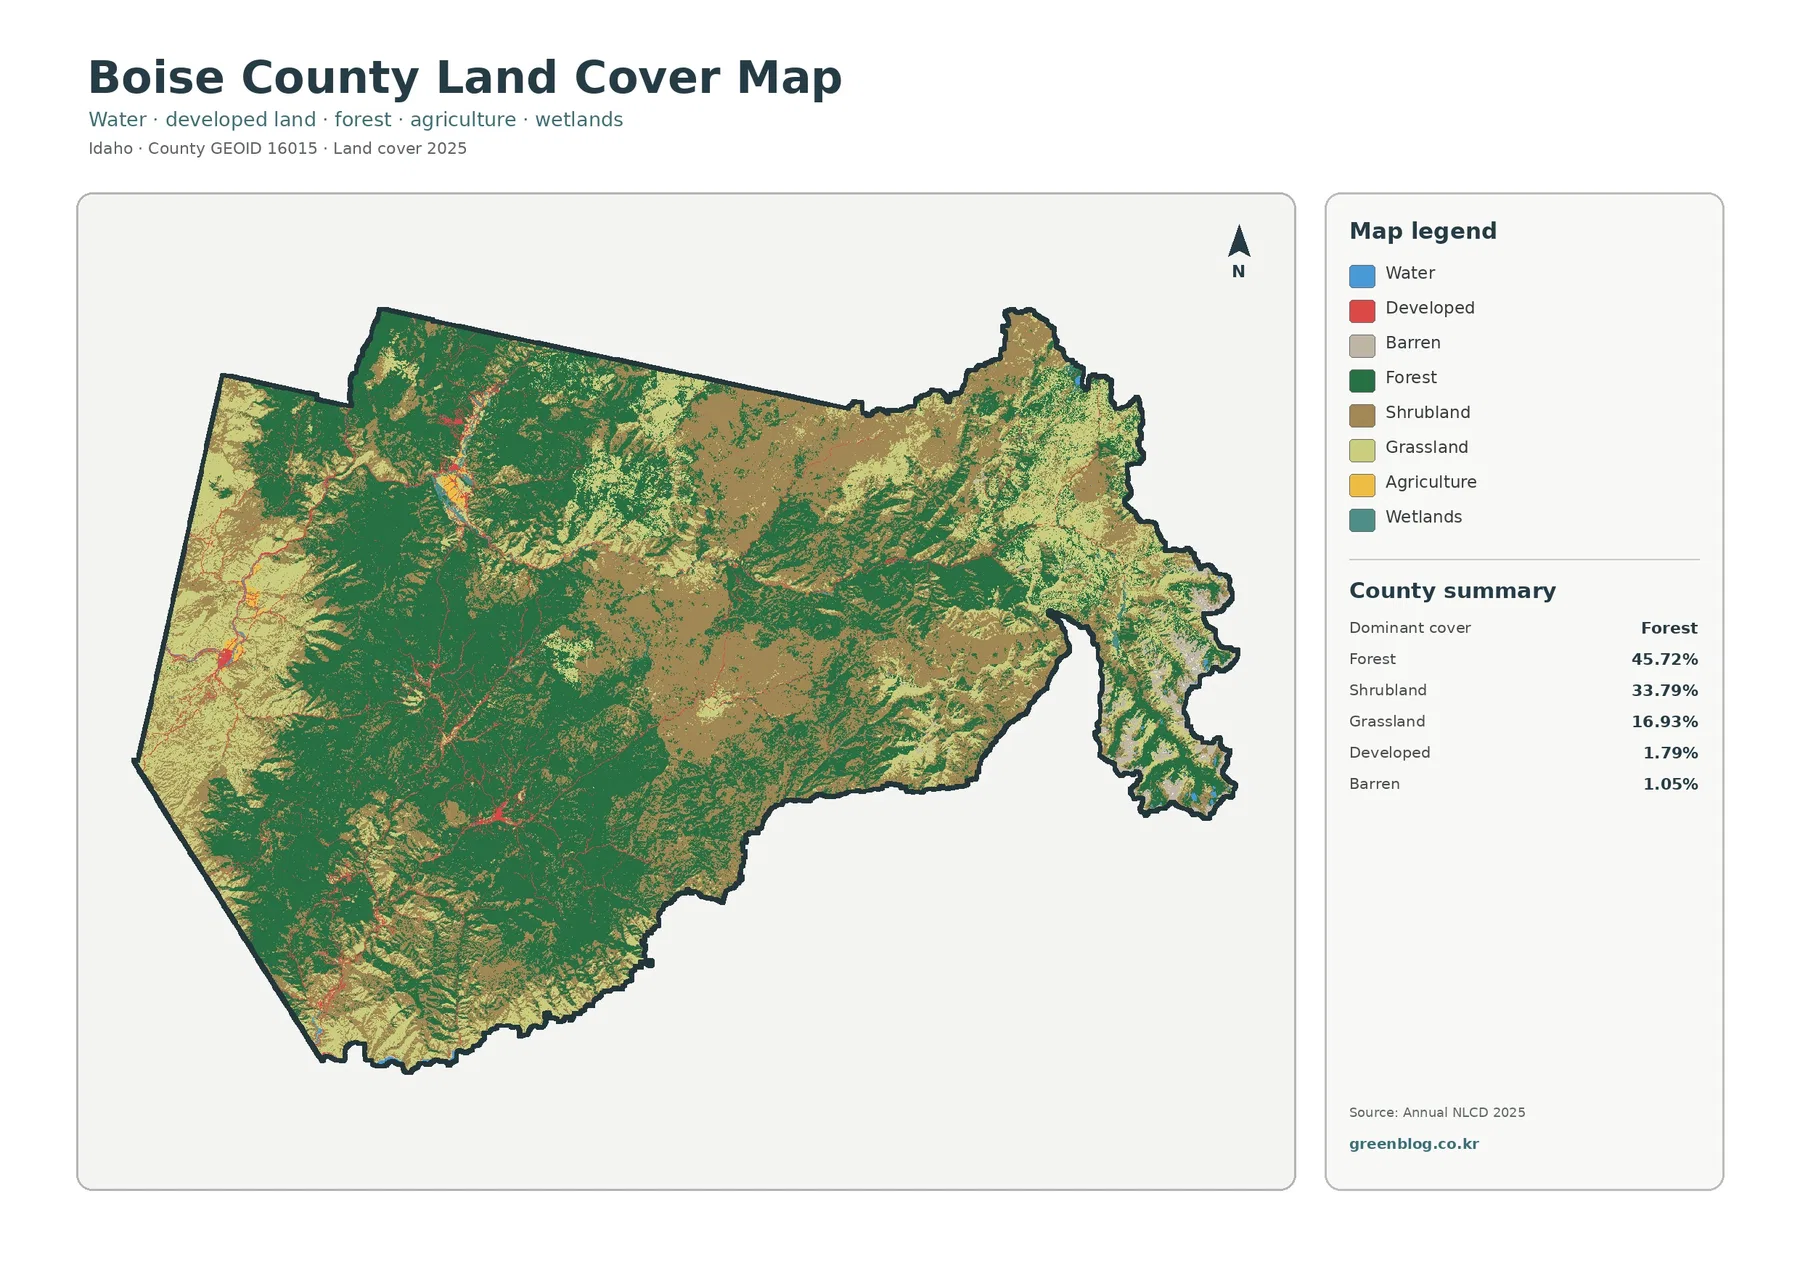
The central and southern portions of Boise County are dominated by dark-green forest. The pattern remains extensive through the county’s southeastern extension and across much of the interior mountain country. Boise County’s 2024 comprehensive plan describes mountains, valleys, rivers, streams, and forests as major natural resources and notes that more than 80% of the county is managed by federal or state agencies, with much of that land associated with Boise National Forest. Land-cover classification is not an ownership layer, but the official description helps explain the county’s strongly forested character.
Shrubland is the second-largest class at 33.79%. It is especially broad across northeastern and eastern sections and fills many openings between forested slopes. Grassland adds 16.93% and becomes prominent in several western and northeastern areas. These two open-cover classes make Boise County more varied than a simple forest percentage suggests. Some parts are densely green, while others are dominated by tan shrub and lighter grass cover over broad mountain and basin surfaces.
Developed land accounts for 1.79% and barren ground for 1.05%. Red developed marks are concentrated in small clusters and thin traces rather than a continuous urban belt. Pale barren areas occur as scattered pieces within mountain and open vegetation. Keeping those classes separate matters because a sparsely vegetated surface is not automatically a road, building site, or settlement.
The west side contains the clearest settlement concentrations inside a mostly natural-cover county
The western edge and west-central portion of the image contain several of the strongest developed clusters. Boise County’s own planning material treats Horseshoe Bend, Garden Valley, Idaho City, Lowman, Placerville, and related areas as distinct communities or planning areas. The land-cover image does not label their municipal boundaries, yet the western clusters provide a broad visual counterpart to the county’s settlement geography.
Garden Valley is described in county material as a major basin associated with the Payette River system, and the county’s visitor information places Crouch near the confluence of the Middle and South forks of the Payette River. In the western portion of the land-cover image, open shrub and grass surfaces, narrow water features, and small developed patches occur close together. That combination differs from the more continuously forested interior and shows why a countywide percentage can conceal strong local contrasts.
Horseshoe Bend lies in another western setting where developed and impervious marks are relatively concentrated. This does not make the western edge heavily urbanized in countywide terms. Instead, settlement occupies a very small part of a county where forest, shrubland, and grassland together exceed 96% of the listed 2025 summary. The image therefore works best when developed patches are judged against the scale of the surrounding natural cover.
Agriculture is only 0.18%, leaving forest and shrub–grass cover as the dominant vegetation story
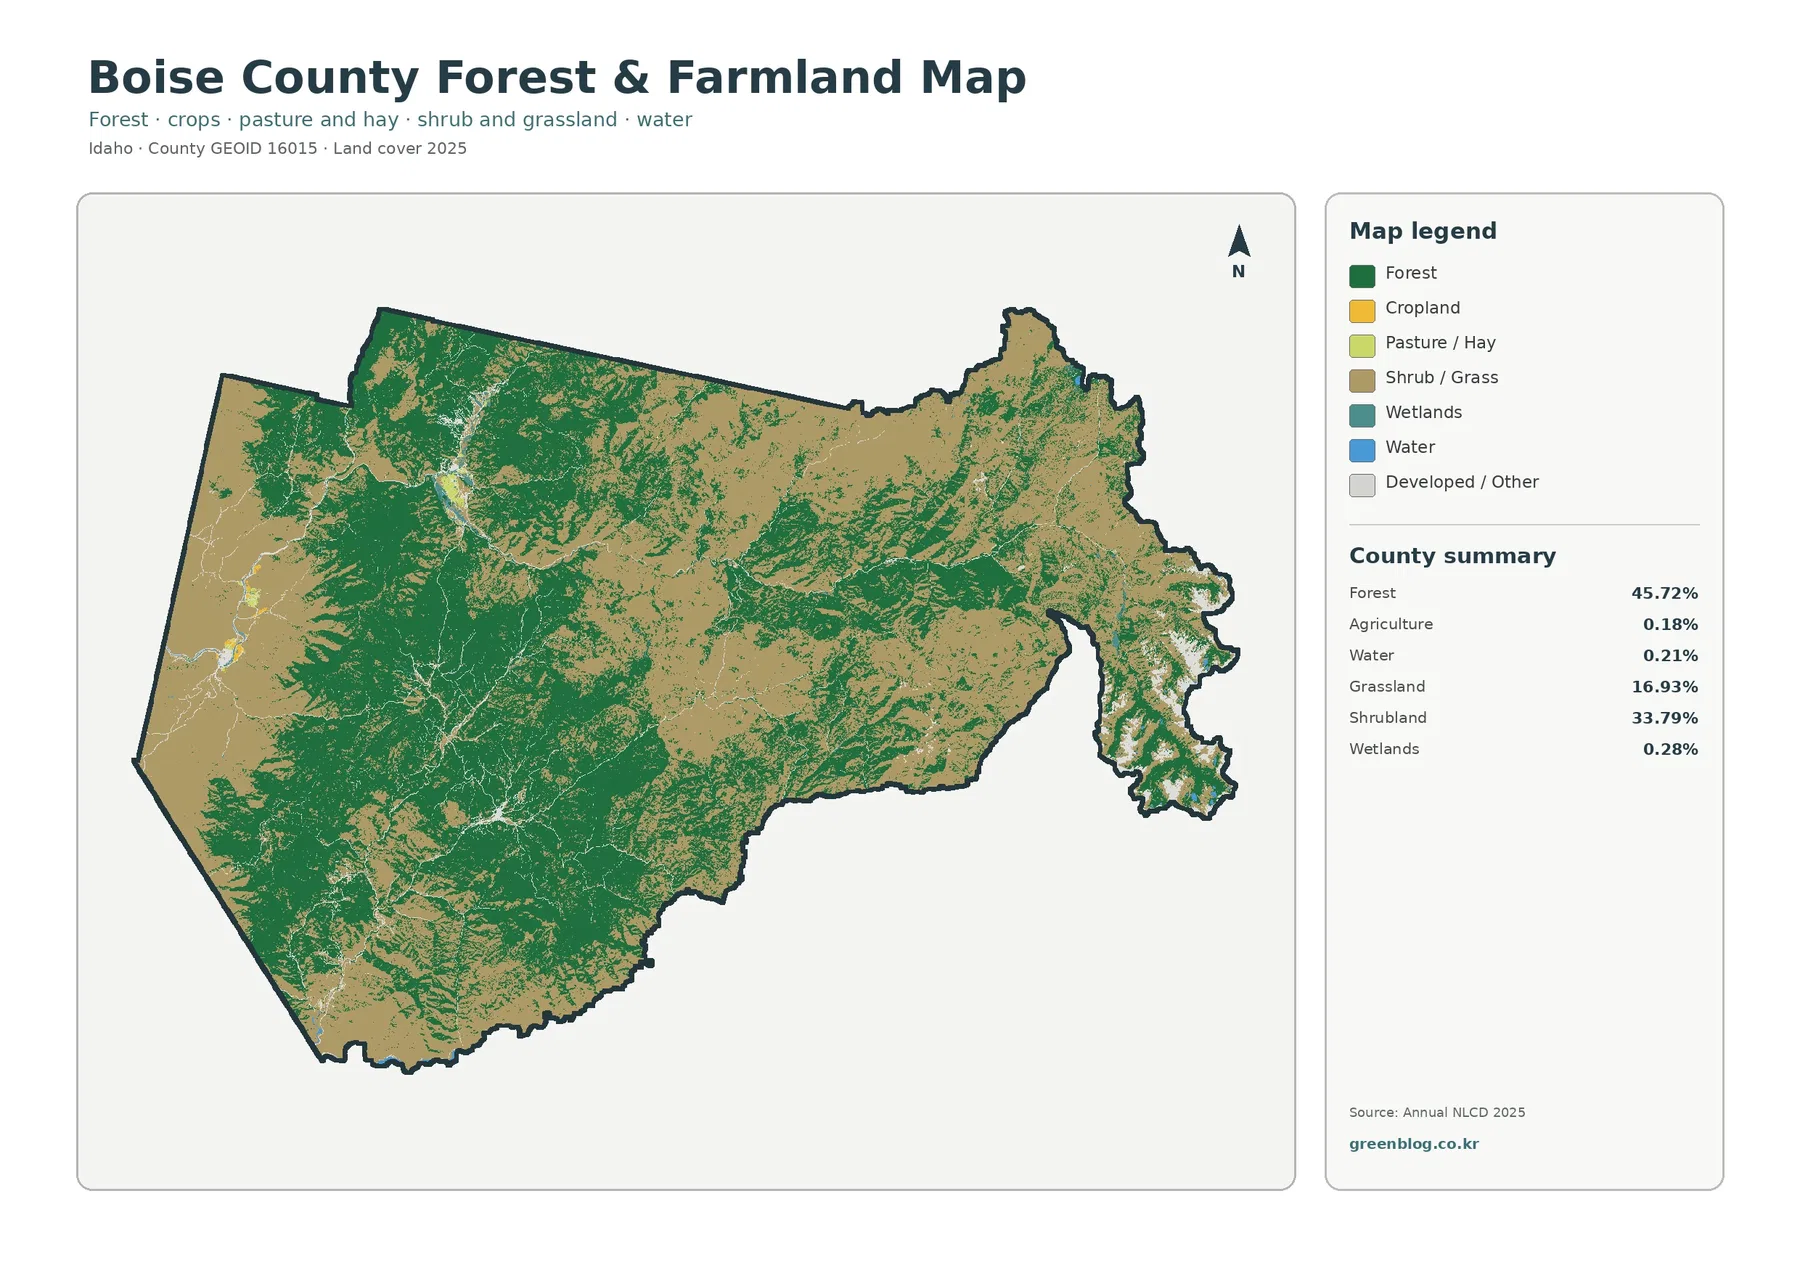
The forest-and-farmland image makes Boise County’s small agricultural footprint immediately apparent. Agriculture is 0.18% in the supplied 2025 summary, appearing only in a few narrow western and northwestern locations. Forest remains dominant through the center and south, while shrub and grass occupy broad openings toward the northeast and along parts of the west side.
A tiny agriculture percentage should not be interpreted as proof that farming or ranching has no local role. Boise County’s comprehensive plan discusses water use for irrigated agriculture in the Payette and Boise river basins. The map only says that cells assigned to an agricultural land-cover class occupy a very small share of the entire county. Grazing, farm operations, water rights, and parcel use require different records.
Water covers 0.21% and wetlands 0.28%. Their countywide shares are small, but blue and teal traces remain visible in selected valleys and drainage corridors. County planning material identifies tributaries such as Deadwood River, Clear Creek, Alder Creek, Grimes Creek, and Mores Creek within the Payette and Boise drainage systems. Those official hydrologic references provide context for the narrow water-related features that cut through much larger forest and open-cover areas.
The simplified vegetation view also prevents open ground from being mistaken for farmland. Large tan areas are shrub and grass rather than crops or pasture. That distinction is particularly important on the northeastern and eastern sides of Boise County, where open vegetation occupies large contiguous areas even though agriculture is almost absent from the county summary.
A 0.32% mean impervious value shows how limited hard surfaces are outside settlement nodes
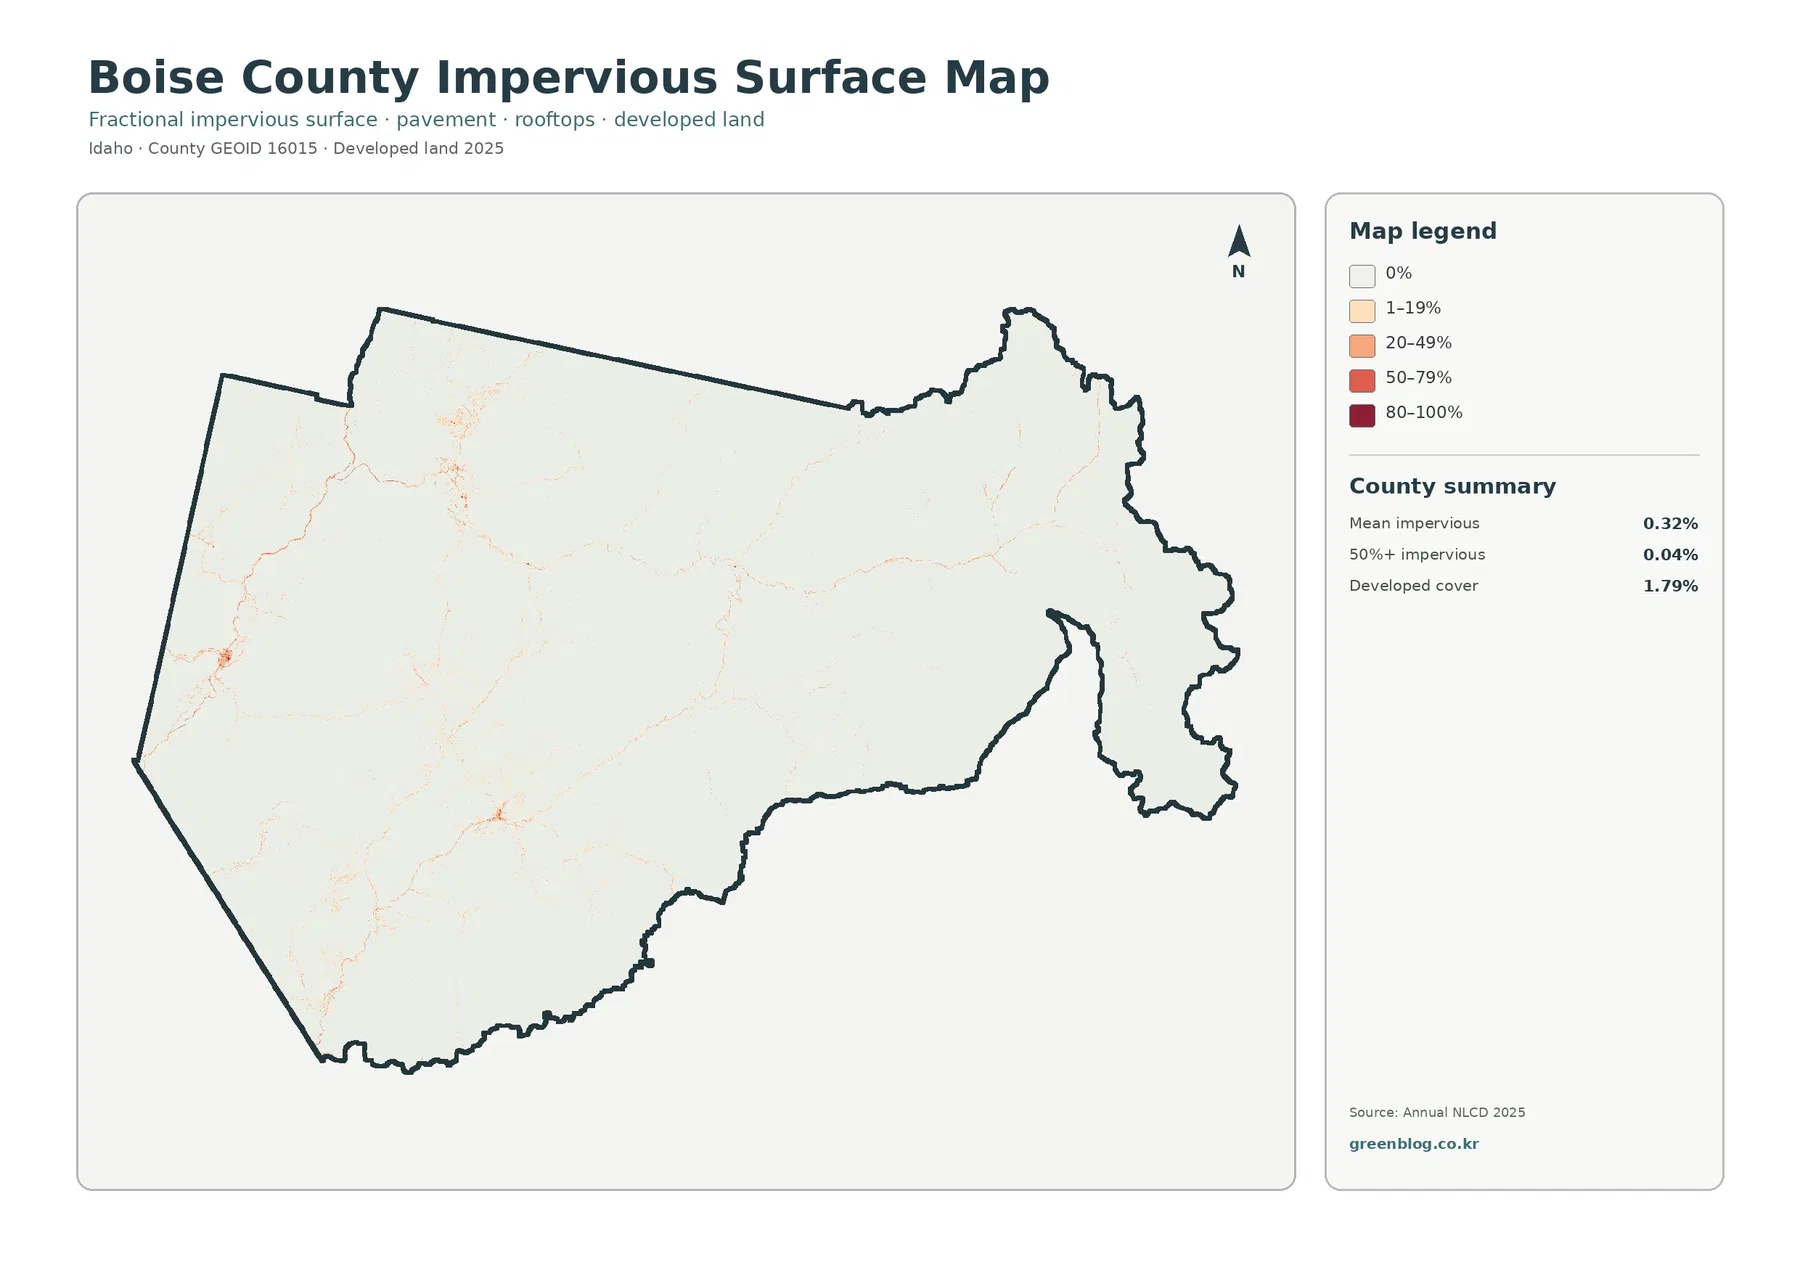
Impervious surface refers to hard cover such as rooftops, pavement, and parking areas where water does not readily soak into the ground. Boise County’s mean impervious value is only 0.32%, and cells with at least 50% impervious cover occupy 0.04% of the county. Most of the image is therefore nearly white, which matches the broad forest and open-vegetation dominance in the current land-cover view.
Hard surfaces become easier to see along the western edge, in several west-central clusters, and as thin connecting traces through the interior. The pattern is localized rather than widespread. Even where the developed land-cover class reaches 1.79%, the mean impervious value remains much lower because developed classes can include lawns, trees, bare soil, and other permeable surfaces around buildings and roads.
The thin lines should not be treated as a road network. This layer does not identify route numbers, public access, private roads, maintenance status, or traffic. A traveler looking for a route to Idaho City, Garden Valley, or Lowman should use county or state transportation information. The impervious image is valuable here because it isolates hard-surface concentration from the much larger background of forest and shrub–grass cover.
Forest-loss classification accounts for most of the 28.30% endpoint difference
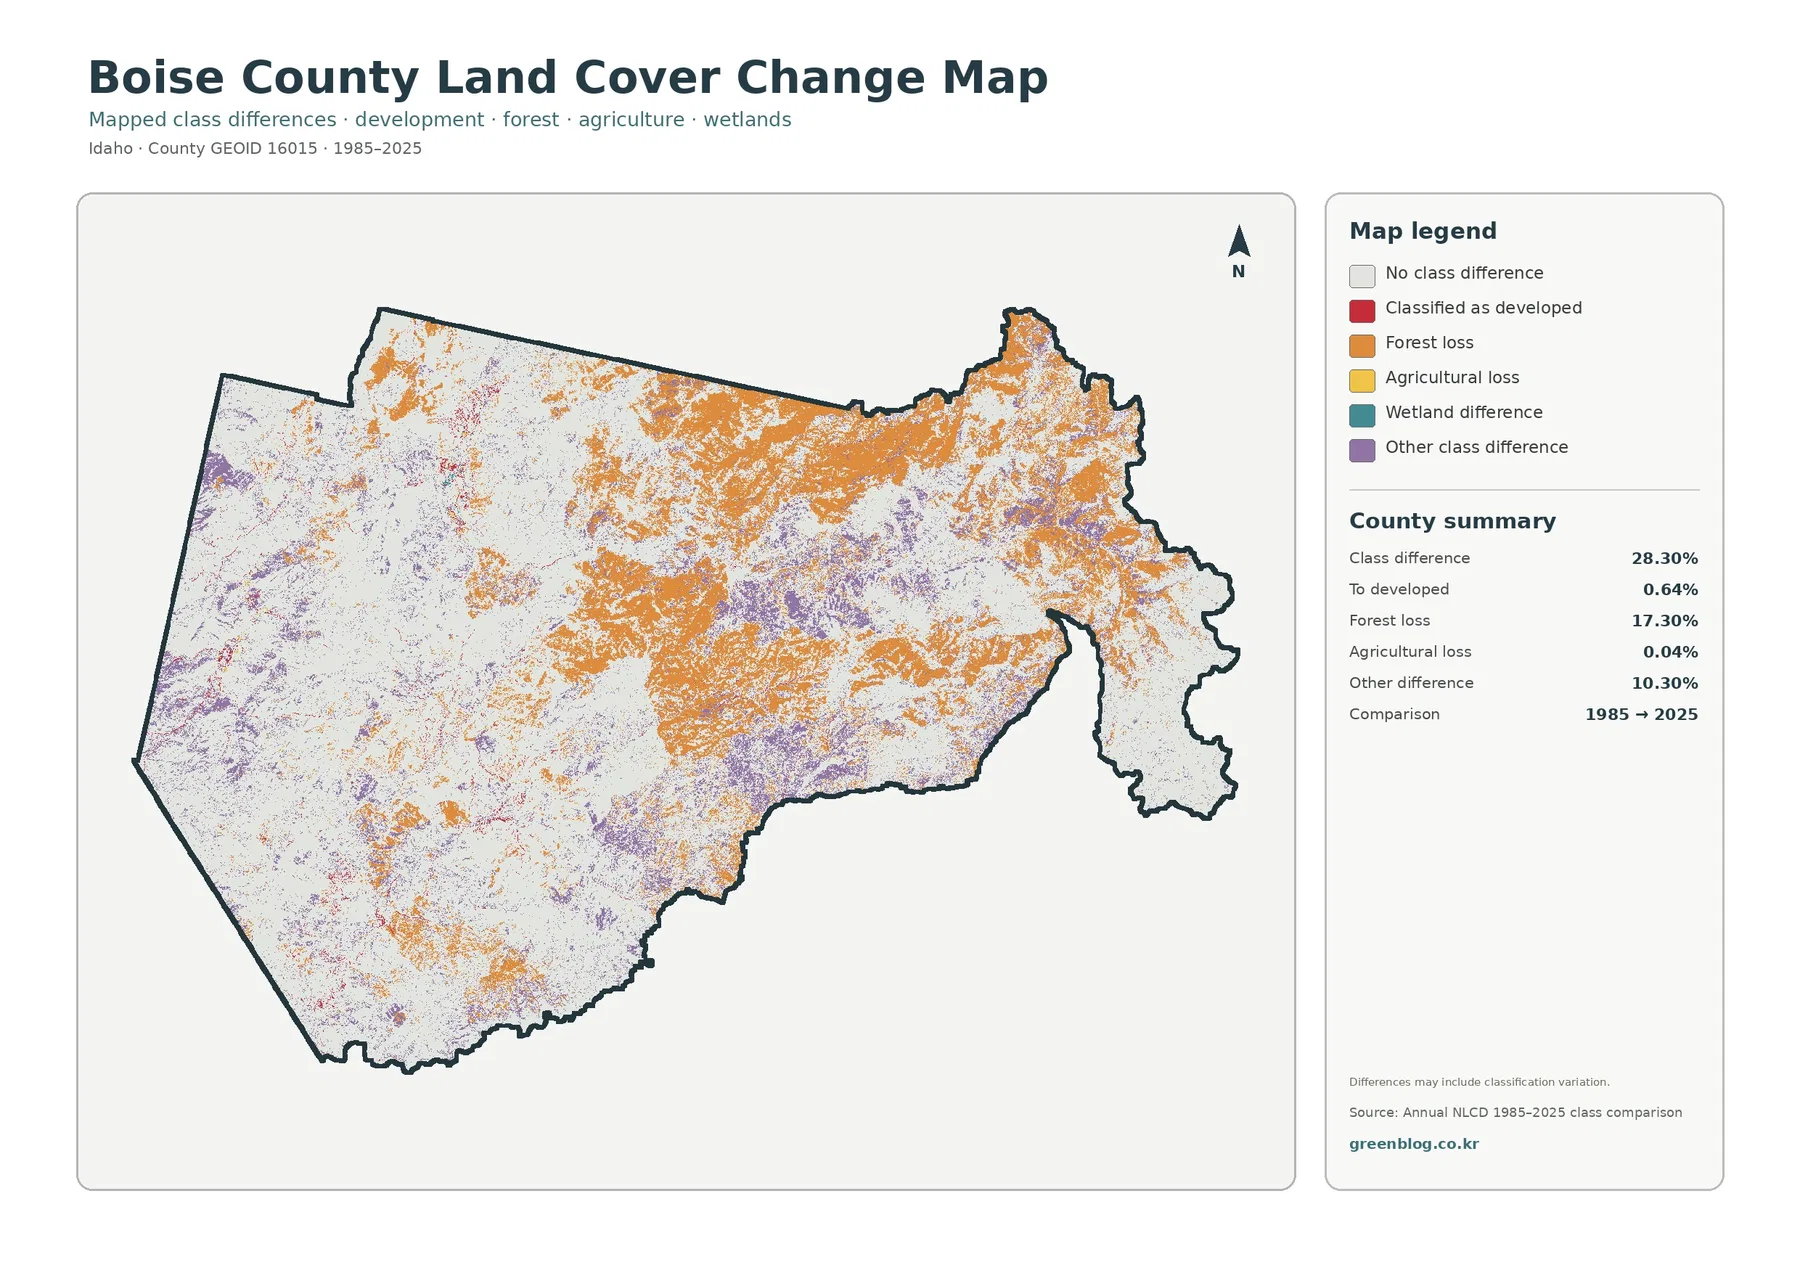
The supplied comparison marks 28.30% of Boise County as having a different class at the 1985 and 2025 endpoints. Forest loss is 17.30%, other class difference 10.30%, classified to developed 0.64%, and agricultural loss 0.04%. The total is therefore not a measure of urban expansion. Development-related difference is a small component of a much broader set of endpoint changes.
Orange forest-loss areas are extensive across central, northern, and eastern parts of the county. Purple other-difference patches are more scattered, including portions of the west and south. Red developed-difference marks remain narrow and localized near existing settlement patterns. Comparing this layer with the current impervious image makes the scale difference between natural-cover classification change and hard-surface growth especially clear.
Forest loss has a technical meaning on this two-date product: a cell classified as forest at one endpoint is classified differently at the other. The map does not identify wildfire, timber harvest, vegetation recovery, disease, or a classification adjustment as the cause. Establishing cause at a specific location requires intermediate imagery and other records.
The same caution applies to the 10.30% other-difference category. Boise County contains large neighboring areas of forest, shrubland, grassland, and some barren ground, so changes among natural-cover classes can contribute substantially to the endpoint result. Purple should be read as “different class at the two dates,” not as a single type of damage or land use.
Payette and Boise drainage systems help explain the county’s narrow water features
Boise County’s comprehensive planning material describes the Payette and Boise river basins as major parts of the county’s natural-resource setting. It identifies Deadwood River, Clear Creek, and Alder Creek within the Payette drainage and Grimes and Mores creeks flowing toward the Boise River. The county also includes portions of Lucky Peak and Arrowrock reservoirs. These official descriptions supply geographic context for the small but distinct blue and wetland-colored features on the land-cover images.
Because open water and wetlands together occupy less than 1% of the supplied summary, their importance is primarily positional on this map. Narrow water features cross or border forest, shrubland, and settlement areas rather than forming a dominant countywide class. Questions about flood zones, water quality, wetland jurisdiction, reservoir operations, or legal access need current agency data rather than the generalized land-cover layer.
Compare the same Boise County location across the four views
The 2025 overview is the starting point for separating the major classes. It shows the forested interior, broad shrub-and-grass areas, and small developed clusters together. The forest-and-farmland view removes several smaller classes and makes the near absence of agriculture easier to recognize. Those two images answer different questions even though they use the same county boundary.
The impervious layer adds a harder test of development by isolating rooftops and pavement. A place that appears as developed cover can still contain a large amount of permeable ground, which is why the countywide 1.79% developed share and 0.32% mean impervious value are not interchangeable. The endpoint comparison then moves away from current cover entirely and marks where the 1985 and 2025 classifications differ.
For a presentation, pairing two large images usually communicates the county pattern better than shrinking all four into a single panel. Current cover beside impervious surface highlights settlement concentration. Forest-and-farmland beside the endpoint layer is a clearer combination when the subject is forest distribution and long-term classification difference.
Thirty-meter classification and the 2025 observation year set practical limits
Annual NLCD is a raster product, so the landscape is divided into square cells and each cell receives a predominant class. At the commonly used 30-meter cell size, a narrow stream, road, building, grass patch, and trees can occur within the same cell. Boise County’s steep valleys and narrow settlement corridors make that generalization important when the images are enlarged.
Zooming cannot create parcel-level detail that is absent from the source data. Field boundaries may look blocky, small roads can merge into surrounding surfaces, and narrow streams can appear simplified. Ownership, zoning, legal access, building permits, current road conditions, and wetland regulation require newer and more specialized records.
The current images represent the supplied 2025 observation year. Later wildfire, timber activity, vegetation recovery, construction, flooding, or other changes may not appear. The change product compares the 1985 and 2025 endpoints; it does not provide a complete year-by-year history between them.
Each original JPG measures 2480 × 1754 pixels. The dimensions suit screen viewing, documents, classroom handouts, and many presentation layouts, but the supplied asset manifest does not identify the files as meeting an A3 high-resolution reference. A proof print is advisable for a large poster, and the original aspect ratio should be preserved.
Contents of the original JPG package
The ZIP contains one original JPG for 2025 land cover, forest and farmland, impervious surface and developed land, and 1985–2025 land-cover change. The four files keep the current natural-cover pattern, hard-surface concentration, and endpoint differences separate so a specific Boise County location can be compared without reducing everything to a single composite.
Frequently Asked Questions
What is the largest land-cover class in Boise County?
Forest is the largest 2025 class at 45.72%, followed by shrubland at 33.79% and grassland at 16.93%. Forest is especially extensive through the center and south, while open shrub and grass cover becomes broader toward the northeast, east, and parts of the west.
Why do small western settlement areas stand out when developed cover is only 1.79%?
Development is concentrated rather than evenly spread. County planning materials identify communities such as Horseshoe Bend, Garden Valley, Idaho City, and Lowman, and the developed and impervious images show small clusters in the same broad parts of an otherwise forested and open-cover county.
Does the 28.30% endpoint difference mean that 28.30% of Boise County became developed?
No. Only 0.64% is listed as classified to developed. The total also includes 17.30% forest loss, 10.30% other class difference, and 0.04% agricultural loss, so it combines several types of classification difference.
Sources and Reference Data
- MRLC Annual NLCD Data – official access point for the 2025 land-cover and 1985–2025 comparison products
- USGS Annual NLCD Land Cover Classification – definitions for forest, shrubland, grassland, developed land, agriculture, wetlands, and other classes
- Boise County Comprehensive Plan 2024 Update – official county background on forests, mountains, communities, rivers, streams, and natural resources
- Boise County Planning and Zoning – county page linking the current comprehensive plan and land-use information
Map File Information
The ZIP contains four original JPG maps for comparing Boise County's 45.72% forest cover, 33.79% shrubland, very low impervious footprint, small settlement nodes, and 1985–2025 endpoint differences.
- Included Files: Four original JPG land-cover maps
- File Type: JPG files in one ZIP archive
- Intended Use: Printing, education, presentations, and map-based projects
Related Maps
Green Map creates custom-edited map images using open geographic data sources such as geoBoundaries, Natural Earth, OpenStreetMap, and government open data. These maps are edited visual materials, not raw data files, and are provided for education, documents, presentations, and graphic reference.