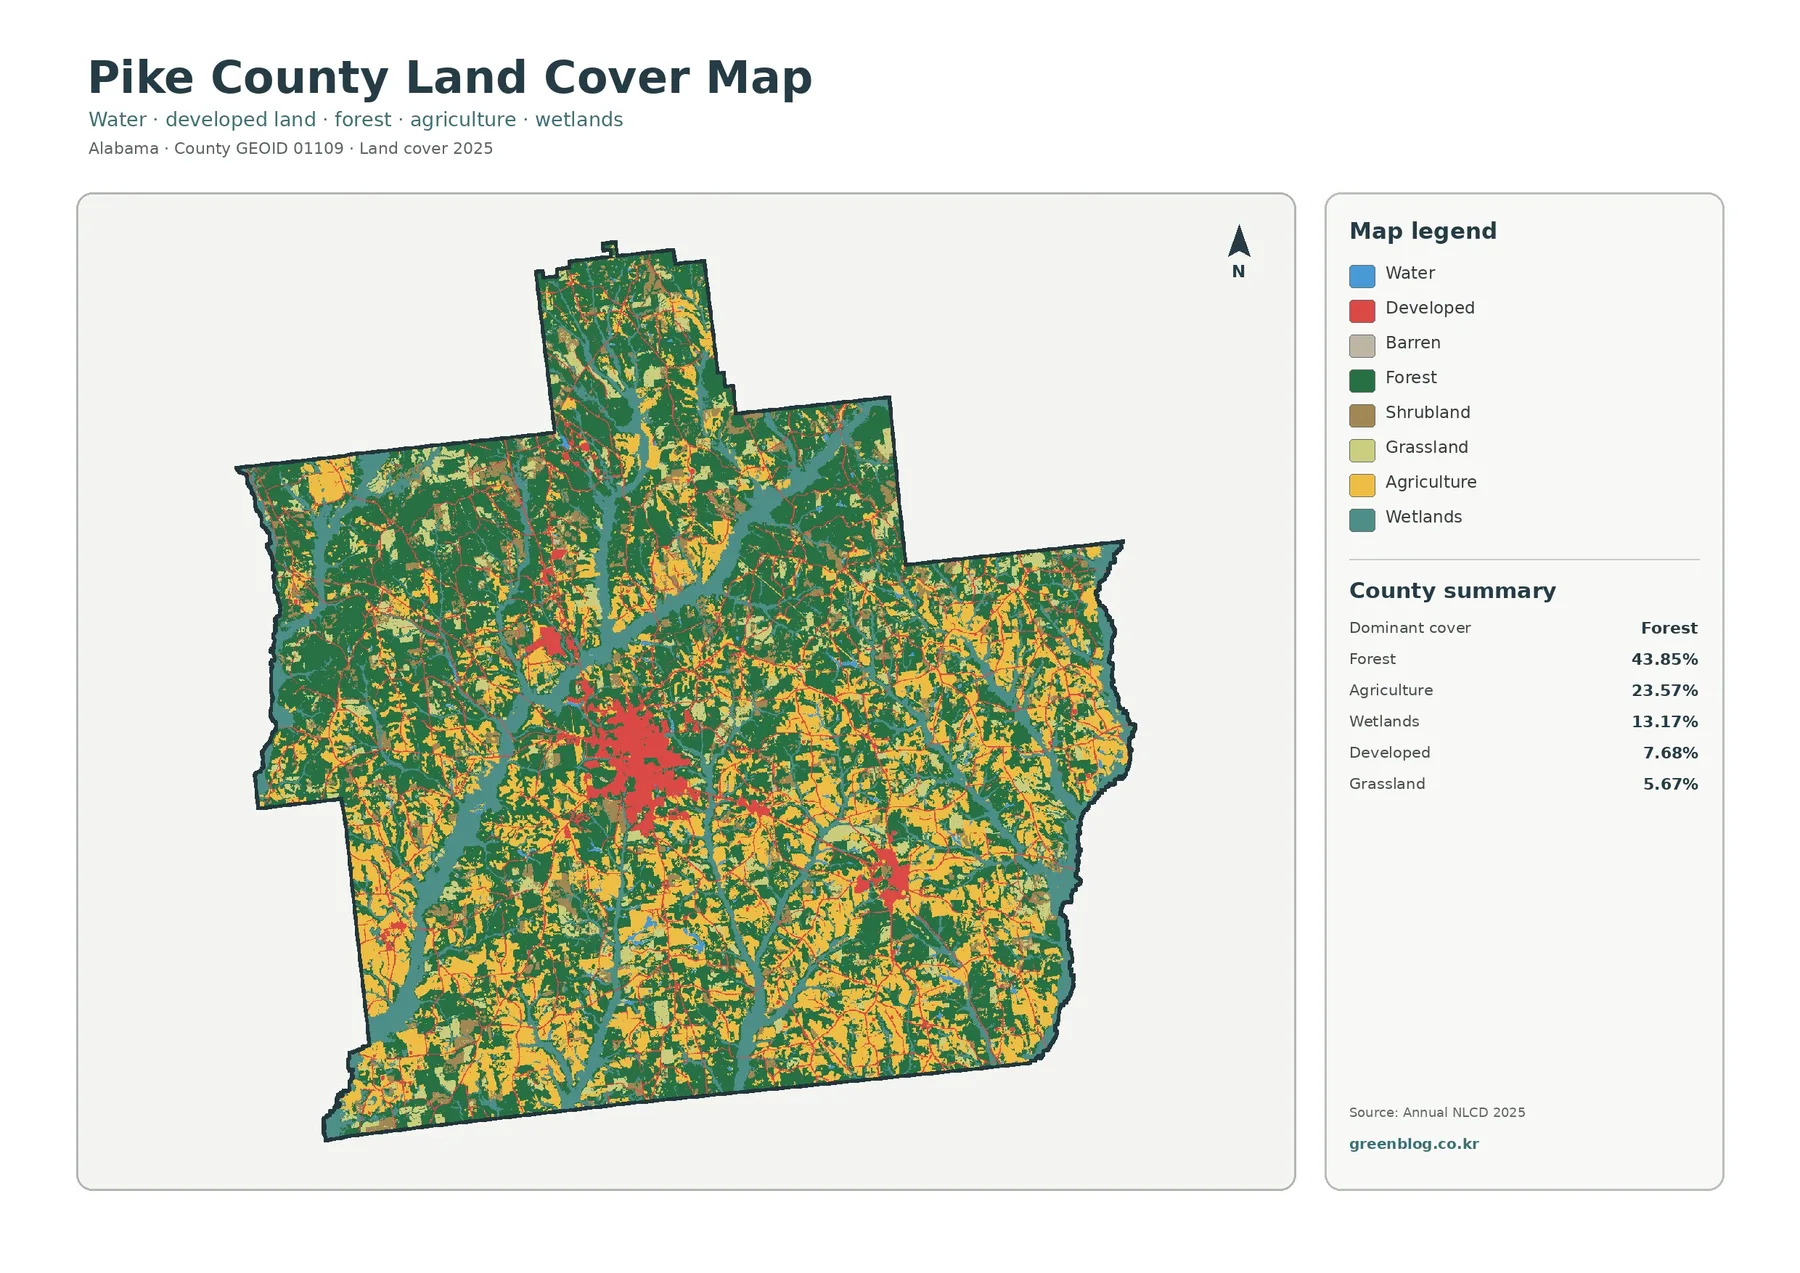
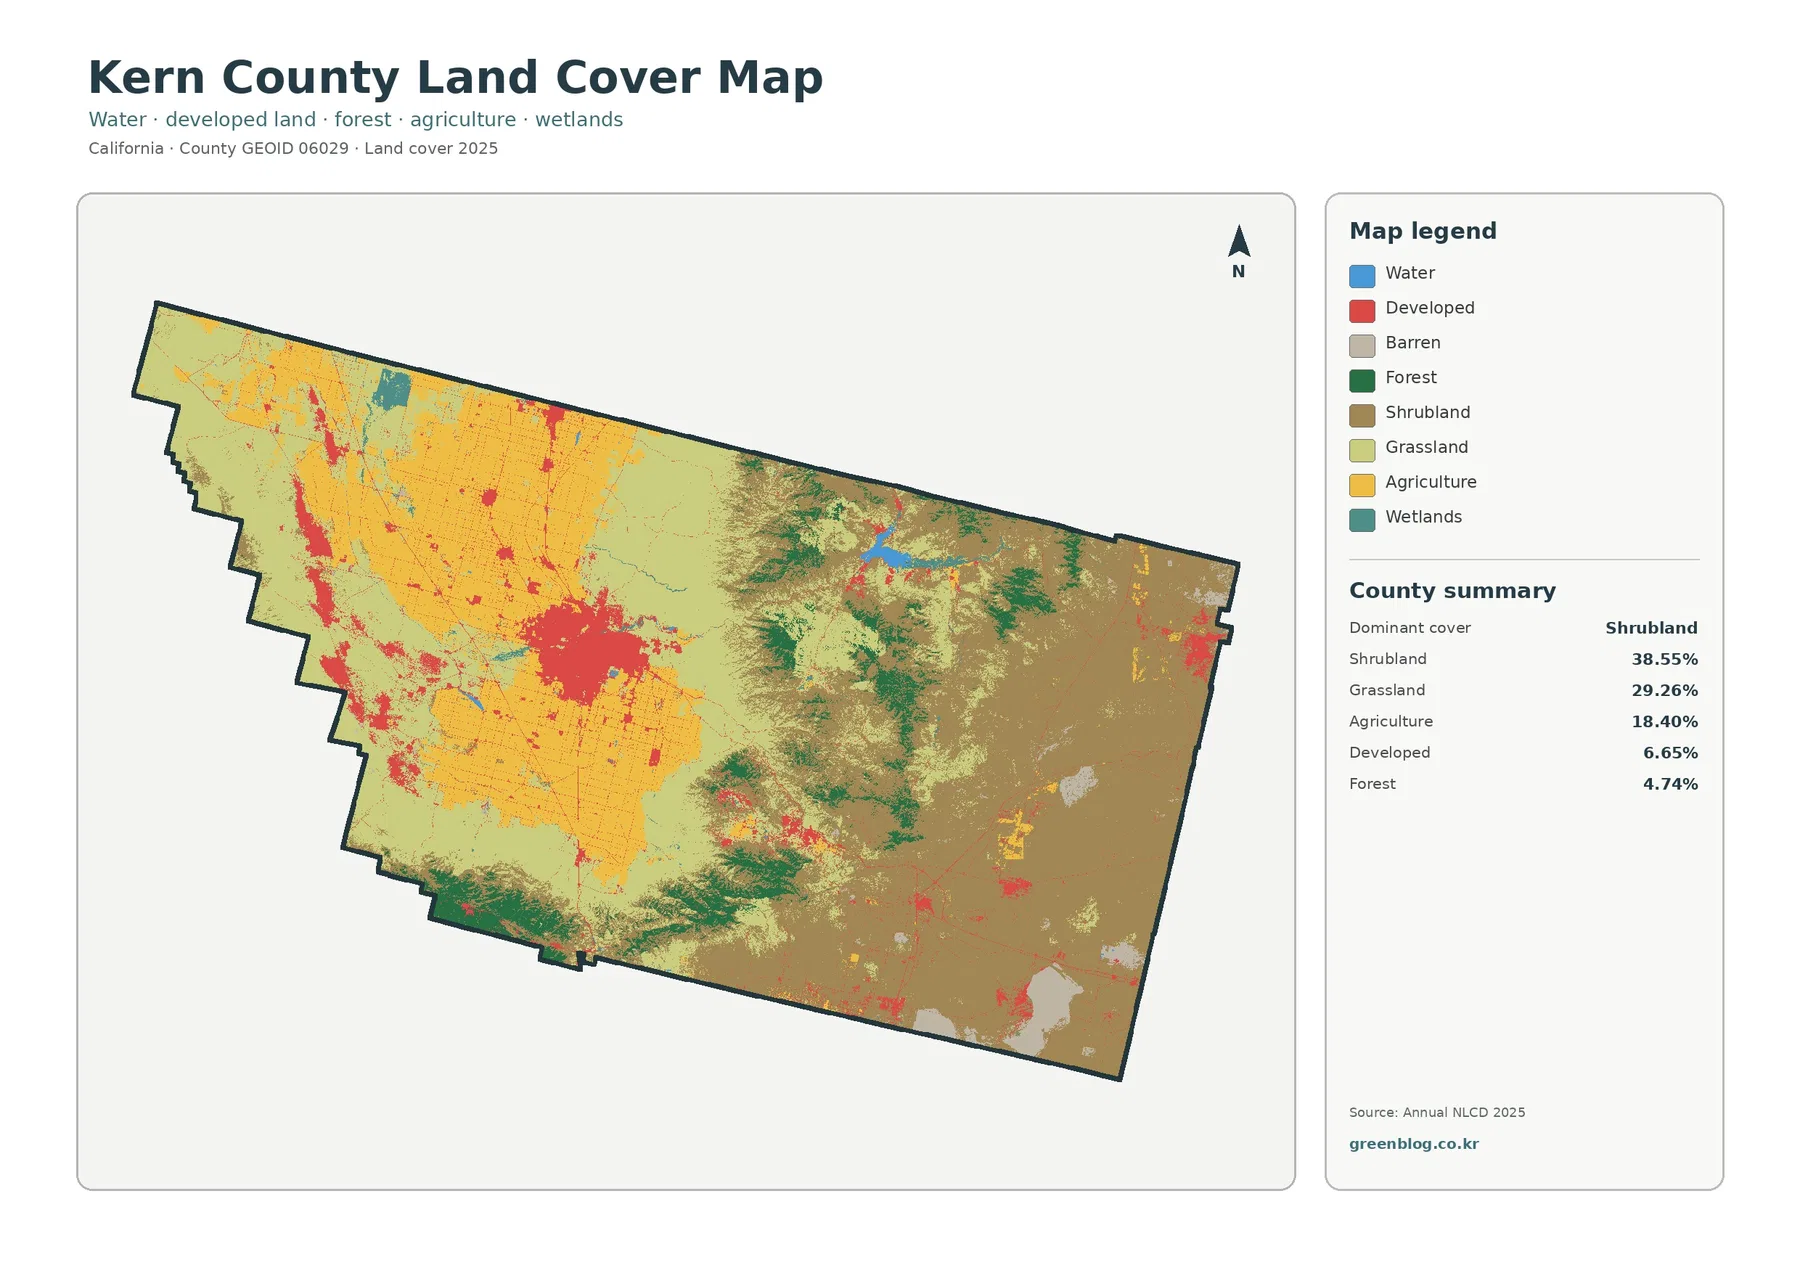
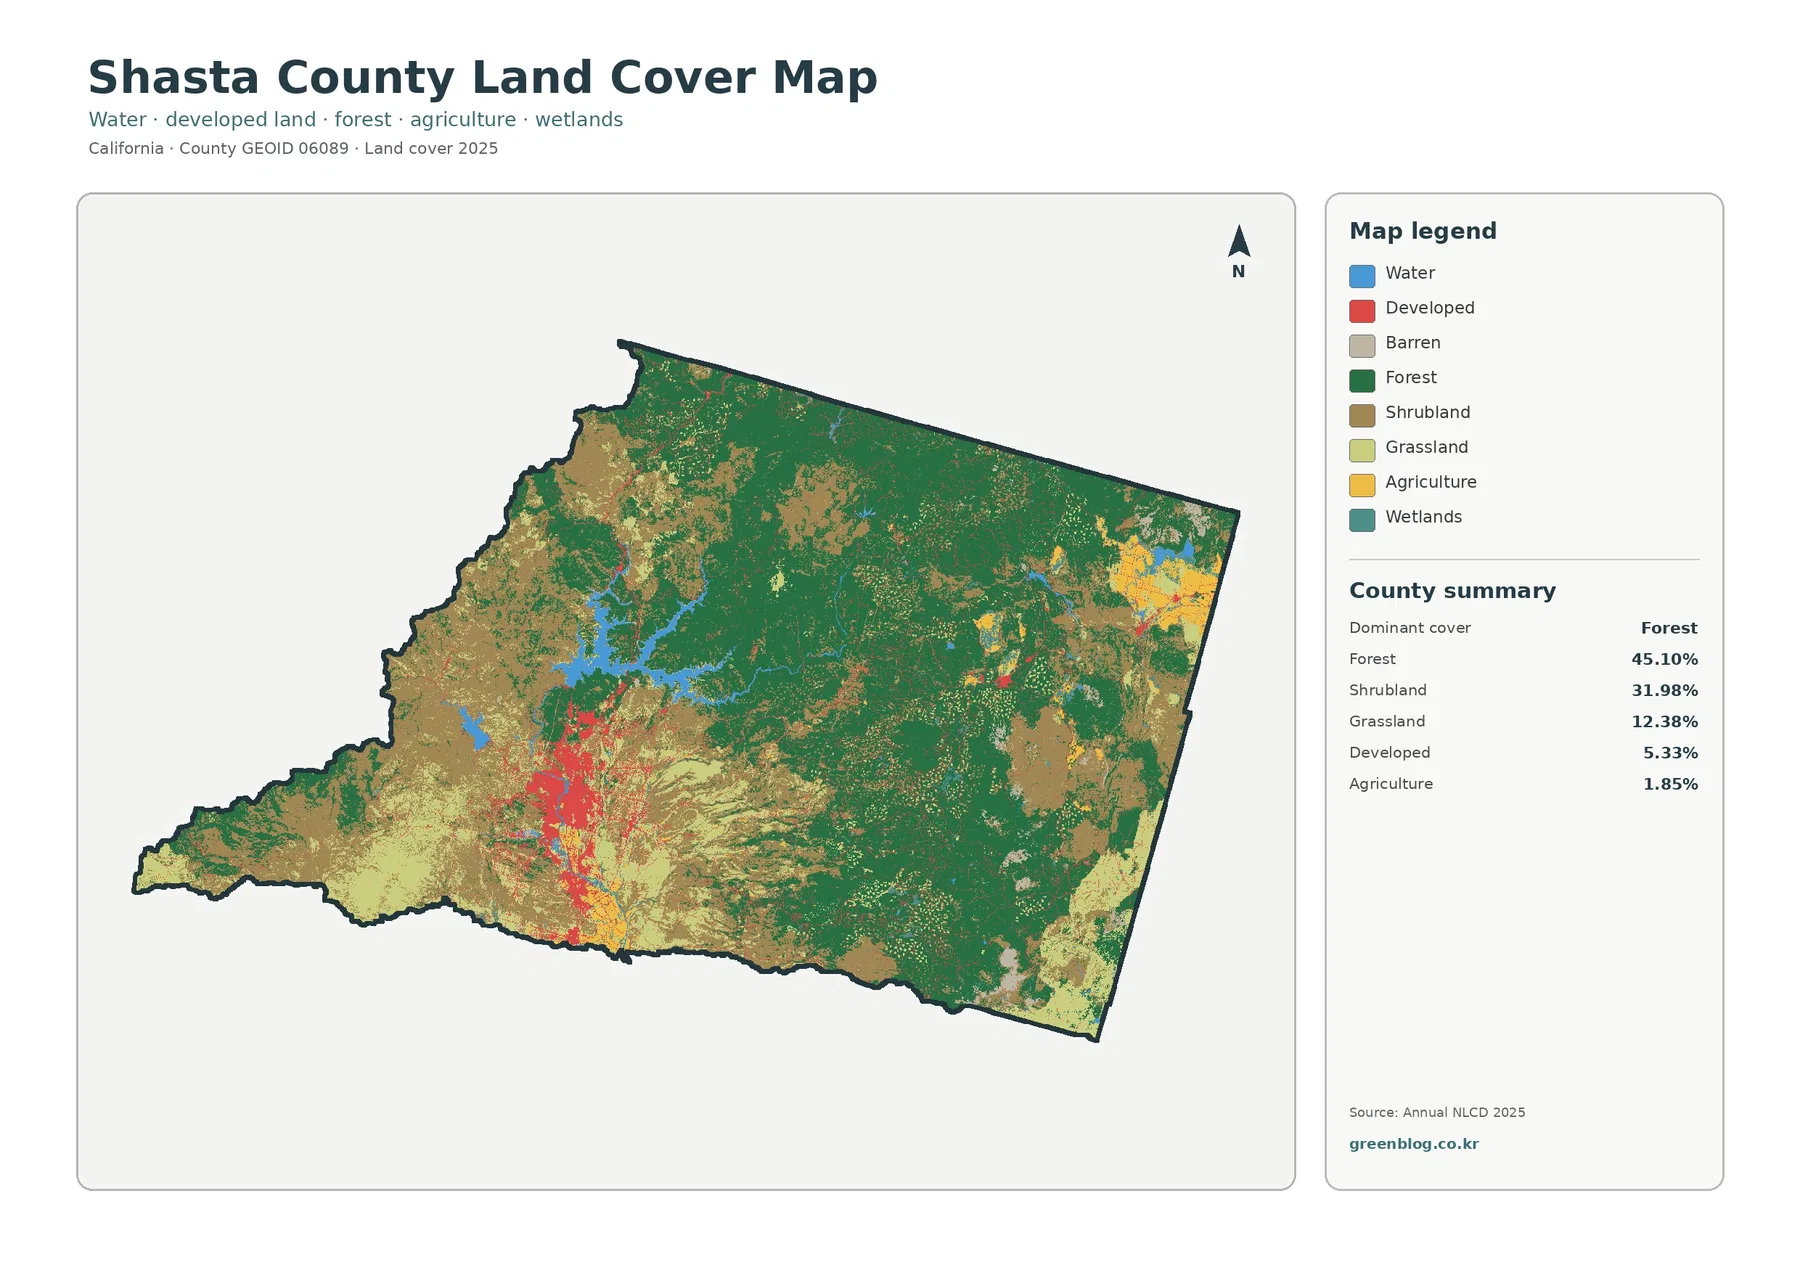
The Shasta County California Land Cover Map is dominated by natural cover rather than built land. Forest accounts for 45.10% of the supplied 2025 summary, followed by shrubland at 31.98% and grassland at 12.38%. Developed land is only 5.33% countywide, yet it forms a concentrated cluster around Redding. Shasta Lake creates the largest water feature in the interior, while agriculture appears in smaller, localized areas rather than across a broad farming plain.
This page compares four views using the same county boundary: 2025 land cover, forest and farmland, fractional impervious surface, and mapped class differences from 1985 to 2025. The article uses 1800 × 1273 WebP previews. A single download contains the four original 2480 × 1754 JPG maps, so the forested mountains, Fall River Valley agriculture, Redding-area hard surfaces, and long-term classification differences can be compared at a larger image size.
Table of Contents
Shasta County sits where the Sacramento Valley meets broad mountain cover
Shasta County’s official community description places the county at the northern end of the Sacramento Valley and emphasizes the transition into surrounding mountain ranges. That setting is visible in the 2025 land-cover layer. The Redding area occupies a comparatively open and developed part of the county, while large forest blocks spread across the north, east, and southeast. Western areas contain more shrubland and grassland mixed with forest, creating a less uniformly wooded appearance.
The county summary quantifies that contrast. Forest covers 45.10%, shrubland 31.98%, grassland 12.38%, developed land 5.33%, agriculture 1.85%, water 1.52%, and wetlands 1.03%. Barren land is also present in the legend, although the supplied summary does not give a separate percentage for it. These values describe surface cover in the 2025 classification; they do not describe ownership, zoning, public-land status, or the amount of land legally available for development.
| Forest, 2025 | 45.10% |
|---|---|
| Shrubland, 2025 | 31.98% |
| Grassland, 2025 | 12.38% |
| Developed, 2025 | 5.33% |
| Agriculture, 2025 | 1.85% |
| Water, 2025 | 1.52% |
| Wetlands, 2025 | 1.03% |
The general map gives those percentages geographic meaning. The strongest developed colors sit in the south-central portion of the county around Redding, with smaller extensions toward Anderson and the City of Shasta Lake. Forest becomes much more continuous outside that urbanized valley area. The northeast contains a distinct agricultural concentration, while Shasta Lake interrupts the forest with a large branching area of blue. Grassland and shrubland are especially important in the western and southern parts of the county, where the surface is not simply a continuous forest.
Shasta Lake breaks up a largely forested northern landscape
Water makes up 1.52% of the county summary, a small countywide share that still produces one of the most recognizable features on the map. Shasta Lake occupies a broad branching shape in the north-central part of the county. Its arms extend between wooded slopes, so the blue water is visually prominent even though water is far less extensive than forest or shrubland overall.
Shasta County’s Agriculture Department describes Shasta Dam as capturing water from the Sacramento, McCloud, and Pit Rivers to form Shasta Lake. That official context helps explain why the water body appears as a large multi-armed reservoir rather than a simple oval lake. The land-cover map does not show reservoir storage, water quality, depth, flood risk, or shoreline ownership, however. It should be used to locate surface-water cover in relation to the surrounding landscape, not as a hydrology or operations map.
The forest around the lake is equally important to the visual pattern. Large green areas continue to the east and north of the reservoir, while shrub and grass classes become more common toward other parts of the county. The water therefore acts as a strong geographic reference point when comparing the four maps: once Shasta Lake is located, readers can more easily match the forested north, the Redding urban area to the south, and the agricultural high valleys farther east.
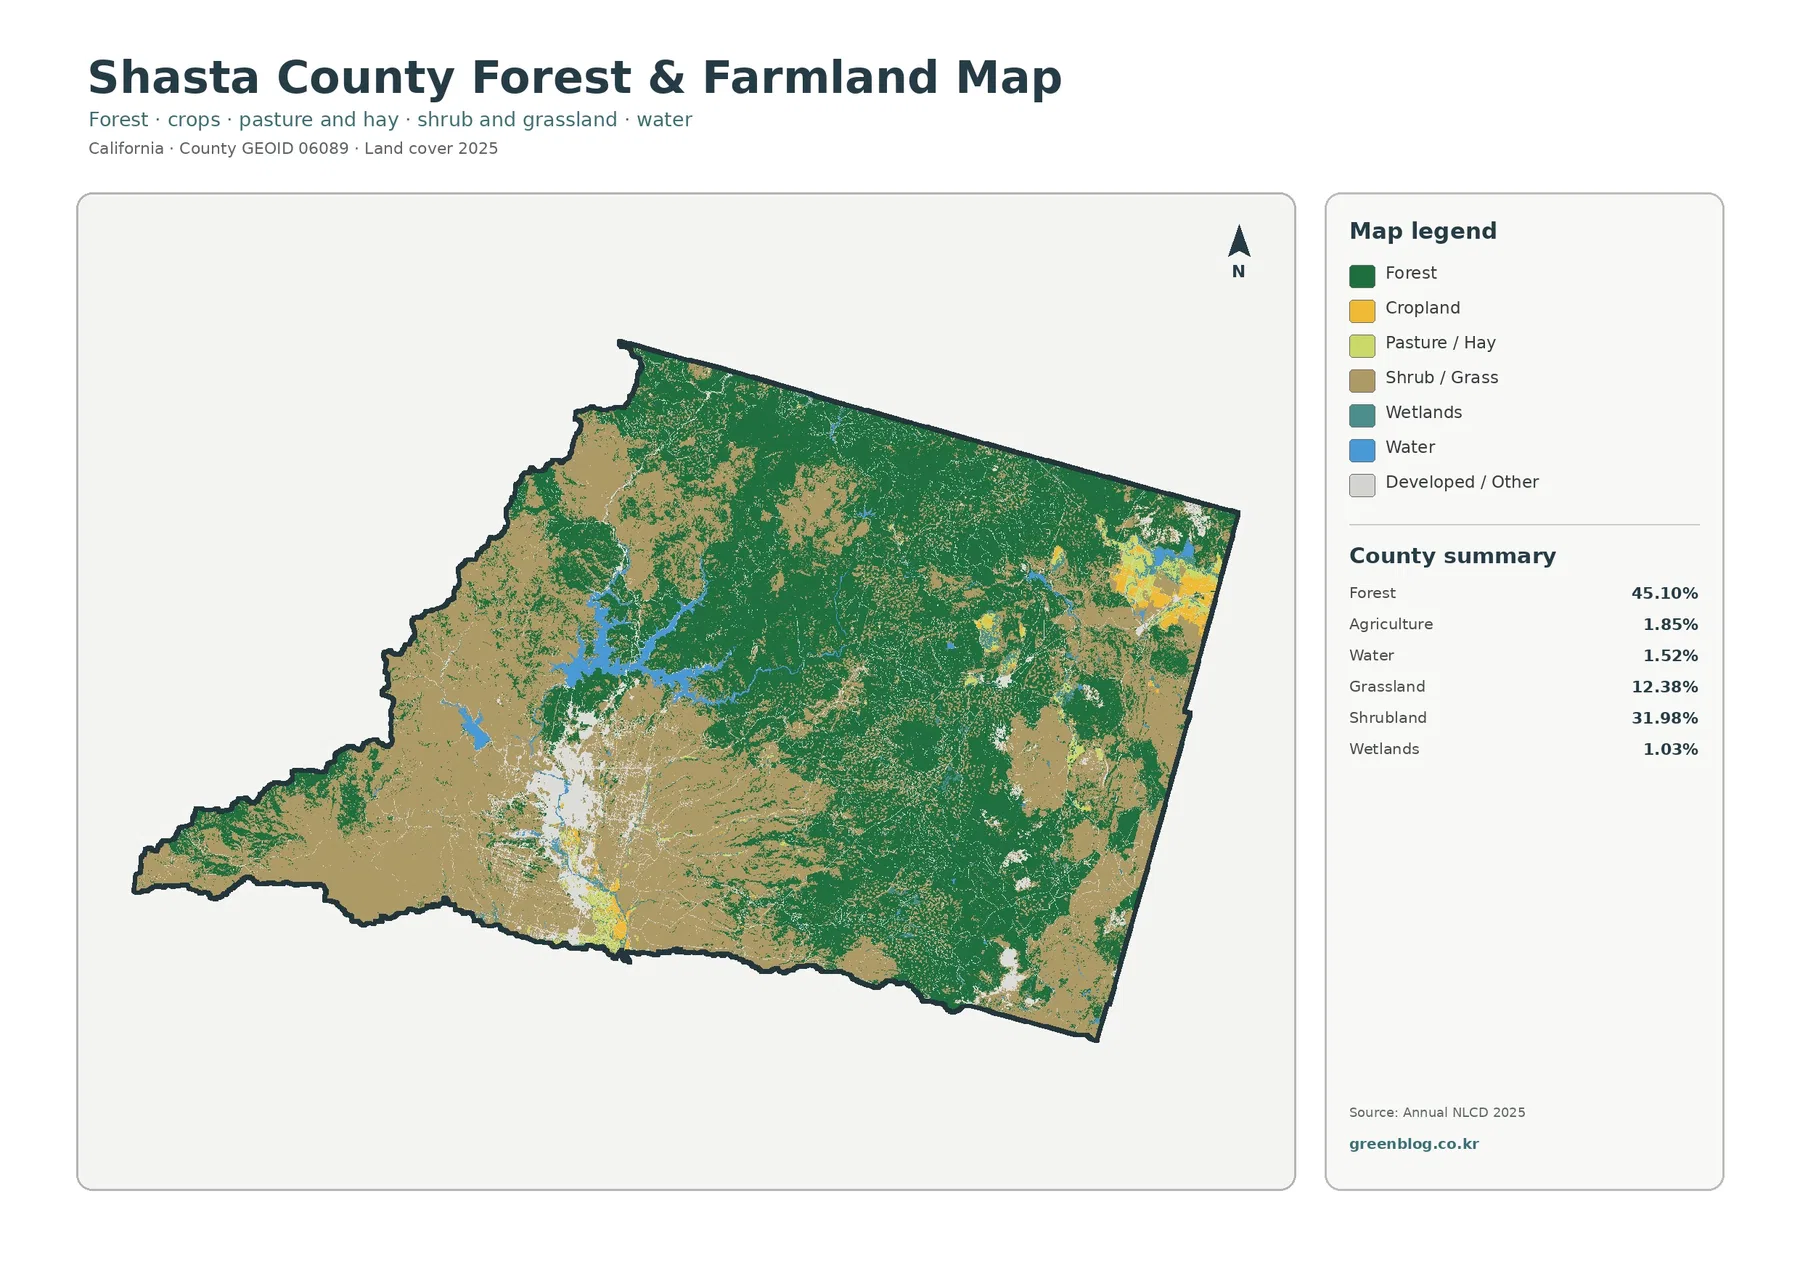
Fall River Valley agriculture becomes much clearer in the simplified forest-and-farmland view
Agriculture represents only 1.85% of the county in the supplied 2025 summary. That percentage can seem insignificant until the forest-and-farmland map is viewed spatially. Most of the county remains green forest or tan shrub-and-grass cover, but a conspicuous yellow agricultural area appears in the northeast. The location aligns with Fall River Valley, a recognized agricultural area around communities such as Fall River Mills and McArthur.
Shasta County’s Agricultural Commissioner describes growing up on a farm outside McArthur in Fall River Valley, where cattle ranching and hay farming are part of the local agricultural setting. County agriculture material also discusses hay and other crops in the higher valleys. Those sources do not change the NLCD percentage; instead, they explain why a relatively small countywide agricultural share can still have a strong local presence in one valley.
The same map also prevents open land from being mistaken for farmland. Shrub and grass classes cover 44.36% when their two supplied percentages are considered together, far more than agriculture. Large tan areas in the west and south are therefore not automatically agricultural fields. Yellow cropland or pasture-related classes identify the areas classified as agriculture in the map, while shrub and grass describe different surface cover.
Nor does the yellow classification define farm parcels. A 30-meter raster cell can contain vegetation, a road, a farm building, bare soil, and other features. The map generalizes that mixture into a land-cover category. Property ownership, Williamson Act status, agricultural zoning, crop type, irrigation rights, and exact field boundaries require separate county or agricultural records.
Redding forms a concentrated hard-surface cluster in an otherwise low-impervious county
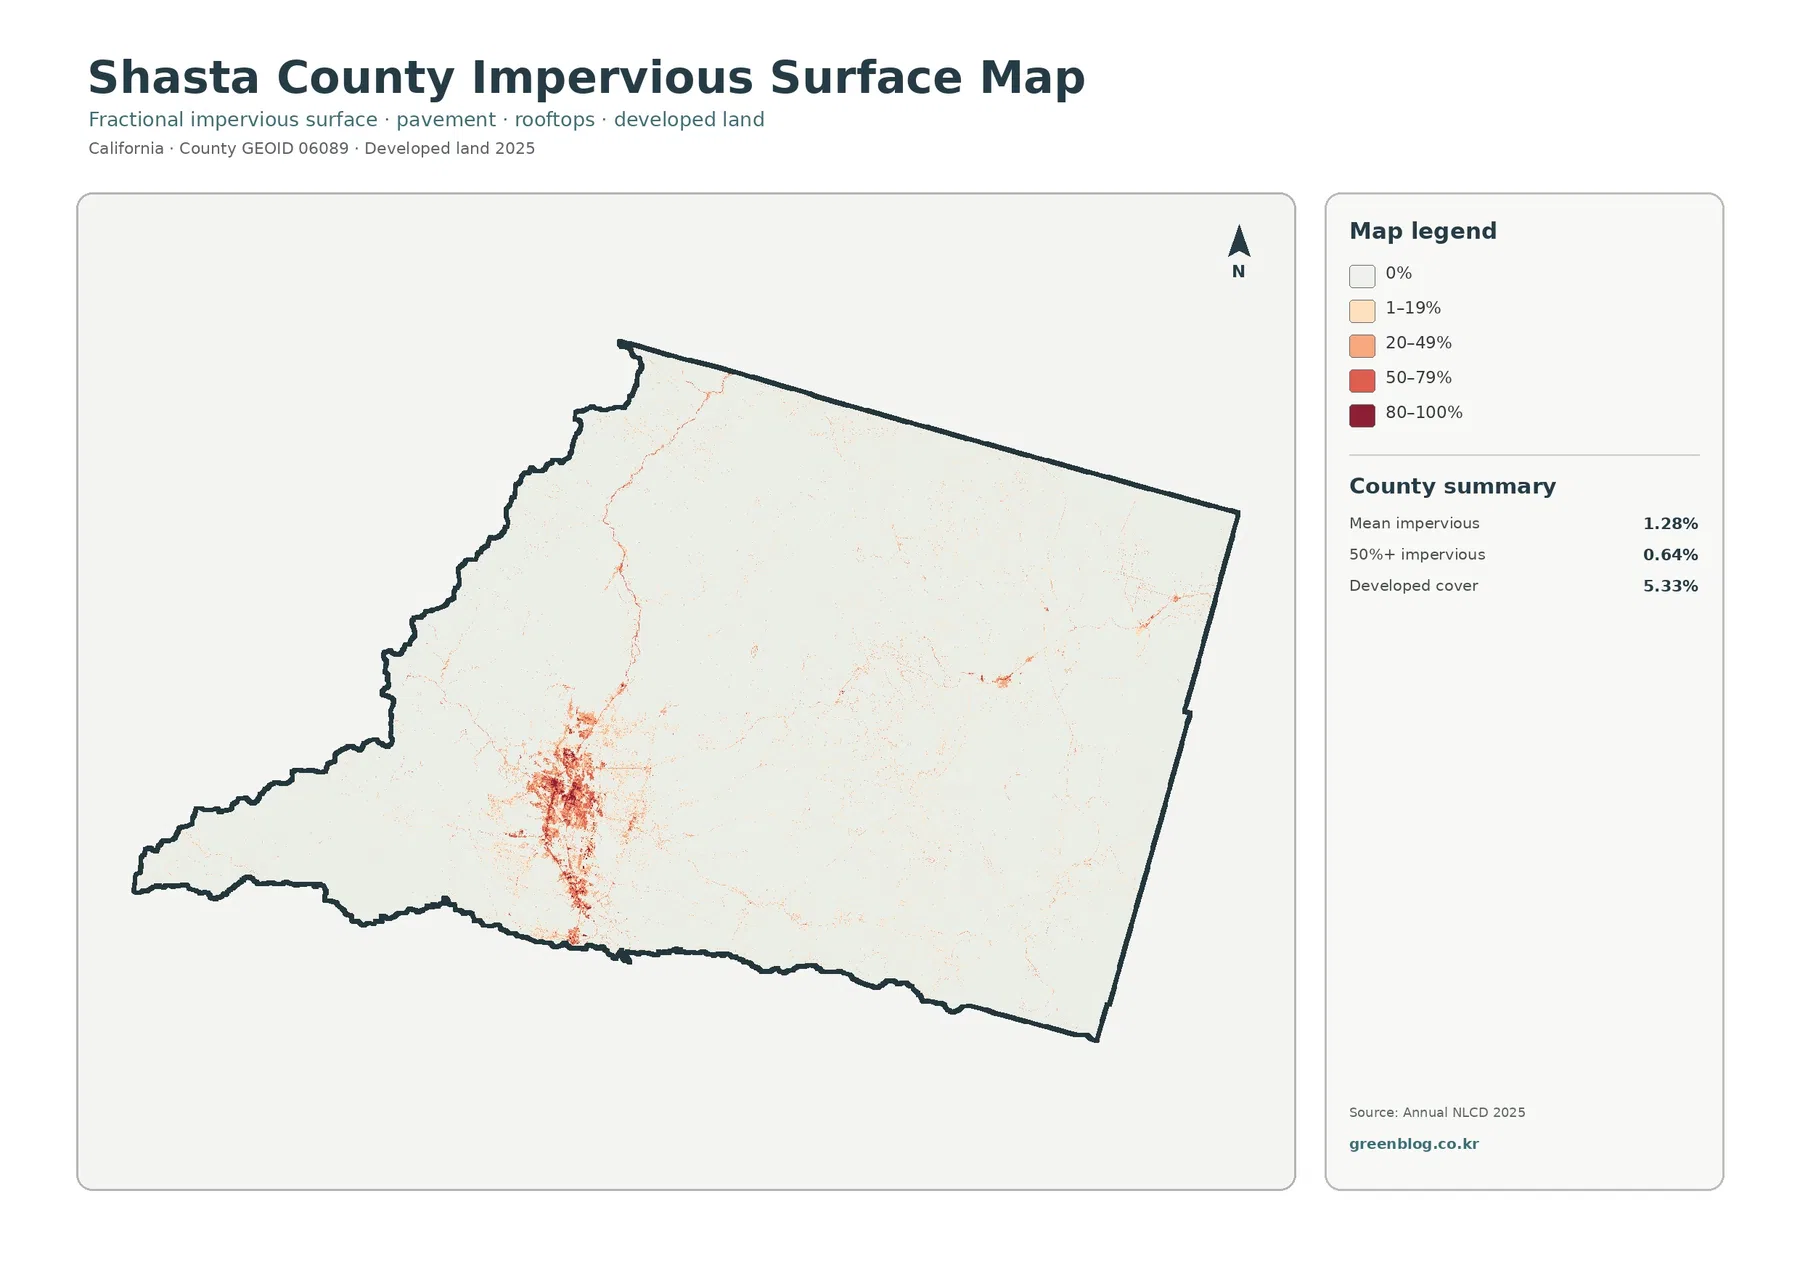
Fractional impervious surface measures the share of each 30-meter cell covered by constructed materials such as pavement and rooftops. Shasta County’s mean impervious value is 1.28%, and only 0.64% of the county falls in cells that are at least 50% impervious. Those numbers are low compared with heavily urban counties, but the map reveals a clear local concentration around Redding.
The dense red and orange pattern is strongest in the Redding urban area. Smaller linear and clustered areas continue toward Anderson to the south and Shasta Lake to the north. The official Shasta County community reference map places Interstate 5 through this same north-south valley corridor. The overlap is useful for orientation, but it should not be turned into a causal claim: this land-cover product shows where hard surfaces and developed areas are concentrated, not why individual development decisions occurred.
Developed cover is 5.33%, which is substantially higher than the 1.28% countywide mean impervious surface. The difference is expected because the measurements describe different things. A developed land-cover class can include trees, yards, landscaped areas, soil, drainage features, and other permeable surfaces along with buildings and pavement. Fractional impervious surface isolates the hard or constructed portion within each cell instead of assigning one categorical land-cover label.
This layer is useful for comparing the compact Redding footprint with the much less built eastern and northern county. It is not a stormwater model, flood map, road inventory, building-footprint database, or parcel-development map. A cell with high impervious percentage indicates a concentration of hard surface at the product’s scale; it does not supply drainage capacity, ownership, building age, or legal development status.
The 1985–2025 map identifies class differences, not the cause of every landscape change
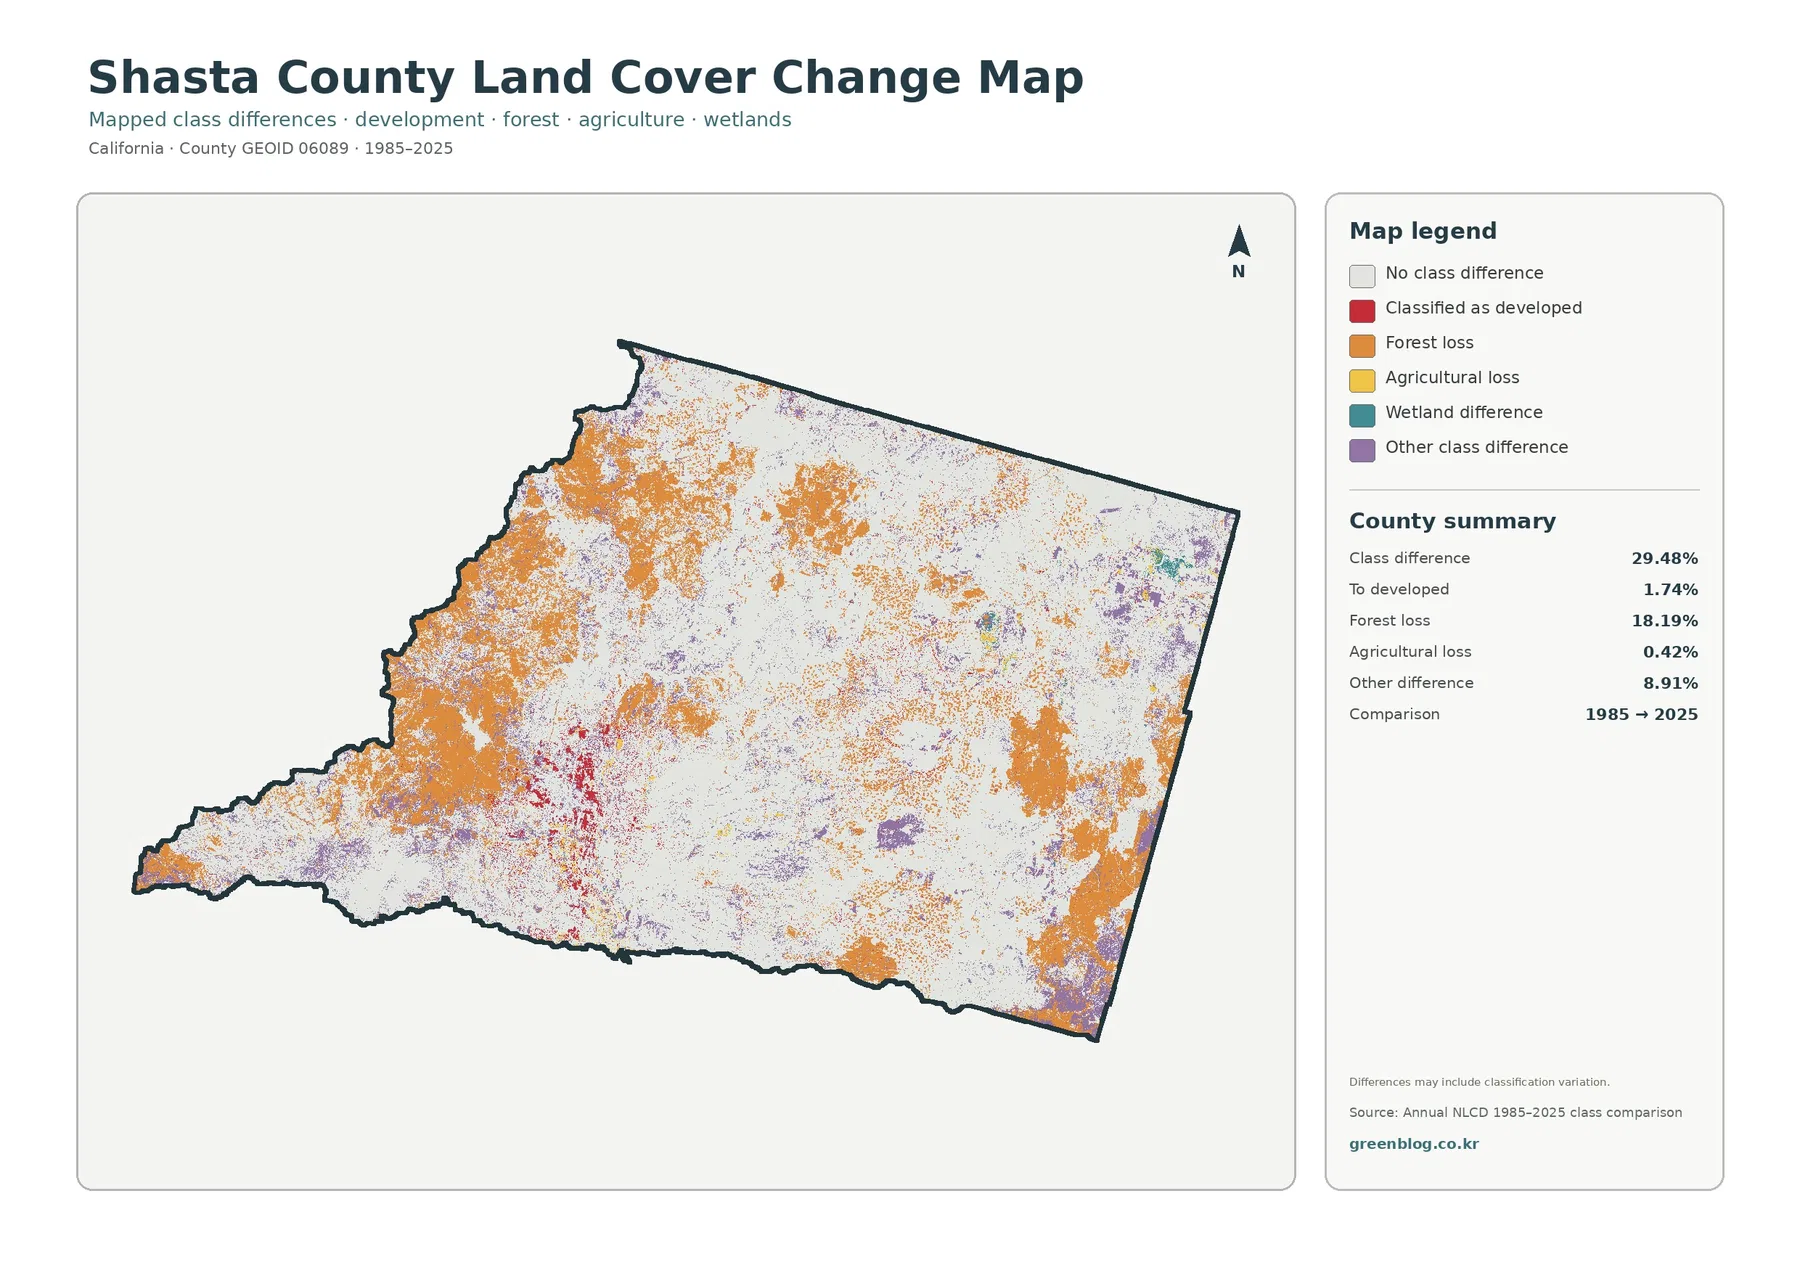
The historical comparison marks a class difference across 29.48% of the county. The supplied summary breaks that total into 1.74% classified as developed, 18.19% forest loss, 0.42% agricultural loss, and 8.91% other class difference, with additional wetland-related differences shown in the legend. The large forest-loss category is the most visually extensive part of the map, especially across western and several eastern mountain areas.
Red cells associated with a transition to developed land are much more localized and are concentrated around the Redding area. Orange forest-loss cells spread far beyond the urban footprint, while purple other-difference areas occur in scattered patches. This makes the map useful for separating a compact development signal from much broader natural-cover classification changes.
It is essential not to label the 18.19% forest-loss value as confirmed deforestation. The map itself warns that differences may include classification variation. A cell can move from forest to shrub or grass after fire, vegetation disturbance, succession, or a change in the way the surface was classified. Image conditions, recovery timing, and genuine land conversion can also contribute. Determining the cause requires fire history, aerial imagery, vegetation records, forestry information, or field evidence.
The 1.74% transition to developed land deserves the same caution. It means those cells are classified as developed in 2025 relative to the 1985 comparison, not that all construction occurred in a single period or for one reason. The map does not contain permit dates, subdivision records, annexations, road projects, or zoning decisions. It is a screening and comparison graphic rather than a legal history of development.
Land cover should not be confused with Shasta County zoning or property records
The visual similarity between a land-cover map and a planning map can be misleading. A developed class describes the observed surface, while zoning and the General Plan describe legal or policy designations. Shasta County’s Planning Division maintains separate General Plan, zoning, parcel, and related GIS layers. A green forest cell can be private property, public land, or another legal category; a developed cell can fall under many different zoning designations.
Annual NLCD Collection 1.2 is produced at 30-meter spatial resolution. In practical terms, the surface is divided into square raster cells about 30 meters across, and each cell receives a class or fractional value. That resolution works well for county-scale comparisons, but a narrow creek, small building, field edge, driveway, or property boundary may be generalized. Mixed pixels are especially important where forest, roads, yards, and structures occupy the same cell.
For environmental education or a broad planning presentation, the four maps can be combined effectively. The general map establishes the 2025 landscape, the forest-and-farmland map isolates the Fall River Valley agricultural concentration, the impervious layer reveals the compact Redding hard-surface footprint, and the change map locates long-term classification differences. Because the four maps use the same county outline, the viewer can compare positions without learning a new geographic frame for each subject.
Site-specific decisions require a different level of evidence. These images do not provide assessor parcel numbers, owners, legal access, building permits, surveyed lines, wildfire severity, flood zones, wetland jurisdiction, timber-harvest approvals, or current crop information. They are best treated as geographic reference graphics that point to patterns worth investigating with the appropriate official dataset.
The observation date also matters. The land-cover, forest-and-farmland, and impervious views represent 2025 classifications, while the change map compares 1985 with 2025. Fire, regrowth, construction, restoration, or agricultural changes after 2025 are not represented. When current conditions matter, pair these images with newer aerial photography and Shasta County or agency records.
Download the four original Shasta County JPG maps
The general land-cover JPG is the best starting point for a broad 2025 overview. Use the forest-and-farmland file when the distinction between mountain forest and agricultural valleys is the main subject. The impervious map is more useful for a discussion of Redding-area pavement and rooftops, while the 1985–2025 file is designed for locating classification differences across time. The shared county boundary makes the set suitable for side-by-side comparison in reports, lessons, presentations, and reference graphics.
Each original image is 2480 × 1754 pixels. The asset manifest does not mark these files as meeting its A3 high-resolution reference, so test the legend and small labels at the intended print size before producing a large print run. The ZIP contains JPG images only. It does not include vector artwork, GIS layers, parcel data, or the editable project files used to create the maps.
Frequently Asked Questions
Does 45.10% forest mean nearly half of Shasta County is legally designated forest land?
No. The 45.10% value is the share classified as forest in the supplied 2025 Annual NLCD map. Public forest, private timberland, parks, zoning, conservation areas, and property ownership are separate legal or management categories. Shasta County planning and land records are needed for those questions.
Why is Fall River Valley easy to see if agriculture is only 1.85% countywide?
The percentage uses the entire large county as its denominator. Agricultural cover is concentrated rather than evenly distributed, so a small countywide share can form a clearly visible local patch. Shasta County agricultural sources identify Fall River Valley and the McArthur area with hay and cattle farming, which is consistent with the concentrated agricultural pattern in the northeast.
Is the 18.19% forest-loss category proof that 18.19% of the county was deforested?
No. It means cells classified as forest in 1985 are classified differently in 2025. The supplied change map explicitly notes that classification variation may be included. Fire, vegetation succession, disturbance, regrowth timing, mapping differences, and permanent conversion can all require separate evidence before a cause is assigned.
Map File Information
The ZIP contains one original JPG for each of the four Shasta County views discussed on this page: 2025 land cover, forest and farmland, impervious surface, and 1985–2025 land-cover change. Every image is 2480 × 1754 pixels.
- Included Files: 2025 land cover · Forest and farmland · Impervious surface · 1985–2025 land-cover change
- File Type: Four JPG files in one ZIP archive
Related Maps
- Alameda County California Land Cover Map
- Alpine County California Land Cover Map
- Amador County California Land Cover Map
Sources and Reference
The percentages and mapped patterns discussed above come from the supplied Annual NLCD-based map images. These official sources provide the product definitions, 30-meter resolution information, and county-specific geographic, planning, and agricultural context used to interpret those maps.
- MRLC Annual NLCD Data — access and documentation for Annual NLCD products.
- USGS Annual NLCD Collection 1.2 Land Cover — documentation for the 2025 release and 30-meter land-cover product.
- Shasta County: About Shasta County — official county overview of Redding, Anderson, Shasta Lake, valleys, mountains, and natural resources.
- Shasta County General Plan — county planning material covering agriculture, timberlands, water, habitat, open space, and development policy.
- Shasta County Agriculture / Weights & Measures — county agricultural information and local farming resources.
Green Map creates custom-edited map images using open geographic data sources such as geoBoundaries, Natural Earth, OpenStreetMap, and government open data.
These maps are edited visual materials, not raw data files, and are provided for education, documents, presentations, and graphic reference.