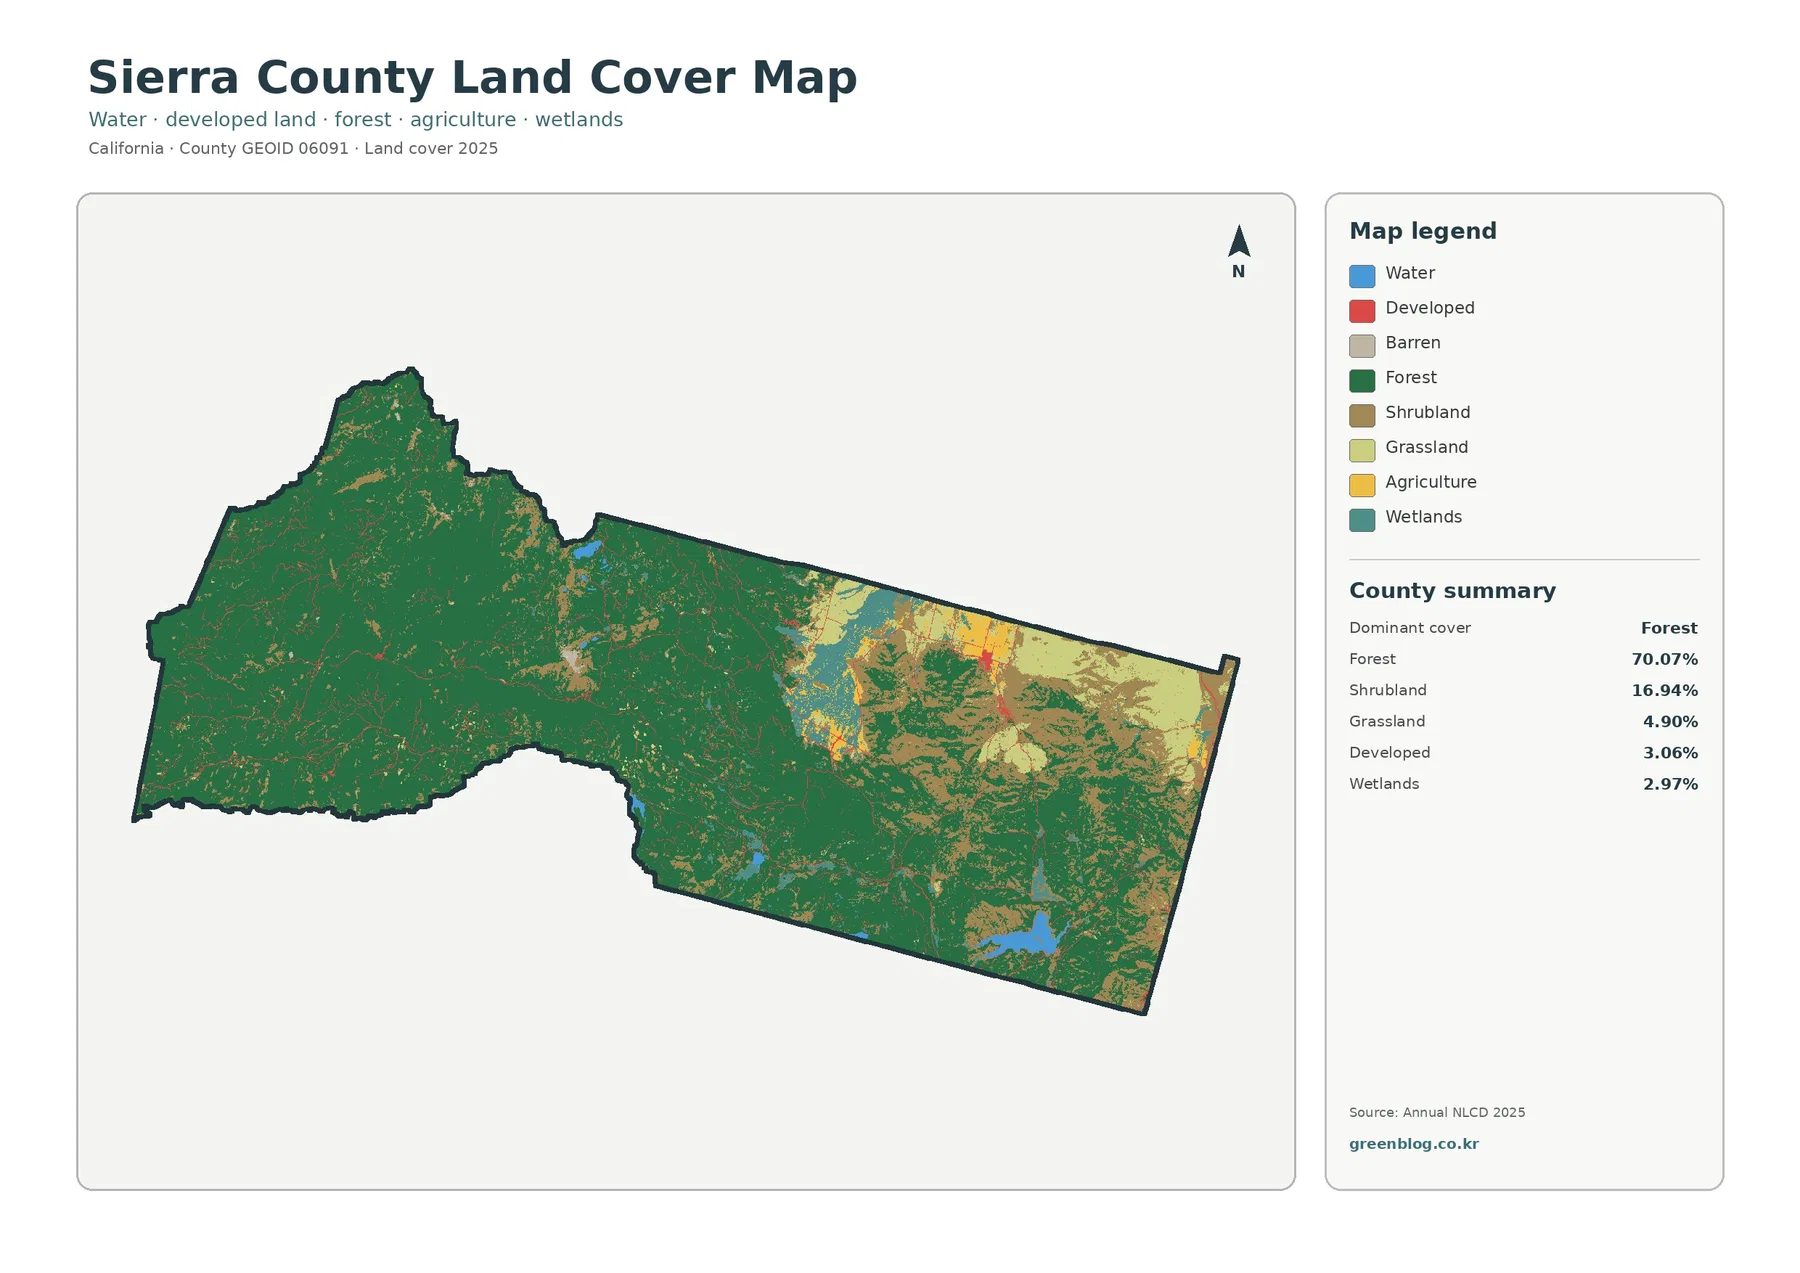
The Sierra County California Land Cover Map is dominated by forest, but the county does not look uniform from west to east. Forest accounts for 70.07% of the 2025 summary, while the eastern part of the county contains much larger areas of shrubland, grassland, wetlands, and other open cover. This page compares that broad pattern across land cover, forest and farmland, impervious surface, and 1985–2025 change maps.
The WebP images in the article are quick previews. A single download contains the four original 2480×1754 JPG maps, which can be used for reference, classroom work, reports, presentations, or side-by-side comparison without relying on the smaller web previews.
Table of Contents
A Forested Western County That Opens Toward Sierra Valley
The countywide land-cover view has a strong west-to-east contrast. Dark green forest covers most of the western and central portions of Sierra County, often in broad connected areas. Farther east, tan shrubland and pale grassland become much more prominent, and the forest breaks into smaller patches. Wetlands and blue water features also stand out more clearly in and around the open eastern landscape.
The 2025 summary puts numbers behind that visual contrast. Forest is the leading class at 70.07%, followed by shrubland at 16.94% and grassland at 4.90%. Developed cover is only 3.06%, while wetlands account for 2.97%. Those countywide percentages are useful, but the map is more informative when the figures are tied to location: the heavily wooded west contributes most of the forest total, while the long eastern extension contains a noticeably different mix of open cover.
Sierra County’s official General Plan describes a rugged county shaped by the high Sierra, forests, watersheds, Sierra Valley and Long Valley, along with the Little Truckee, Feather, Downie, and Yuba river systems. That local description helps explain why a single county can contain both extensive mountain forest and broad open valley landscapes. The land-cover map, however, classifies what is on the surface. It does not show legal zoning, ownership, or parcel boundaries.
Forest, Sierra Valley, and the County’s Small Agricultural Share
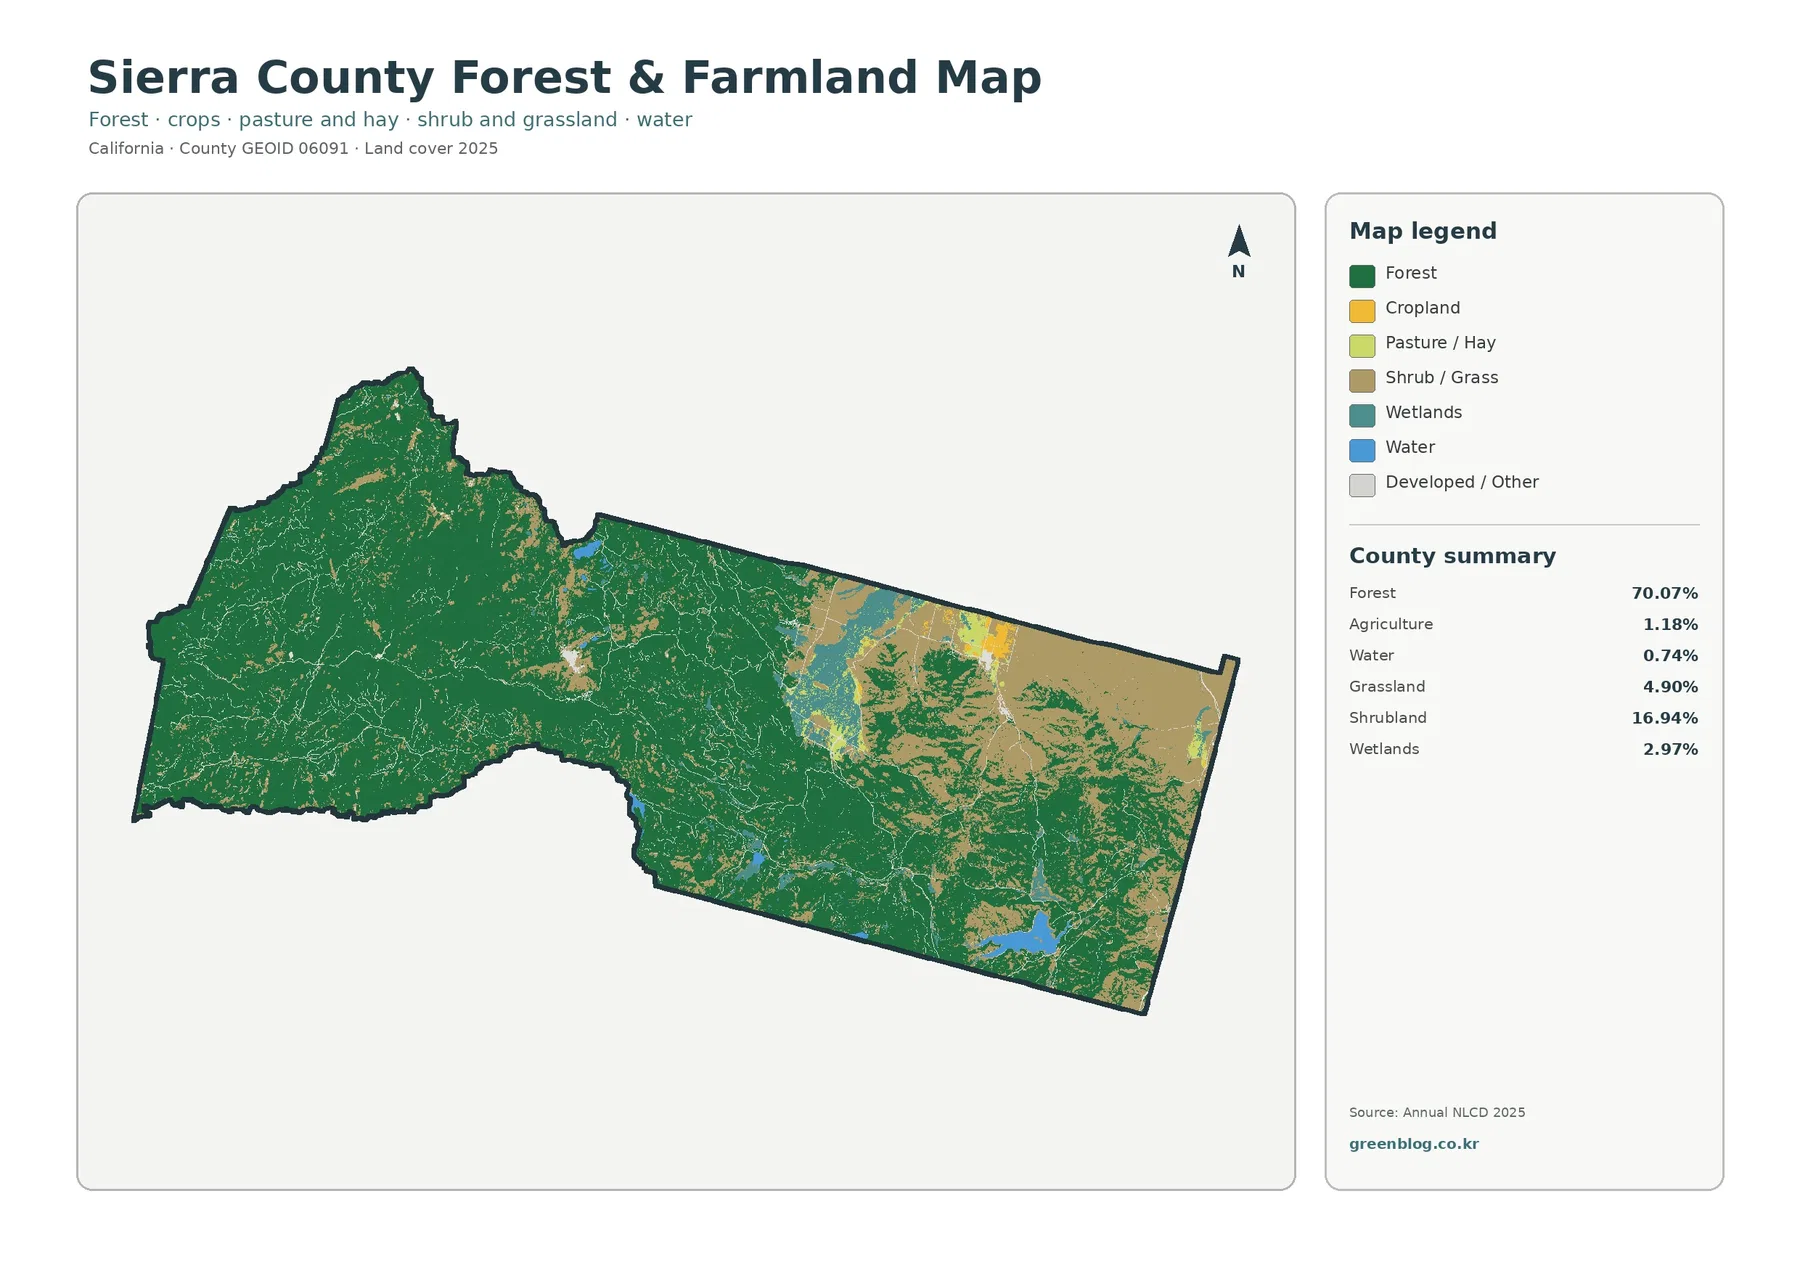
The forest-and-farmland map removes some of the competing land-cover colors and makes the county’s natural-versus-open pattern easier to follow. The western half remains overwhelmingly green, while the eastern section contains large shrub and grass areas. Agriculture is present, but its countywide share is only 1.18%. It appears as relatively small patches within the more open eastern landscape rather than as a continuous farm belt across the county.
This distinction matters because an open-looking area is not automatically farmland. Shrubland alone covers 16.94% of Sierra County and grassland adds another 4.90%, both far larger than the mapped agricultural share. Sierra County planning materials identify Sierra Valley and Long Valley as important agricultural settings, but the map still requires the legend to separate cropland or pasture-related classes from surrounding shrub and grass cover.
Wetlands account for 2.97% and water for 0.74% on the forest-and-farmland summary. They occupy a small percentage of the county, yet they are visually important because they interrupt the forest and open-land colors in several places. The General Plan’s emphasis on rivers, streams, watersheds, and the mountain landscape provides useful local context, but this image is not a hydrography map. It is best used to compare water and wetland cover with nearby forest, shrubland, grassland, and agricultural areas.
Very Little Impervious Surface Outside Small Settlement Corridors
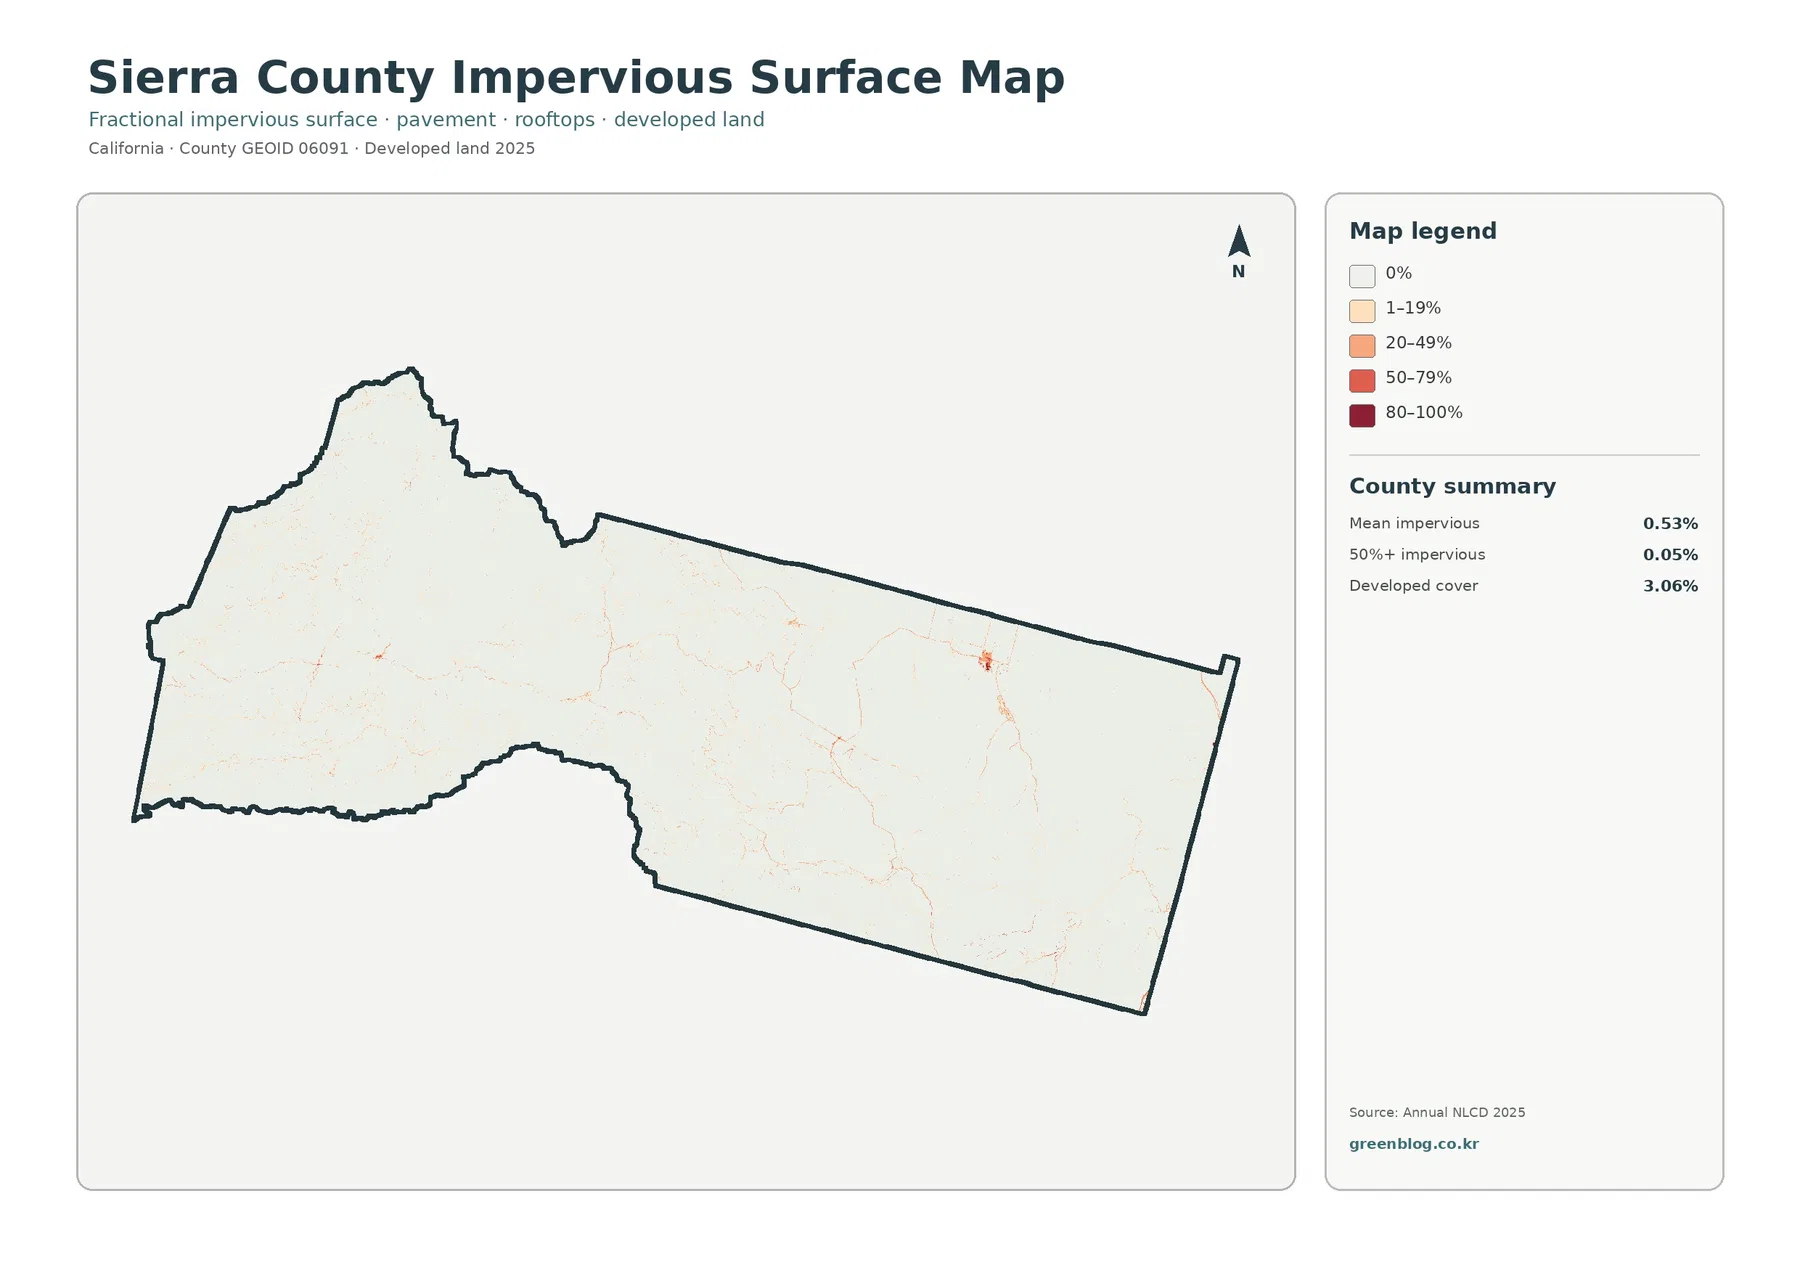
Impervious surface means pavement, rooftops, and other surfaces that do not readily absorb water. On this map, almost all of Sierra County is pale, indicating zero or very low impervious cover. The countywide mean is only 0.53%, and areas with at least 50% impervious surface make up just 0.05% of the county. Strong orange or red values appear only as small clusters and narrow lines.
That pattern fits the separate 3.06% developed-cover figure, but the two numbers measure different things. A developed land-cover class may still contain vegetation, especially in low-density areas. The impervious product measures the fraction of a 30-meter cell that is covered by hard surfaces. A place can therefore be classified as developed without being mostly pavement or rooftops.
Sierra County’s General Plan discusses small communities such as Downieville, Loyalton, Sierraville, and Sierra City within a much larger landscape of forest and valleys. The impervious map does not draw the municipal or community boundaries, yet it makes the limited footprint of built surfaces easy to see. The brighter spots identify places where roads and buildings are more concentrated relative to the surrounding county, while most of the map remains nearly uncolored.
What the 1985–2025 Change Map Really Measures
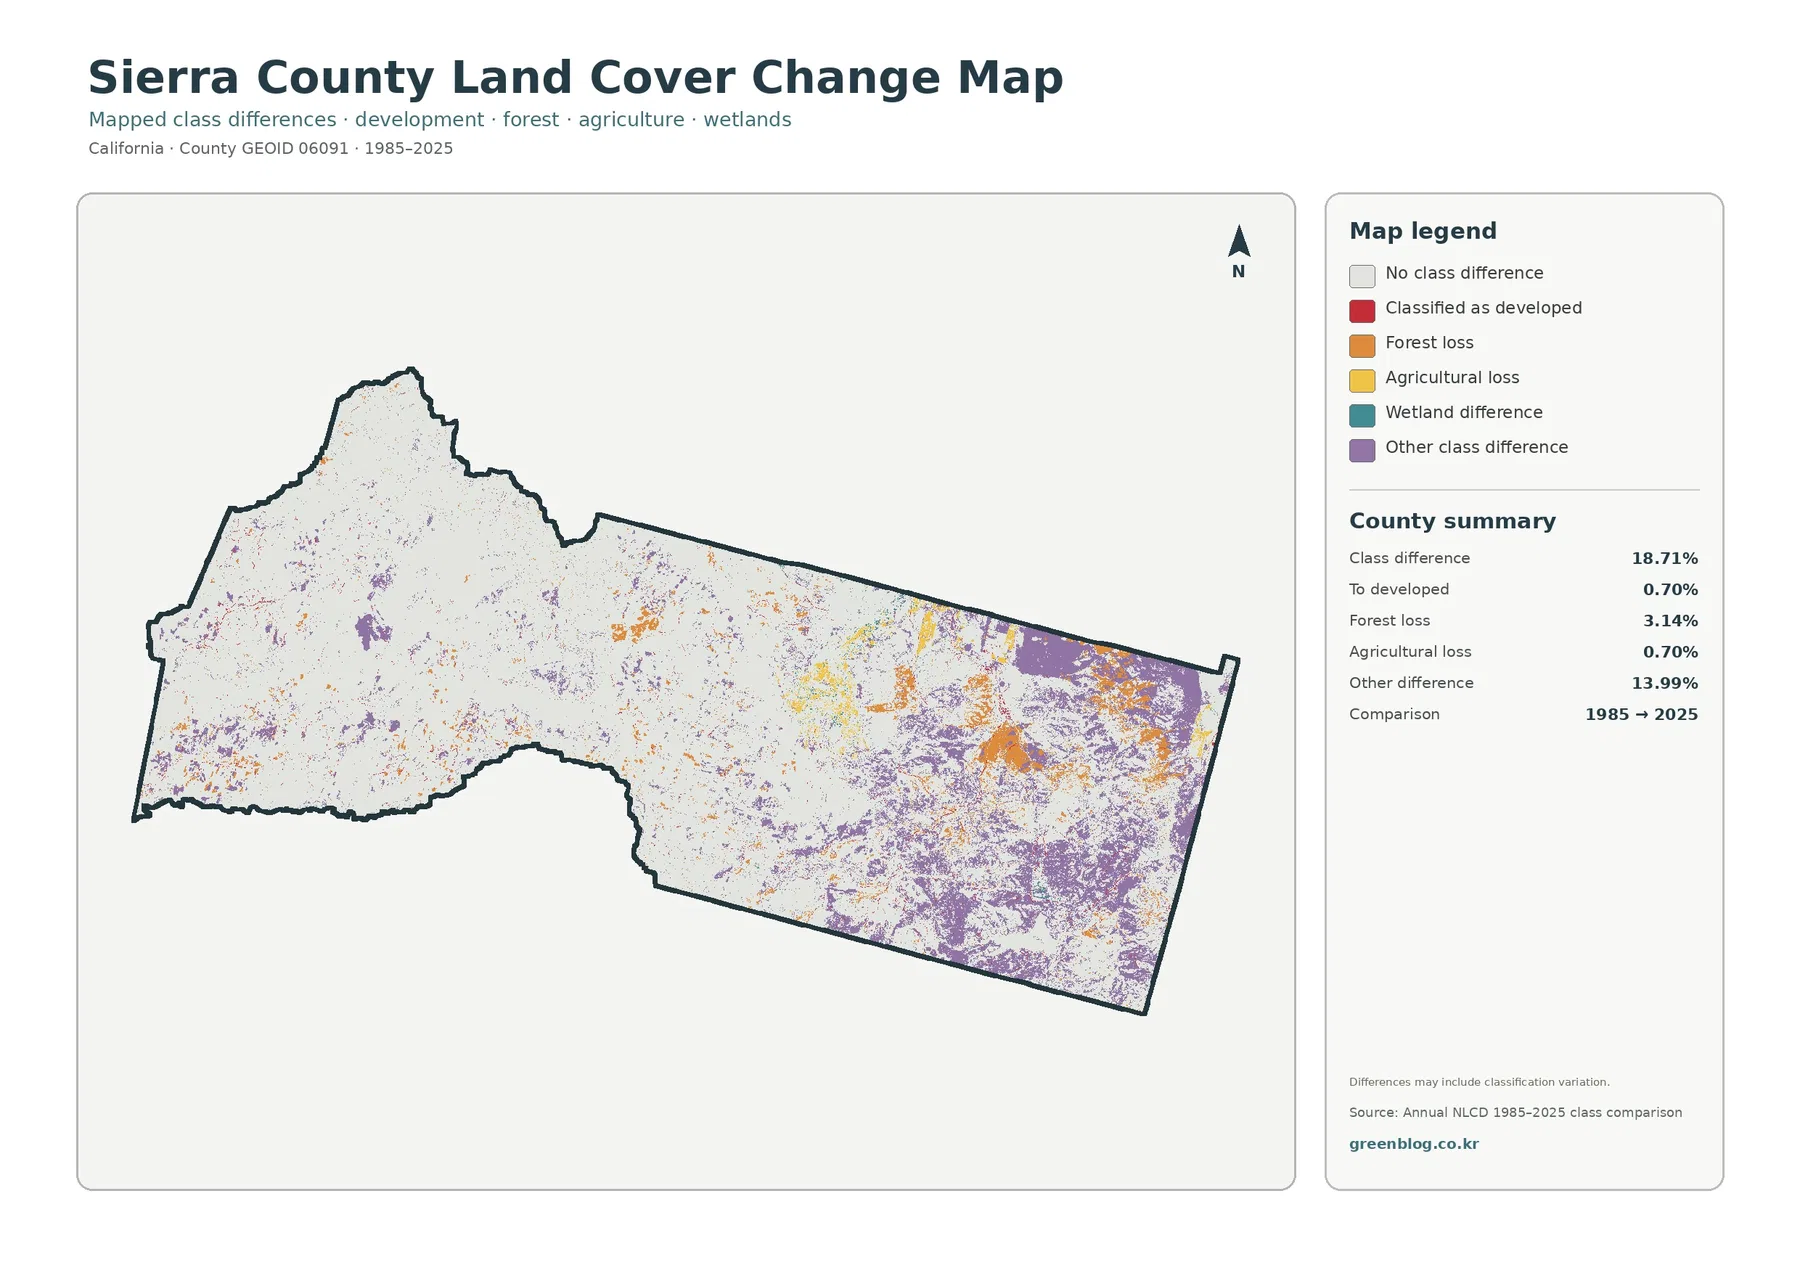
The change map compares the mapped classes for 1985 and 2025. It reports a class difference across 18.71% of Sierra County. Within that total, 0.70% is classified as a shift to developed cover, 3.14% as forest loss, and 0.70% as agricultural loss. The largest category by far is “other class difference” at 13.99%.
The eastern part of the county contains many of the most visible change colors. Purple other-difference areas and orange forest-loss classifications occur in broad scattered patches, while the western forest contains smaller and more dispersed marks. The distribution is useful for locating places that deserve closer review, but the colors do not identify a cause. A patch cannot be labeled as logging, wildfire, new development, restoration, or agricultural conversion from this map alone.
The map itself warns that differences may include classification variation. That point is especially important here because most of the changed area falls into the broad “other difference” category rather than a single named conversion. Annual NLCD is a raster dataset derived from Landsat imagery at 30-meter resolution, so each cell summarizes a relatively large ground area. Mixed vegetation, boundaries between classes, and model differences can all affect how a cell is classified in different years.
Choosing the Right Sierra County Map for the Question
For a quick county overview, the general land-cover map is the strongest starting point because it places forest, shrubland, grassland, development, wetlands, water, and agriculture in one frame. It immediately establishes the wooded west and the more open east. The forest-and-farmland map is better when the task is to separate forest from the shrub, grass, agriculture, wetland, and water classes that are easier to compare around Sierra Valley.
Land Cover Is Not Zoning, Ownership, or a Parcel Survey
Land cover describes the physical surface identified by the classification system: forest, shrubland, grassland, water, wetlands, developed cover, and related classes. Zoning answers a different question about permitted land use and development. Ownership is another separate layer, and a survey establishes legally relevant parcel boundaries. None of those legal meanings should be inferred from a land-cover color.
Download the Four Sierra County JPG Maps
The download contains the same four topics shown in the article as original 2480×1754 JPG files. Keeping all four in one archive makes it easier to compare the 2025 land-cover pattern, forest and farmland grouping, impervious surface, and the 1985–2025 class-difference view at the same county extent. These are image maps rather than editable GIS layers or parcel data.
Frequently Asked Questions
If forest is 70.07%, why does eastern Sierra County look so open?
The large western and central forest blocks drive the countywide percentage upward. In the eastern portion, especially around the Sierra Valley landscape, shrubland, grassland, wetlands, small agricultural areas, and water occupy much more visible space. A county total can therefore be forest-dominated even while one major subregion looks very different.
Why is developed cover 3.06% when mean impervious surface is only 0.53%?
They are different measurements. A developed land-cover class can contain substantial vegetation, particularly in low-density areas. Fractional impervious surface estimates how much of each 30-meter cell is occupied by hard surfaces such as pavement and rooftops. Sierra County can therefore have a larger developed-class share than its average impervious percentage.
Does the 18.71% class difference mean that much of the county was developed or deforested?
No. The largest component is 13.99% labeled as other class difference, and the map notes that classification variation may be included. The 3.14% forest-loss and 0.70% to-developed categories are mapped classifications, not explanations of cause. Confirming real-world change requires additional historical or site-specific evidence.
Sources and Reference Material
- MRLC Annual NLCD Data — official access to Annual NLCD land-cover and related products
- USGS Annual NLCD Collection 1.2 — documentation for the collection that includes 2025 and its 30-meter raster products
- Sierra County General Plan — official county context for forests, valleys, watersheds, communities, and long-range land-use policy
- Sierra County Planning Department — official information about the General Plan, zoning, development review, and property-related planning processes
Map File Information
The ZIP contains four original JPG maps covering Sierra County land cover, forest and farmland, impervious surface, and mapped class differences.
- Printable Size: 2480×1754 pixels each
- File Type: Four JPG files in one ZIP archive
Related Maps
- Alameda County California Land Cover Map
- Alpine County California Land Cover Map
- Amador County California Land Cover Map
Green Map creates custom-edited map images using open geographic data sources such as geoBoundaries, Natural Earth, OpenStreetMap, and government open data.
These maps are edited visual materials, not raw data files, and are provided for education, documents, presentations, and graphic reference.