Nevada County has a land-cover pattern that makes more sense once its long east-west shape is noticed. Most of the county is forested, yet developed land forms two clearly separated concentrations: one in the western population center and another around Truckee in the eastern section. The four maps on this page let you compare that broad 2025 pattern with forest and farmland, impervious surface, and mapped class differences between 1985 and 2025.
The page previews use WebP images, while the four original JPG maps are available together in one ZIP below. Start with the general map for the countywide pattern, then use the specialized versions when the question is about hard surfaces, forest and agricultural cover, or long-term classification differences. Land cover describes what is physically covering the ground; it is not the same as zoning, ownership, parcel boundaries, or permission to develop land.
Table of Contents
Two developed centers stand out inside a mostly forested county
The 2025 developed class accounts for 8.67% of Nevada County, but its distribution is much more informative than the percentage alone. In the broad western part of the county, red developed cells form a substantial cluster with smaller extensions around it. Far to the east, another concentration appears near the end of the county’s long narrow section. Between those areas, forest and shrub cover dominate, so the developed portions do not read as one continuous urban belt.
Official county material identifies Grass Valley, Nevada City, and the Town of Truckee as Nevada County’s three principal communities. That local context matches the large-scale pattern in the supplied maps: the western development is associated with the Grass Valley–Nevada City side of the county, while the eastern concentration is associated with Truckee. The land-cover graphic itself does not label city limits, so individual pixels should not be treated as municipal boundaries.
Hard-surface data makes the separation even clearer. Mean impervious cover is only 1.92% countywide, and land with at least 50% impervious surface accounts for 0.73%. Impervious surface means pavement, rooftops, and other surfaces that do not readily absorb water. Those values are lower than the 8.67% developed-cover figure because a developed land-cover class can contain lawns, trees, bare soil, and other pervious ground along with roads and buildings.
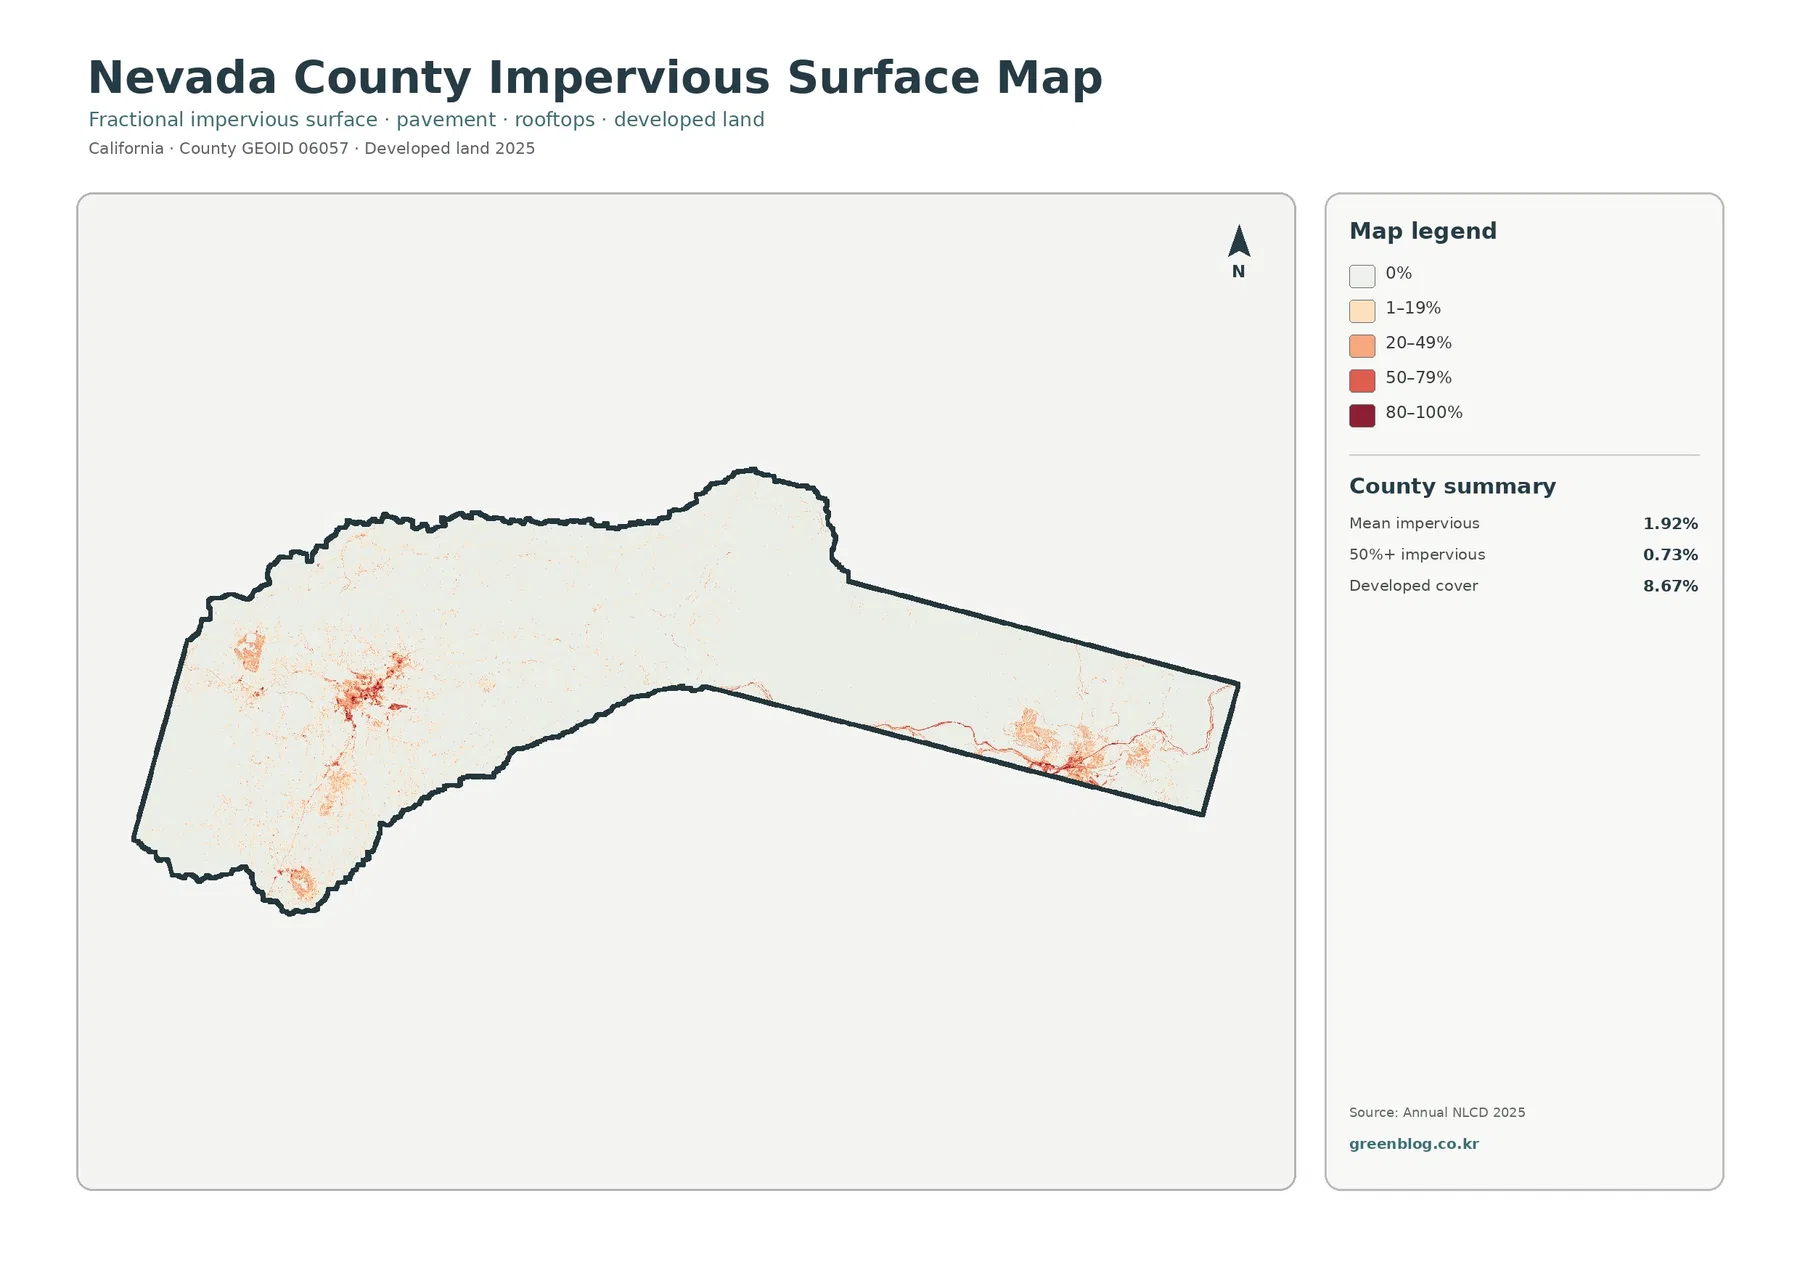
The impervious image also reveals thin lines extending beyond the densest clusters. These are useful as broad indicators of transportation and settled corridors, but the graphic is not a road map and does not label individual routes. Narrow roads may blend with surrounding vegetation in a 30-meter raster cell, while a developed cell can still contain a substantial amount of vegetation. For parcel-level pavement, drainage, or infrastructure work, Nevada County’s official GIS layers are the better source.
A 68.28% forest share defines the 2025 countywide pattern
Forest is the dominant 2025 cover at 68.28%. Shrubland follows at 17.54%, while grassland contributes another 2.99%. Together, these natural covers occupy most of the map and create a very different county profile from California counties dominated by broad agricultural plains or large urban areas. Developed land is visible because it is concentrated, not because it occupies most of the county.
Water makes up 1.44% and wetlands 0.49% of the county summary. Blue water patches appear in both the western and eastern portions, but no single water body dominates the map at the scale shown here. The eastern section contains a mix of forest, shrubland, water, and developed cells, while the wider western section has a more complex mosaic around its settled areas. The county’s shape therefore matters when interpreting one percentage for the whole jurisdiction.
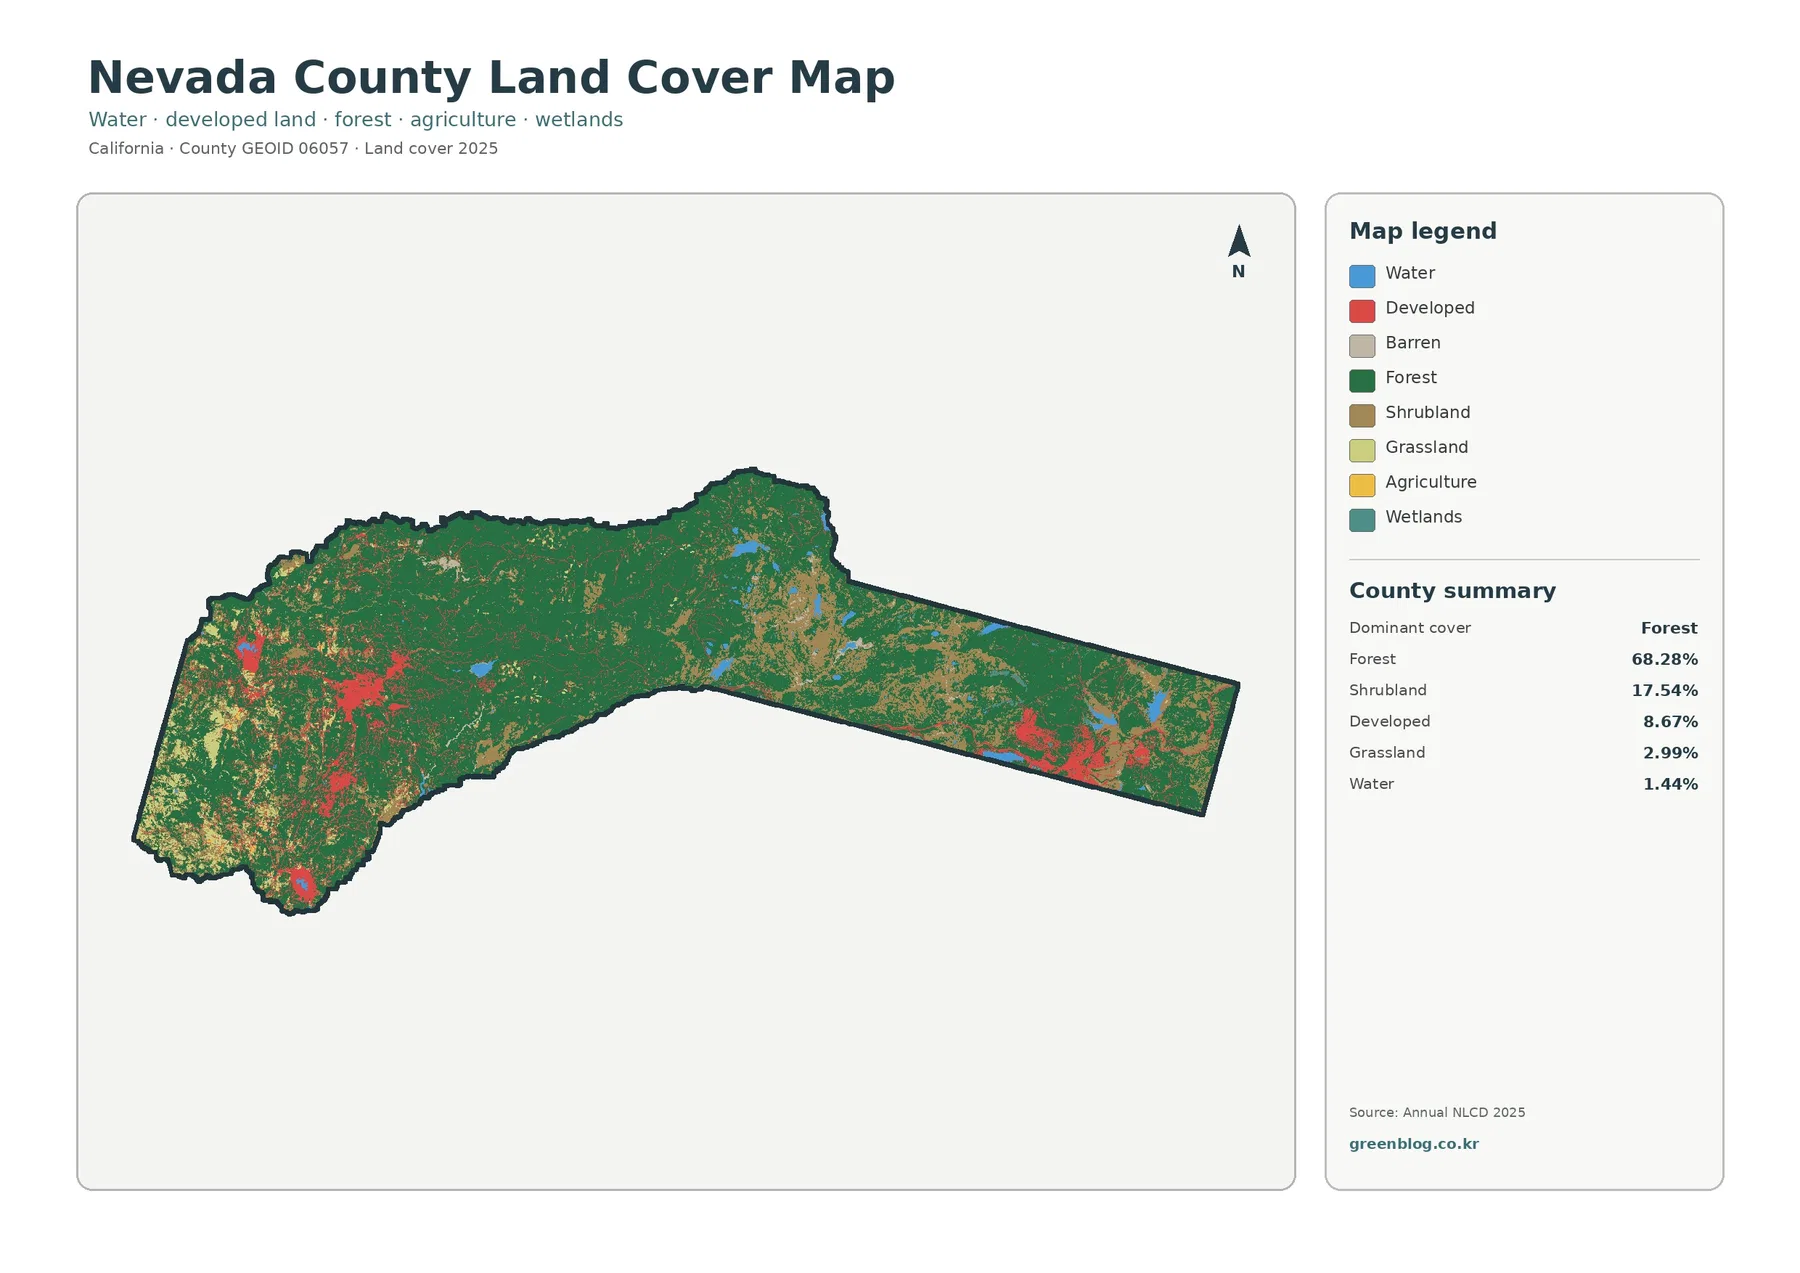
Reading the legend by groups is easier than treating every color as a separate story. Forest, shrubland, and grassland describe different vegetation structures. Developed land marks a broad class of settled surfaces, while water and wetlands identify very different hydrologic conditions. Barren cover is also part of the legend, but it is not listed among the major summary percentages, so the supplied map does not support assigning it a precise countywide share here.
The western urban cluster deserves special attention because green forest remains close to its edges. Rather than a sharp boundary between city and wilderness, the map contains many short transitions among developed, forested, shrub, and grass-covered cells. The eastern Truckee area has its own mixture of development and natural cover. These transitions are exactly where a county-scale raster should be read cautiously, because one 30-meter cell can contain more than one real-world surface.
Forest and farmland look very different when the legend is simplified
The forest-and-farmland version removes much of the visual competition from the full legend. Forest remains the dominant green cover across the map, and shrub or grass areas become easier to distinguish around it. Agriculture, however, is only 0.10% in the 2025 summary. Yellow agricultural pixels are consequently sparse and do not form a broad valley-scale block comparable with the farm belts seen in many Central Valley counties.
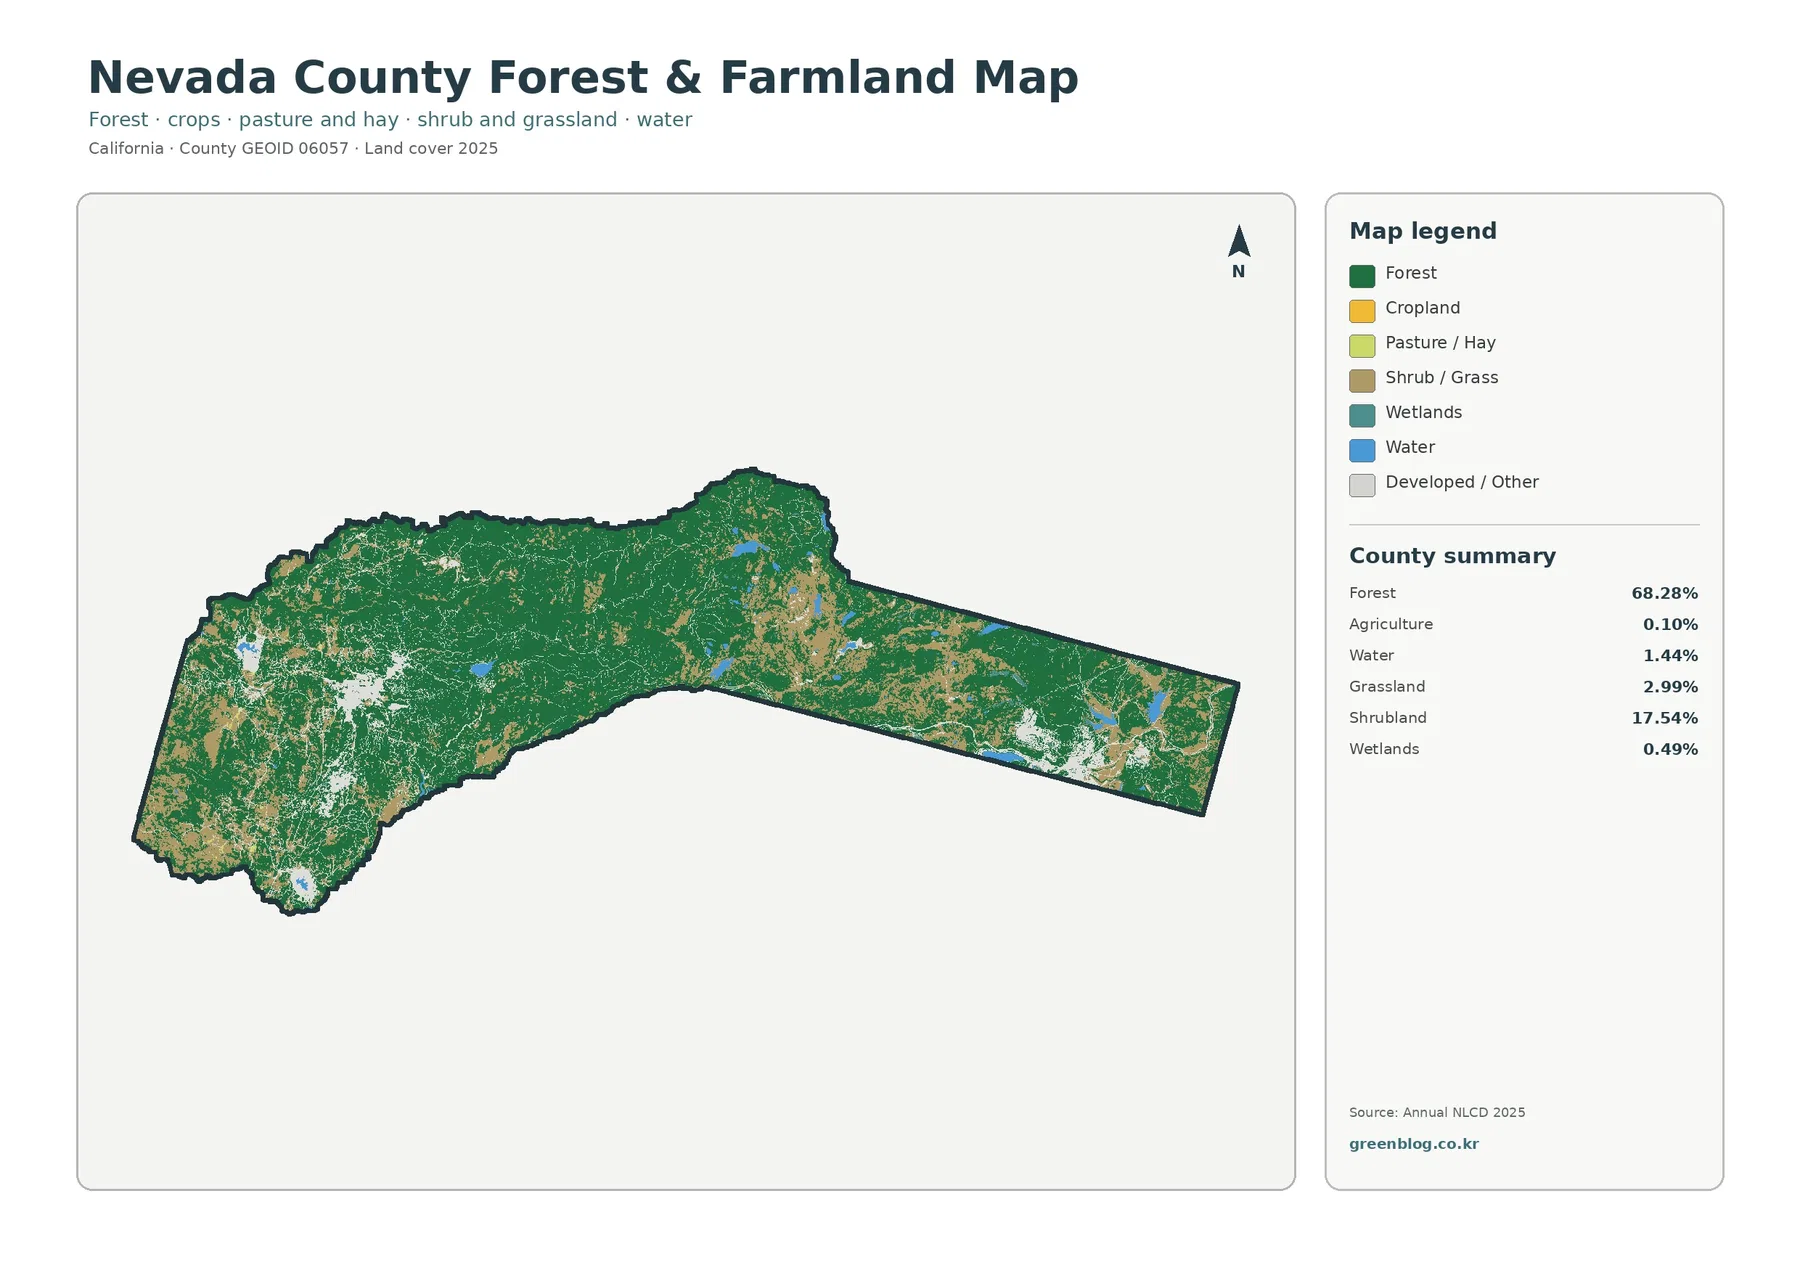
That 0.10% figure should not be converted into a statement about legal agricultural land. Annual NLCD classifies surface cover from remotely sensed information; it does not assign zoning, Williamson Act status, ownership, or permitted uses. A property can have an agricultural designation in a planning record without appearing as the agricultural cover class in this map, and the reverse distinction can also matter. Nevada County’s General Plan and zoning resources address those legal and policy questions separately.
This map is useful when the main question is where forest gives way to more open vegetation or settled areas. In the western section, developed and other cover interrupts the forest more frequently around the population center. Farther east, forest is again extensive but shares the narrow county corridor with shrub or grass patches, water, and the Truckee-area development. Because the theme is simplified, returning to the full land-cover map is important whenever a pale area needs a more specific class.
For education or presentation work, the simplified legend can make a county comparison more readable. A slide can contrast Nevada County’s 68.28% forest with another county where farmland or shrubland dominates without asking viewers to process every category at once. It cannot identify tree species, forest age, fuel condition, crop type, or timber-management status. Those are different datasets and should not be inferred from the green or yellow pixels.
The 1985–2025 comparison is modest in area but varied in type
The endpoint comparison marks 15.96% of Nevada County as having a different mapped class in 2025 than in 1985. The supplied summary breaks that total into 2.71% classified to developed, 2.83% forest loss, 0.11% agricultural loss, and 10.23% other class difference, with wetland difference also represented in the legend. The largest named component is therefore “other difference,” not development or forest loss.
Change colors are scattered across the western part of the county rather than forming one single block. Red developed-change cells are more noticeable near existing developed concentrations, while orange forest-loss cells appear in multiple patches. The eastern section contains another mix: developed change near the Truckee area and broader patches of other class difference around it. Large white areas indicate cells that kept the same mapped class at the two endpoints.
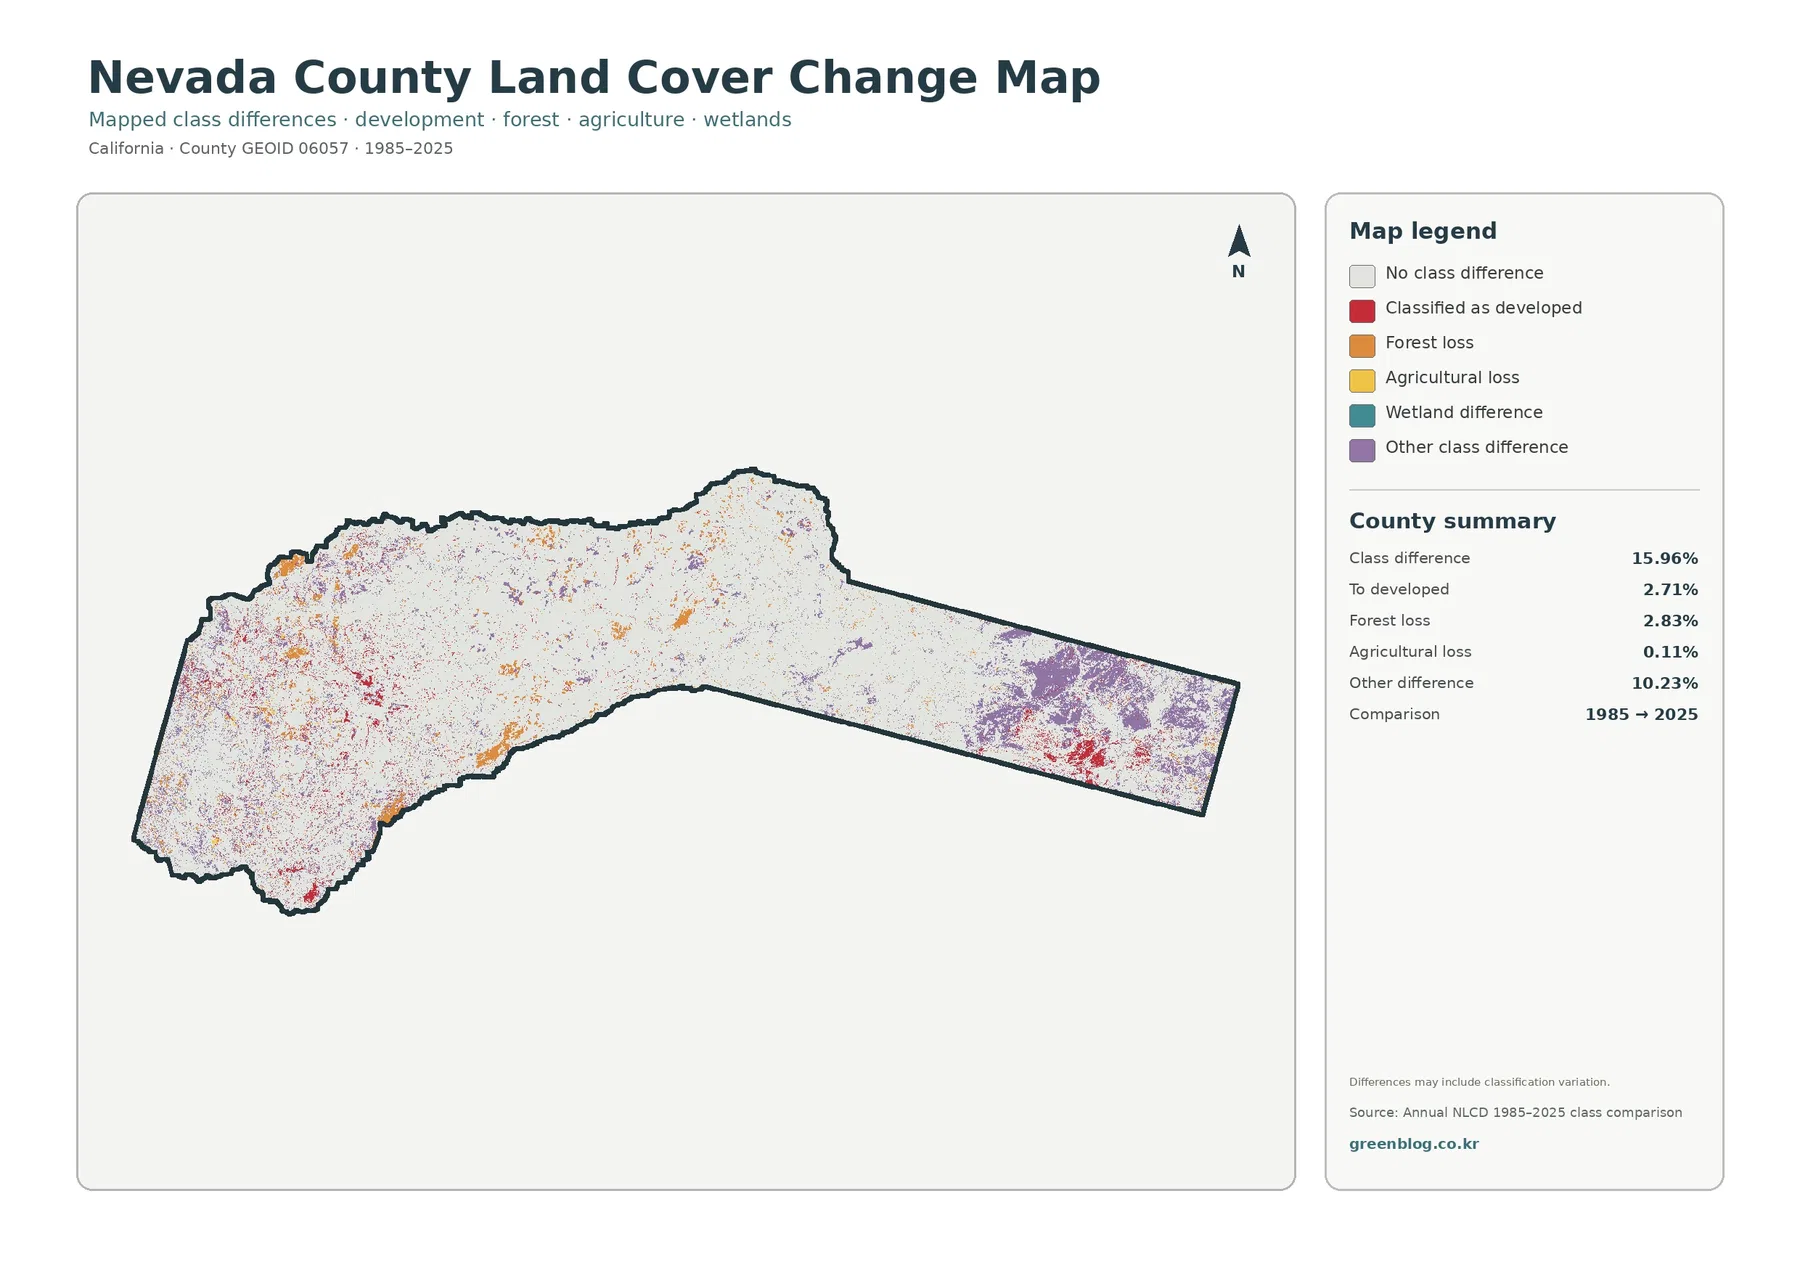
A colored change cell is not proof of a particular event. The map itself notes that class differences can include classification variation. Differences in imagery, vegetation condition, mixed pixels, and class assignment can contribute to an endpoint mismatch. Real land-cover change may also be present, but the image alone does not establish whether a forest-loss cell resulted from fire, harvest, drought, clearing, or another process.
The safest workflow is to use this layer as a locator. Find a cluster of change cells, check its 2025 class on the general map, then compare intermediate Annual NLCD years or aerial imagery if the history matters. A red cell near an existing developed cluster can be examined alongside the impervious map. An orange cell can be checked against forest data and local records. This sequence keeps the interpretation tied to evidence rather than turning a category label into a guessed cause.
How to combine the four Nevada County views without duplicating the same question
Use the general map when you need one image that explains the county as a whole. It establishes the dominant forest cover, the sizeable shrubland share, the separated development centers, and the smaller water and grassland components. If a viewer needs only that broad distribution, the other maps are optional. Specialized maps become valuable when the question changes.
For a development question, pair the general map with the impervious image. The first says which cells are classified as developed; the second indicates how much hard surface is present. The difference between 8.67% developed cover and 1.92% mean impervious surface is a useful reminder that “developed” is not a synonym for “fully paved.” This is especially relevant around the edges of the western and Truckee clusters, where vegetation and built surfaces can occur close together.
For a vegetation question, move instead to the forest-and-farmland version. It makes the 68.28% forest dominance obvious and keeps the very small 0.10% agricultural share in perspective. The change map should generally come last, after current conditions are understood. Its 15.96% class-difference total is easier to interpret when the viewer already knows whether a colored cell now lies in forest, shrubland, development, or another cover type.
This sequence also works well in a classroom or report. One image introduces the landscape, a second isolates the feature being discussed, and the change layer adds time. For planning context, the maps can help frame a question before moving to official Nevada County GIS, zoning, parcel, hazard, or infrastructure information. They should not replace those regulatory or engineering sources.
Map File Information
The downloadable archive contains four original JPG graphics for Nevada County, California. One covers the full 2025 land-cover classification, one emphasizes forest and farmland, one focuses on impervious surface and developed land, and one compares mapped classes from 1985 to 2025. Keeping the files separate makes it easy to use only the theme needed for a handout, presentation, lesson, or reference document.
Keep the legend and date visible when reusing a map. The current-cover images represent 2025 classification, and the change graphic specifically compares 1985 with 2025. Removing those labels can make a printed figure misleading. The JPG files are finished map graphics rather than raw GIS layers; anyone who needs pixel values, intermediate years, or analytical processing should use the official MRLC or USGS source data instead.
Three scale limits matter before using the maps for local decisions
Annual NLCD is a 30-meter raster product. A raster divides the landscape into grid cells and assigns a mapped value to each cell. That structure supports consistent regional comparison, but it generalizes small features. A cell along a road or development edge can contain pavement, vegetation, and bare ground at the same time, even though one classification or impervious value is ultimately displayed.
Zooming in does not create parcel precision. Narrow streams, small wetlands, minor roads, isolated buildings, and complicated forest edges can be simplified at county scale. The maps therefore work well for questions such as “Where are the largest developed concentrations?” or “Which part of the county is predominantly forested?” They are not appropriate for locating a property boundary or deciding whether a specific site is buildable.
Time is the third limitation. The current maps stop at 2025, so later construction, vegetation change, fire effects, or water changes are outside the data shown here. The change map uses two endpoints and does not reveal exactly when a cell changed in the forty-year interval. Intermediate annual products are needed for timing, and local records are needed when the reason for a change matters.
Used at the right scale, the set gives a concise picture of a distinctive county: forest dominates the land area, agricultural classification is tiny, developed surfaces form separated western and eastern clusters, and the endpoint change total is much smaller than the forest share. Those observations are useful precisely because they come from different map themes rather than from one overloaded image.
Frequently Asked Questions
Why are Grass Valley–Nevada City and Truckee separated on the land-cover maps?
Nevada County has a long shape with a broad western section and a narrow extension to the east. Official county information identifies Grass Valley, Nevada City, and Truckee as major communities. On the supplied 2025 maps, developed cover is concentrated in the western population center and again around Truckee, while a large amount of forest and shrub cover lies between them. The map should be used for the broad pattern rather than exact city boundaries.
Does 0.10% agriculture mean only 0.10% of Nevada County can be used for agriculture?
No. The number is the share classified as agricultural land cover in the supplied 2025 Annual NLCD summary. Land cover is not zoning or a legal land-use designation. Questions about agricultural zoning, parcels, permitted uses, or resource policy require Nevada County planning and GIS records rather than the color assigned to a 30-meter land-cover cell.
What does the 15.96% class-difference figure tell me about 1985–2025 change?
It means 15.96% of the county received a different mapped class at the two endpoints in this comparison. The total includes areas classified to developed, forest-loss and agricultural-loss categories, wetland differences, and other class differences. It does not prove that every colored cell underwent a confirmed physical change, because classification variation may also contribute. Intermediate years and other evidence are needed for a specific change history.
Sources and reference material
These official sources provide the Annual NLCD background, county boundary reference, and Nevada County planning and GIS context used to interpret the supplied maps. Land-cover data and regulatory land-use information answer different questions, so they should be consulted separately when a project moves from regional comparison to a specific property or policy issue.
- MRLC Annual NLCD Data — annual land-cover and related products
- USGS Annual NLCD Land Cover Classification — class definitions and product background
- U.S. Census Bureau TIGER/Line Shapefiles — county boundary reference data
- Nevada County General Plan — county land-use, forest, agriculture, and planning policy context
- Nevada County Geographic Information Systems — official GIS and public mapping resources
- About Nevada County — official county context for Grass Valley, Nevada City, and Truckee
Map File Information
The ZIP includes all four original JPG land-cover maps for Nevada County, California.
- File Type: ZIP containing four JPG files
Related Maps
- Alameda County California Land Cover Map
- Alpine County California Land Cover Map
- Amador County California Land Cover Map
Green Map creates custom-edited map images using open geographic data sources such as geoBoundaries, Natural Earth, OpenStreetMap, and government open data.
These maps are edited visual materials, not raw data files, and are provided for education, documents, presentations, and graphic reference.