Crenshaw County is mostly wooded on the 2025 land-cover map, but the county is not a single block of forest. Forest accounts for 50.73% of the mapped area, while agriculture covers 16.38% and wetlands 12.06%. Grassland, shrubland, developed land, and small areas of open water fill the spaces between them. The map set on this page separates those themes so a reader can compare the overall cover, the forest-and-farmland pattern, impervious surfaces, and mapped class differences between 1985 and 2025.
The four original JPG maps are available together in one download farther down the page. They work well for county-level reference, classroom material, presentation graphics, and comparisons with other thematic maps. The browser images are quick previews; the JPG files are better when a larger image is needed. These are generalized land-cover products rather than parcel surveys, zoning maps, or legal property records.
Table of Contents
A forest majority with many openings rather than one continuous block
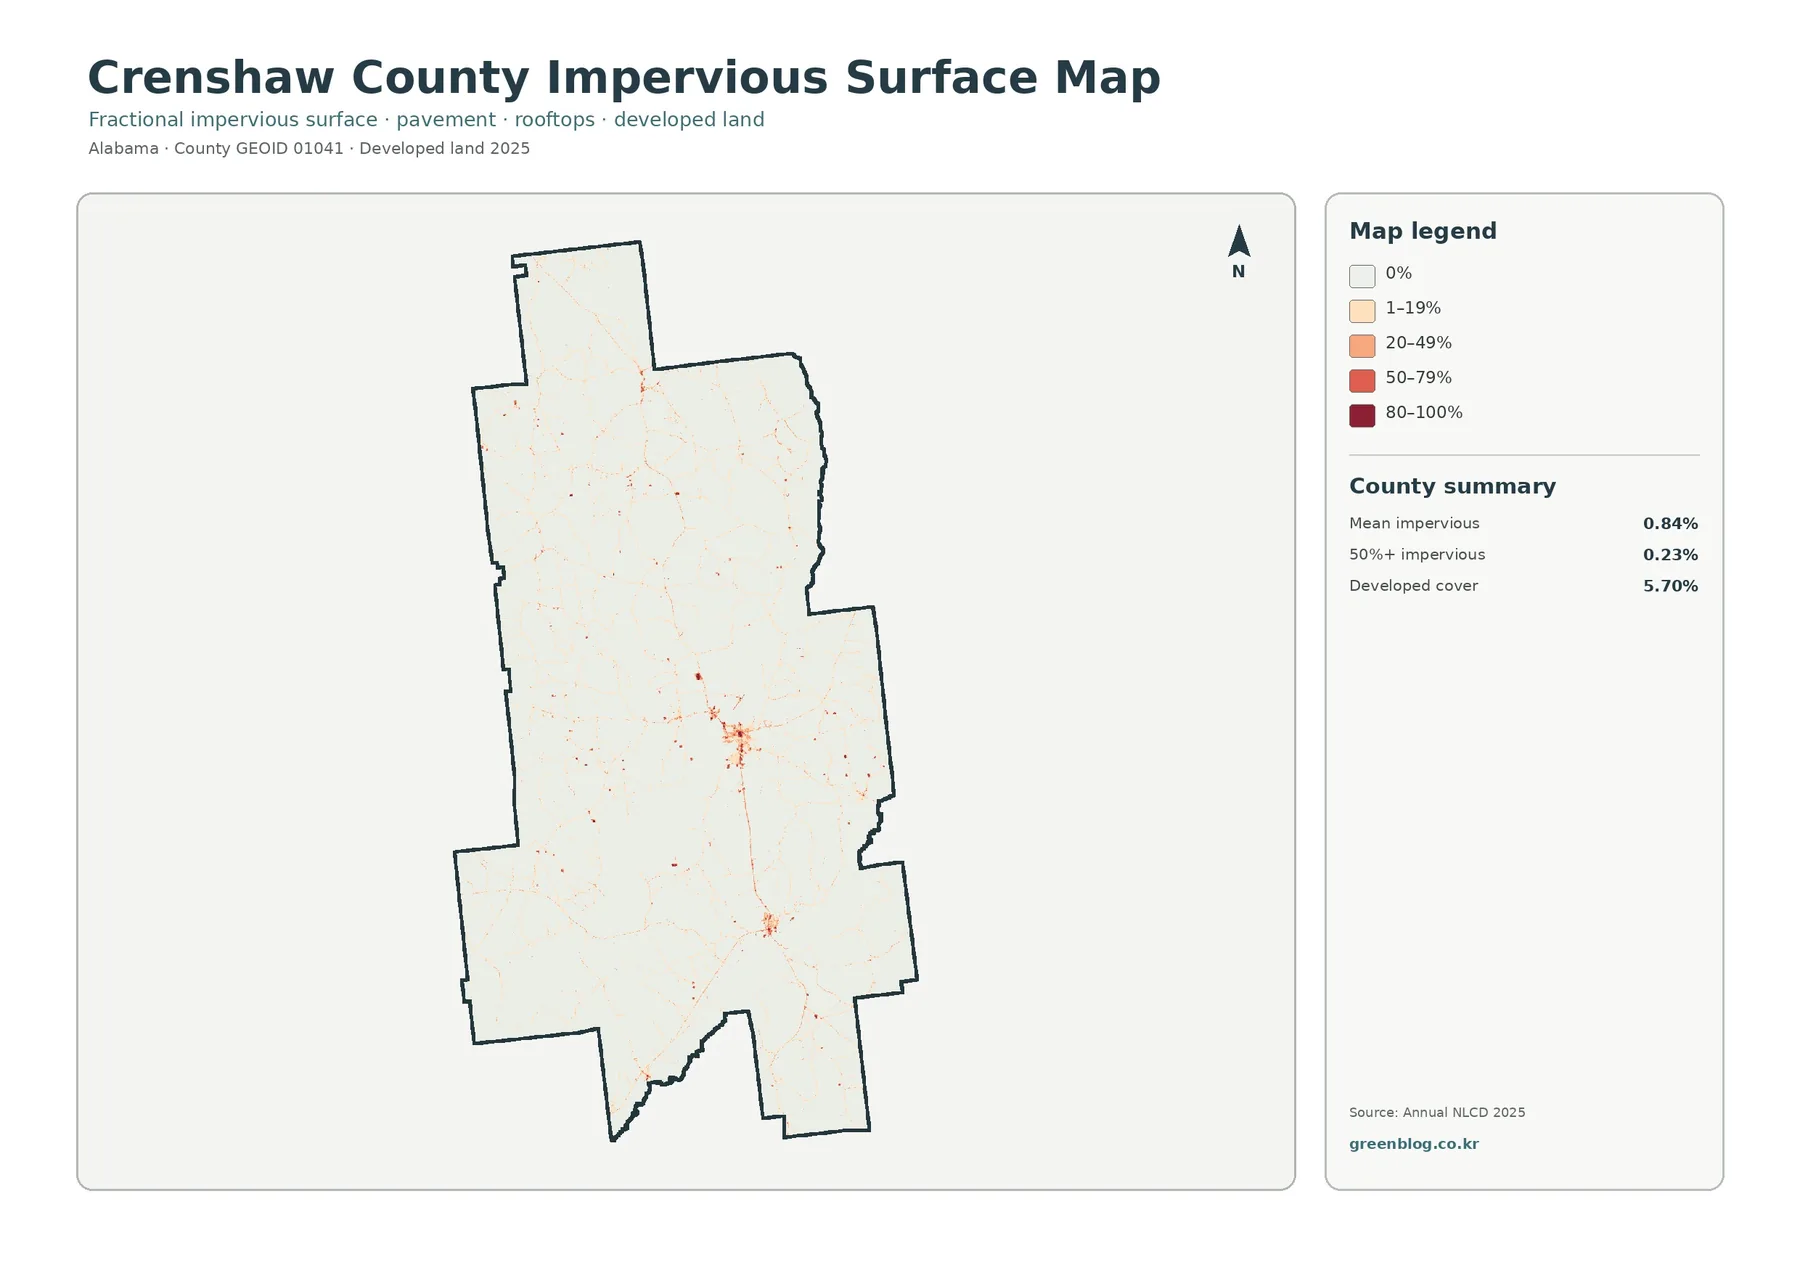
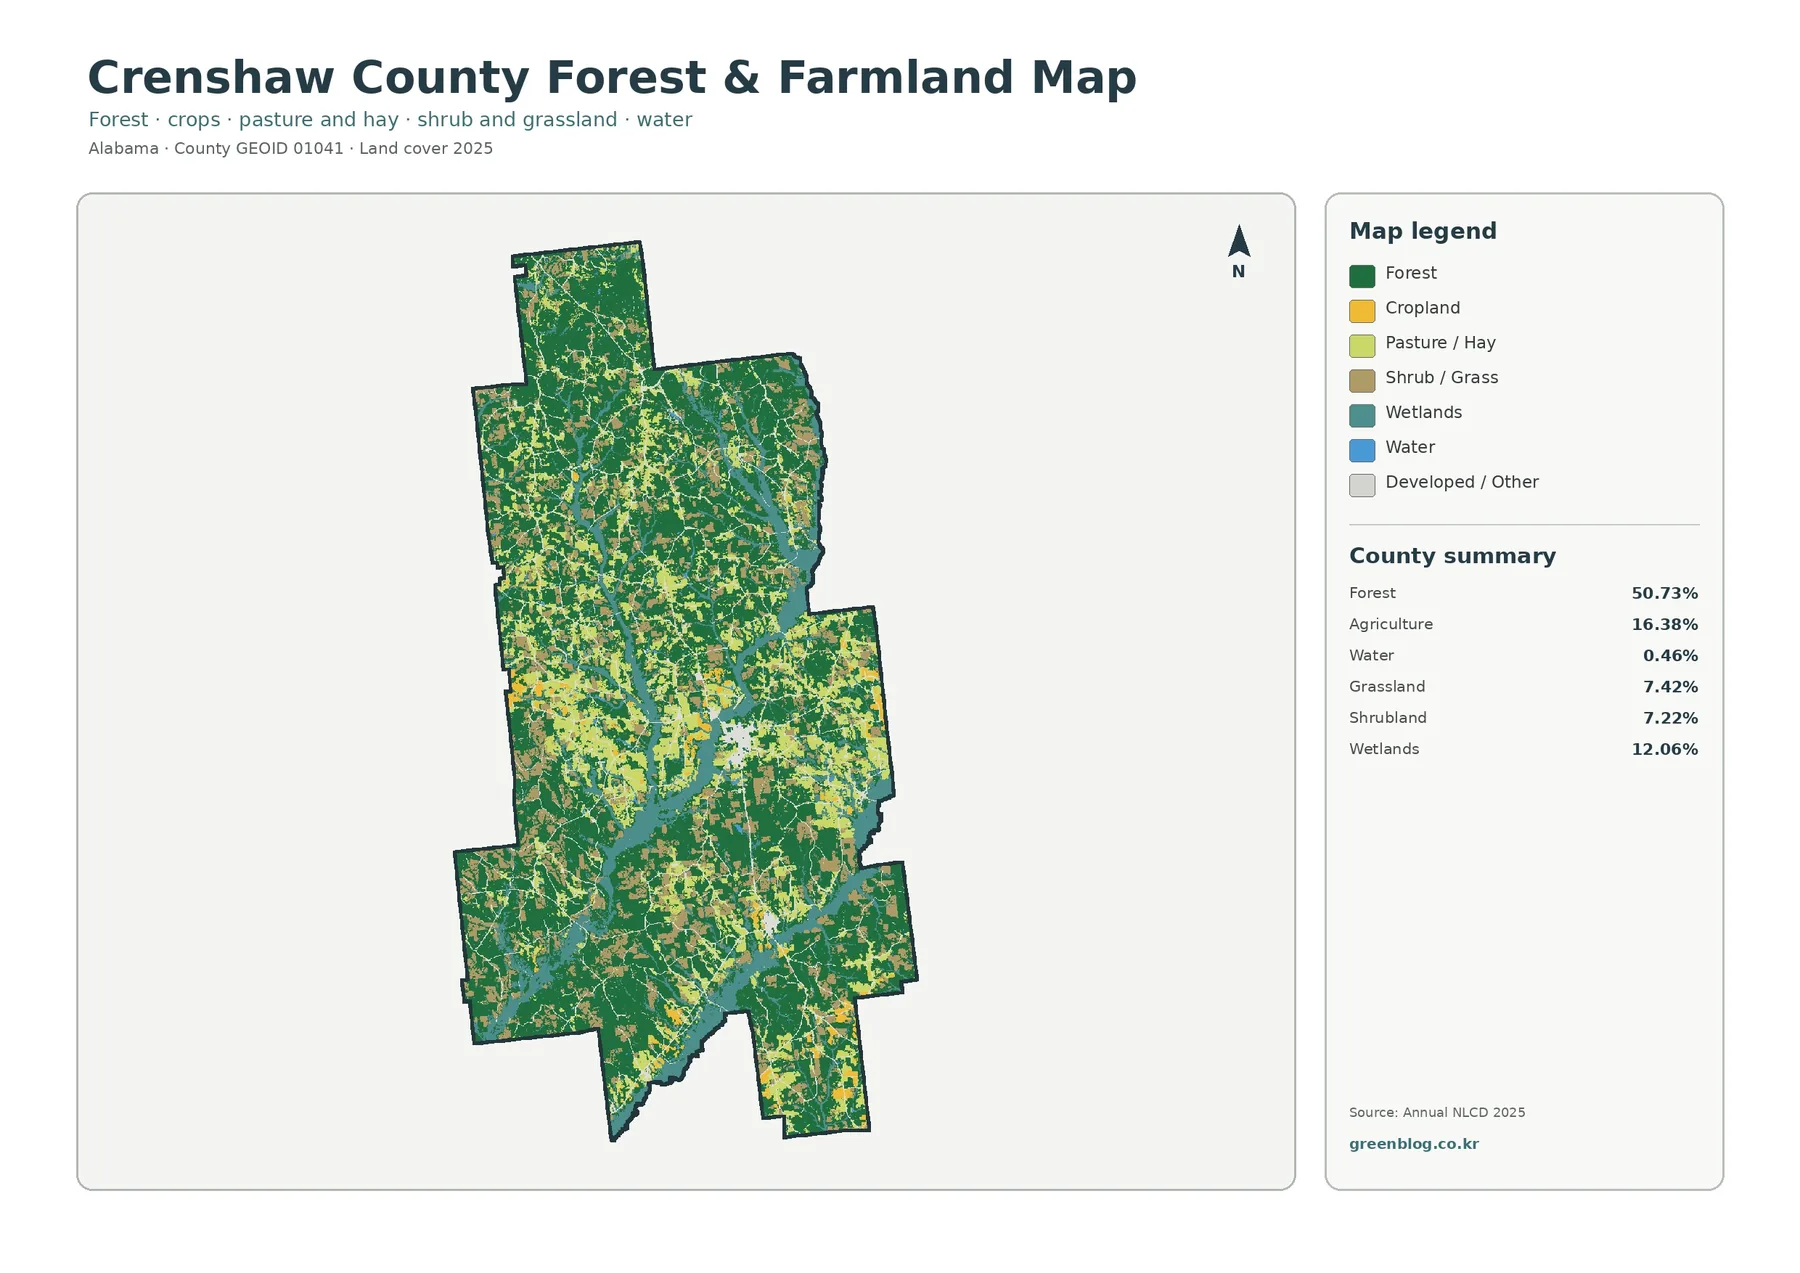
The 2025 map is dominated by dark green, yet the most useful observation is how often that forest is interrupted. Yellow agricultural patches and lighter grass or shrub cover appear throughout the county, especially through the middle and southern portions. Northern areas remain strongly wooded as well, but they still contain smaller openings. This gives Crenshaw County a patchwork appearance: broad wooded areas form the largest share, while working and open lands repeatedly break up the green rather than occupying one separate agricultural belt.
Forest makes up 50.73% of the countywide classification. That number describes the surface class, not forest age, species, timber value, or management condition. Two places shown with the same forest color may be very different on the ground. The county map is therefore best used to locate where tree cover is extensive, where wooded blocks narrow, and where they meet agriculture, wetlands, grassland, or development. A forestry inventory or field assessment would be needed for questions about stand condition.
Agriculture is the second-largest listed class at 16.38%. It appears as many medium and small patches, rather than one uninterrupted field district. Grassland at 7.42% and shrubland at 7.22% add another layer of open cover. Those categories should not be treated as a single legal land use. A grass or shrub cell could represent several different real-world conditions, and the map does not identify ownership, crop type, grazing rights, or whether a parcel is formally designated for agriculture.
Impervious cover stays low countywide but forms clear local concentrations
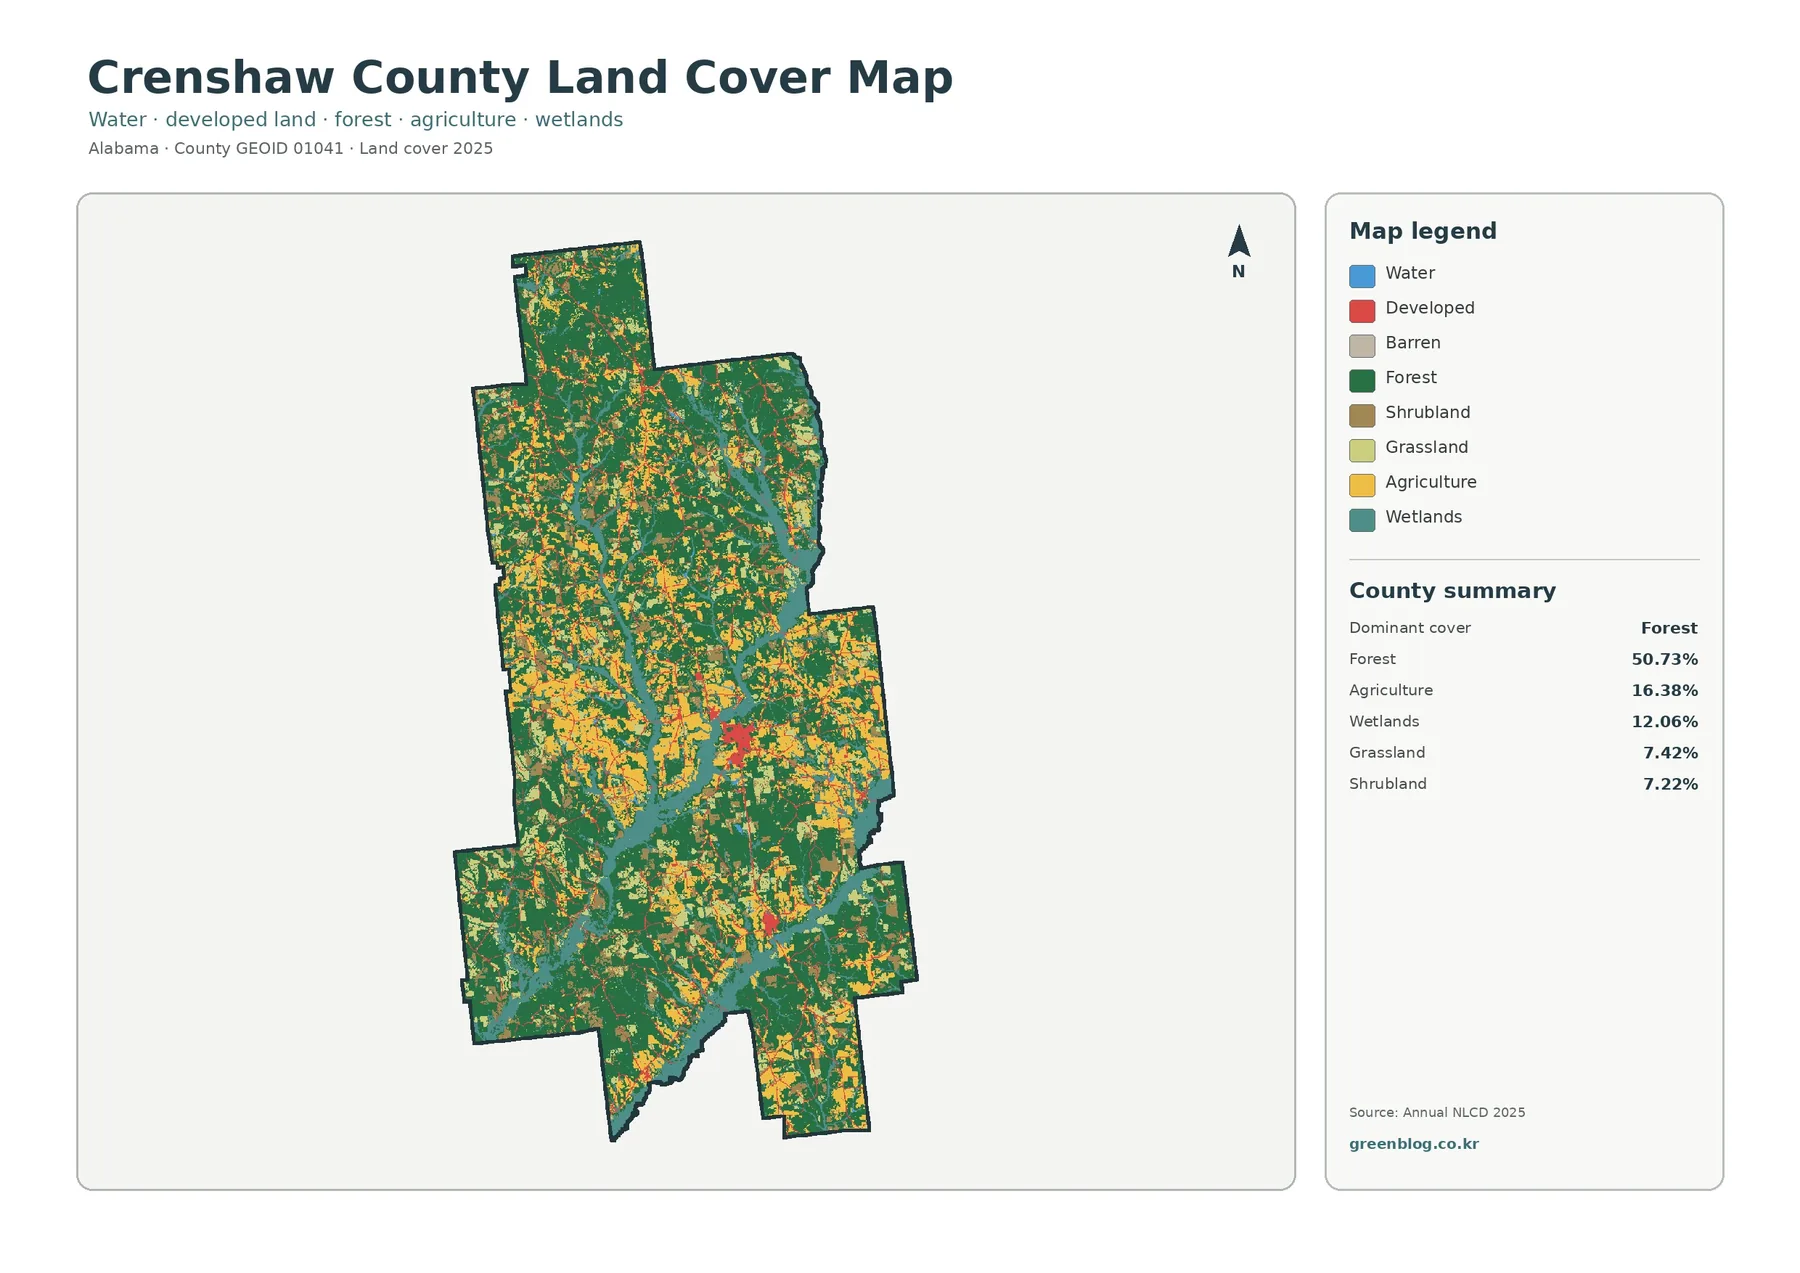
The impervious-surface view changes the visual balance dramatically. Most of Crenshaw County is very light because the mean impervious value is only 0.84%. Areas where impervious cover reaches 50% or more account for 0.23% of the county. Darker marks cluster in a few compact centers and along thin connecting lines. That pattern is consistent with pavement and rooftops being concentrated around settlements and transportation routes rather than spread evenly across the rural landscape.
The broader developed land-cover class is 5.70%, which is much larger than the mean impervious percentage. The two figures measure different things. Developed land can include yards, trees, grass, and other permeable surfaces mixed with buildings and roads, especially in low-density settings. Impervious data estimates the hard-surface fraction within each cell. Reading the two together helps separate the footprint of a developed setting from the smaller portion that is actually covered by pavement or rooftops.
Luverne is a useful geographic reference when the land-cover maps are paired with a place or road map. The Alabama Department of Revenue lists the Crenshaw County Courthouse in Luverne, confirming its administrative role in the county. The land-cover preview itself does not label municipal boundaries, so the safest approach is to use a separate place layer for exact names and use this map to describe the surface pattern around those places. A second, smaller impervious concentration is visible farther south, with narrow lines extending through the county between developed nodes.
Impervious cover can be useful in watershed discussions because pavement and rooftops allow less direct infiltration than soil or vegetation. It does not, however, measure flood risk by itself. Drainage depends on elevation, soil, rainfall, channels, wetlands, and built infrastructure. The map can point to places where hard surfaces are more concentrated, but site-level stormwater or engineering questions require much more detailed information.
Wetlands form a much larger water-related pattern than open water
Open water is only 0.46% of the 2025 classification, but wetlands cover 12.06%. That difference matters when reading the county. Blue water cells are limited, while teal wetland bands appear as long, branching features that pass through forest and agricultural areas. A reader who looks only for lakes or wide rivers would miss much of the water-related surface pattern. The wetland class provides a better picture of where low, moist, or water-influenced ground is mapped across the county.
The wetland bands are especially useful as reference features because they cut across several other covers. In some places they divide wooded blocks; elsewhere they border agricultural openings or pass near developed areas. Those relationships can support a first look at habitat connections, watershed context, or where more detailed wetland information may be useful. They do not establish regulatory wetland boundaries, stream direction, or floodplain limits. Those questions require dedicated hydrologic, elevation, and jurisdictional data.
At the map scale, narrow channels and wetland edges are also subject to raster generalization. A 30-meter-class cell may contain several surface types even though the classification must assign one dominant label. Small water features can disappear inside neighboring classes, while a wetland boundary may look blockier than it does on the ground. That is why the map is strongest for countywide pattern recognition, not for tracing a legal or field-survey boundary.
Forest and farmland together give the clearest rural picture
The forest-and-farmland map strips away some of the visual competition from the general legend. Forest remains the largest element, while agricultural patches stand out more clearly between wooded areas. The simplified view also keeps wetlands, water, grassland, and shrub or grass cover visible, making it easier to see how rural covers overlap in the same part of the county. Instead of reading agriculture as an isolated zone, the map shows it as one component of a broader mosaic.
The official 2022 Census of Agriculture profile for Crenshaw County adds useful context, though it measures something different from NLCD. USDA NASS reported 127,773 acres of land in farms, including 65,867 acres of woodland, 33,185 acres of pastureland, and 21,393 acres of cropland. Those figures describe land reported within farms, not the percentage of the entire county assigned to a satellite-derived land-cover class. They should not be used to “correct” the 16.38% agriculture value on the 2025 map. Used carefully, the two sources show why both wooded and agricultural landscapes matter in the county.
A practical way to read this map is to identify a large forest block first, then follow its edges. Where yellow agricultural cover appears, check whether the transition is broad and continuous or broken by wetland and grassland cells. Where open cover becomes more fragmented, return to the general land-cover map to distinguish agriculture from grass and shrub classes. This two-step reading is easier than trying to interpret every color at once, especially in the central part of the county where several covers meet frequently.
For environmental education, the map also provides a good example of why “rural” is not a single land-cover class. A rural area can contain forest, cropland, pasture-like grass cover, shrubland, wetlands, scattered buildings, and roads within a short distance. The simplified forest-and-farmland view makes that mixture visible without implying that all light-colored openings have the same use or ecological condition.
The 1985–2025 map records classification differences, not a single change story
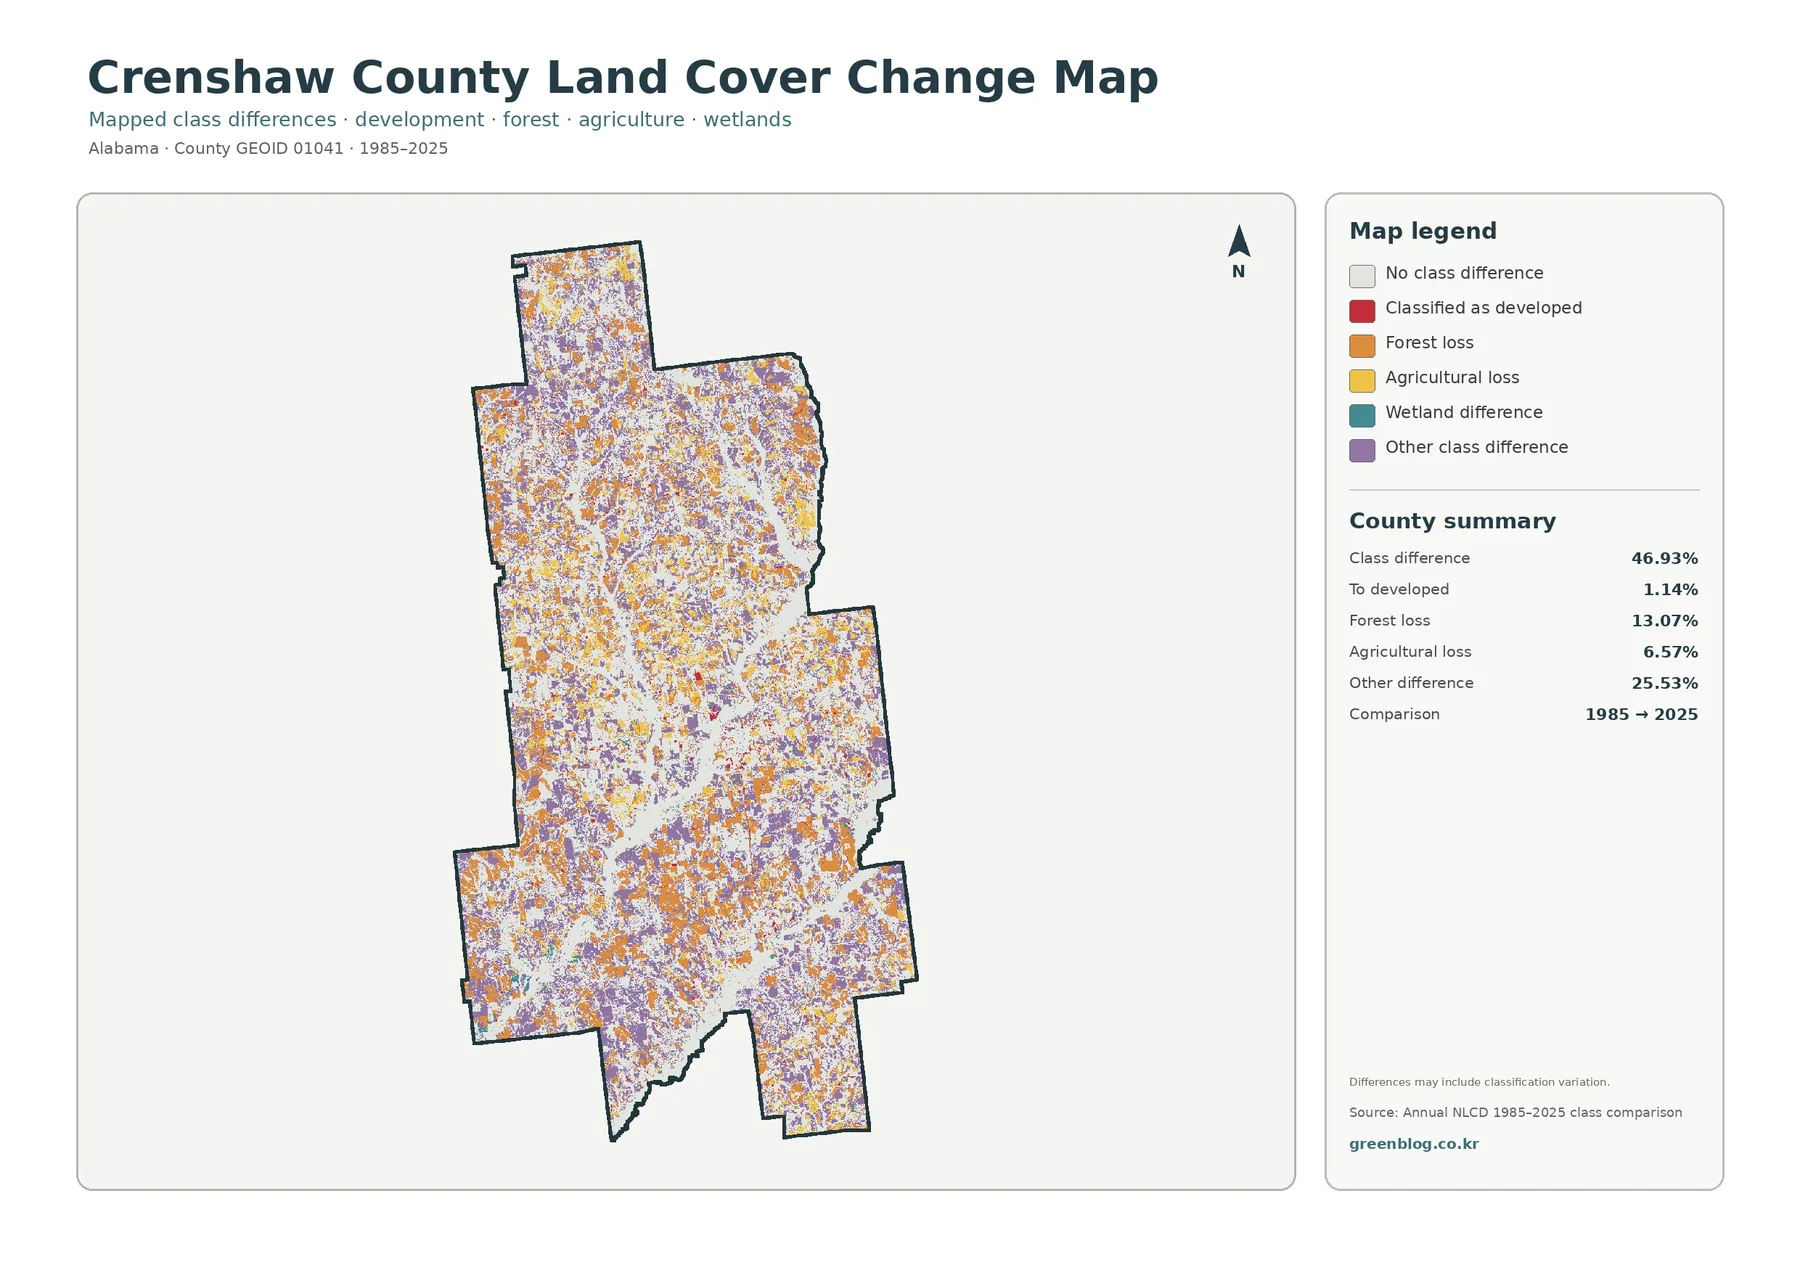
The comparison map reports class differences on 46.93% of the county between 1985 and 2025. Within the summary, 13.07% is shown as forest loss, 6.57% as agricultural loss, 1.14% as classified to developed, and 25.53% as other class difference. Colored cells are spread widely across the county instead of forming one obvious development front. The large “other difference” share is an important warning against treating the map as a simple account of urban growth or deforestation.
A cell can receive a different class because the surface really changed, but classification can also shift because imagery, seasonal conditions, mixed pixels, and category boundaries differ between observation periods. A narrow forest edge, for example, may move from forest to grass or shrub without representing a large permanent conversion. The map itself notes that differences can include classification variation. The 46.93% figure therefore describes a difference between two mapped classifications, not the percentage of Crenshaw County that was physically transformed in a single, uniform way.
To use the change map carefully, compare it with the 2025 maps rather than reading it alone. A patch marked as forest loss can be checked against the current forest-and-farmland view to see whether the cell is now agricultural, grass, shrub, wetland, or developed. Areas classified to developed can be compared with the impervious map to see whether hard surfaces are also concentrated there. Those cross-checks improve interpretation, but explaining why a change occurred still requires aerial imagery, forestry records, building data, agricultural records, or other dated evidence.
Choose the map that matches the question
For a quick county overview, start with the general 2025 land-cover map because it shows all major classes in one place. If the question is about the rural landscape, move to the forest-and-farmland version to reduce visual clutter and compare wooded and agricultural areas more directly. When the focus is settlement intensity or hard surfaces, the impervious map is the better choice. The historical comparison should usually come last, after the current pattern is understood, because it answers a different question: where classifications differ between two dates.
The repeated county boundary makes side-by-side comparison straightforward. A presentation can keep the same map extent while changing one theme at a time, allowing viewers to stay oriented. In a classroom, students can select one location and trace it through all four maps. In a planning or environmental discussion, the set can help identify where more detailed data should be requested. None of those uses requires claiming more precision than the source supports.
The maps are also useful for comparing Crenshaw County with neighboring counties if the same classification year and style are used. Forest percentage alone does not tell where woodland is concentrated, and agriculture percentage alone does not show whether fields form broad zones or scattered patches. Side-by-side maps add the spatial part of the story. For fair comparison, keep the same legend and year in view and avoid mixing a current map from one county with an older map from another.
Download the original JPG maps
The ZIP download contains the four original JPG maps represented by the WebP previews on this page. Each source JPG is 2480×1754 pixels. The package metadata does not mark that size as meeting an A3 high-resolution reference, so the files are best treated as county-scale reference graphics rather than as source material for extreme enlargement. They are still convenient for reports, classroom handouts, slide decks, and normal document layouts when the original aspect ratio is preserved.
- 2025 general land-cover map — best for the full county composition and the relationship among forest, agriculture, wetlands, development, grassland, shrubland, and water.
- Forest and farmland map — best for simplifying the rural pattern and comparing wooded blocks with agricultural and other open cover.
- Impervious surface and developed land map — best for finding concentrated hard surfaces and separating them from the broader developed class.
- 1985–2025 class-difference map — best for locating cells that received different classifications and then checking those places against the current maps.
For printed use, keep the legend readable and avoid stretching the map to fit a different page shape. For screen use, the WebP previews may be enough when only the overall pattern is needed, while the JPGs provide a larger source image for placement in documents. If a project needs coordinates, parcel boundaries, or exact measurements, use the original geospatial datasets or local GIS resources rather than measuring from the exported image.
Limits that matter when the map is used for decisions
Land cover tells what kind of surface is mapped, not what a property is legally allowed to be used for. A developed cell does not specify residential, commercial, industrial, or public use. An agriculture cell does not prove that the parcel is legally designated farmland. Forest cover does not identify ownership or timber status, and a wetland class is not a jurisdictional determination. Those distinctions are essential whenever the map is used outside a general reference or educational setting.
Annual NLCD is raster data, so the landscape is represented as cells rather than surveyed property lines. Mixed pixels are unavoidable where several surfaces occur within a small area. A road may be narrower than a cell; a small stream may blend with nearby vegetation; a forest edge may appear stepped. Classification is a useful generalization, but the color boundary should not be copied as an exact field or parcel boundary.
The observation year is another limitation. The 2025 maps describe the classification for that period and will not capture construction, clearing, vegetation recovery, agricultural rotation, or other changes that occurred later. Historical comparisons add more uncertainty because older and newer imagery can differ. Current local records and field verification are necessary for legal, engineering, or site-specific decisions, while this set remains well suited to countywide interpretation and communication.
Frequently Asked Questions
What is the dominant 2025 land-cover class in Crenshaw County?
Forest is the dominant class at 50.73%. Agriculture is 16.38%, wetlands 12.06%, grassland 7.42%, shrubland 7.22%, developed land 5.70%, and water 0.46%. These are countywide raster-classification percentages, not parcel measurements.
Why is developed cover 5.70% when mean impervious cover is only 0.84%?
Developed land is a broader surface class that can include vegetation and other permeable ground within developed settings. Impervious data estimates the hard-surface share, such as pavement and rooftops, within each cell. A low-density developed area can therefore be classified as developed while still having a low impervious percentage.
Does the 46.93% class difference mean nearly half the county physically changed?
No. It means 46.93% of the compared cells received different land-cover classifications in 1985 and 2025. Some differences reflect real surface change, but imagery, mixed pixels, category boundaries, and classification variation can also contribute. Causes must be checked with other dated evidence.
How can the JPG maps be used?
They are useful for county-level reference, environmental education, presentations, printed handouts, and visual comparison with other maps. They are not substitutes for surveys, zoning records, parcel GIS, wetland determinations, engineering studies, or other authoritative site-specific products.
Map File Information
Crenshaw County land cover map files The ZIP contains all four original JPG maps: 2025 land cover, forest and farmland, impervious surface and developed land, and the 1985–2025 class-difference map.
- Included Files: Use only the versions confirmed in the article and supplied images
- File Type: Use the confirmed download contents
- Intended Use: Printing, education, presentations, and map-based projects
Related Maps
- Autauga County Alabama Land Cover Map
- Baldwin County Alabama Land Cover Map
- Barbour County Alabama Land Cover Map
Sources and reference data
- MRLC Annual NLCD Data — official access to Annual NLCD land-cover products and related datasets.
- USGS Annual NLCD Land Cover Classification — official descriptions of the land-cover classes used to interpret the maps.
- U.S. Census Bureau TIGER/Line Shapefiles — official geographic boundary resources, including county boundaries.
- USDA NASS 2022 Census of Agriculture – Crenshaw County Profile — county-specific agricultural context for cropland, pastureland, woodland, and land in farms.
- Alabama Department of Revenue – County Offices — official county-office information identifying the Crenshaw County courthouse in Luverne.
Green Map creates custom-edited map images using open geographic data sources such as geoBoundaries, Natural Earth, OpenStreetMap, and government open data.
These maps are edited visual materials, not raw data files, and are provided for education, documents, presentations, and graphic reference.