The Merced County California Land Cover Map is dominated by agriculture and grassland, but those two categories do not tell the whole story. The 2025 summary assigns 45.84% of the county to agriculture and 33.20% to grassland, while a broad wetland concentration cuts through the central and western part of the county. Large water bodies near the western edge add another distinctive feature to an otherwise open, farm-oriented landscape.
This page brings together four views: general land cover, forest and farmland, impervious surface and developed land, and mapped class differences between 1985 and 2025. The WebP images are intended for on-page reading, while the four original JPG maps are available together in one ZIP download below. Comparing them side by side makes it easier to separate cropland patterns, wetland concentrations, hard-surface clusters, and long-term classification differences.
Table of Contents
Agriculture leads the 2025 summary, with grassland covering another third
Agriculture accounts for 45.84% of the mapped 2025 land cover, the largest category in the county summary. Grassland follows at 33.20%, then wetlands at 8.59%, developed land at 6.94%, shrubland at 3.30%, water at 1.29%, and forest at 0.29%. The pattern is not a single uniform farm block. Agricultural colors extend across much of the north, center, and southeast, while broad grassland areas are more prominent near the western and eastern margins.
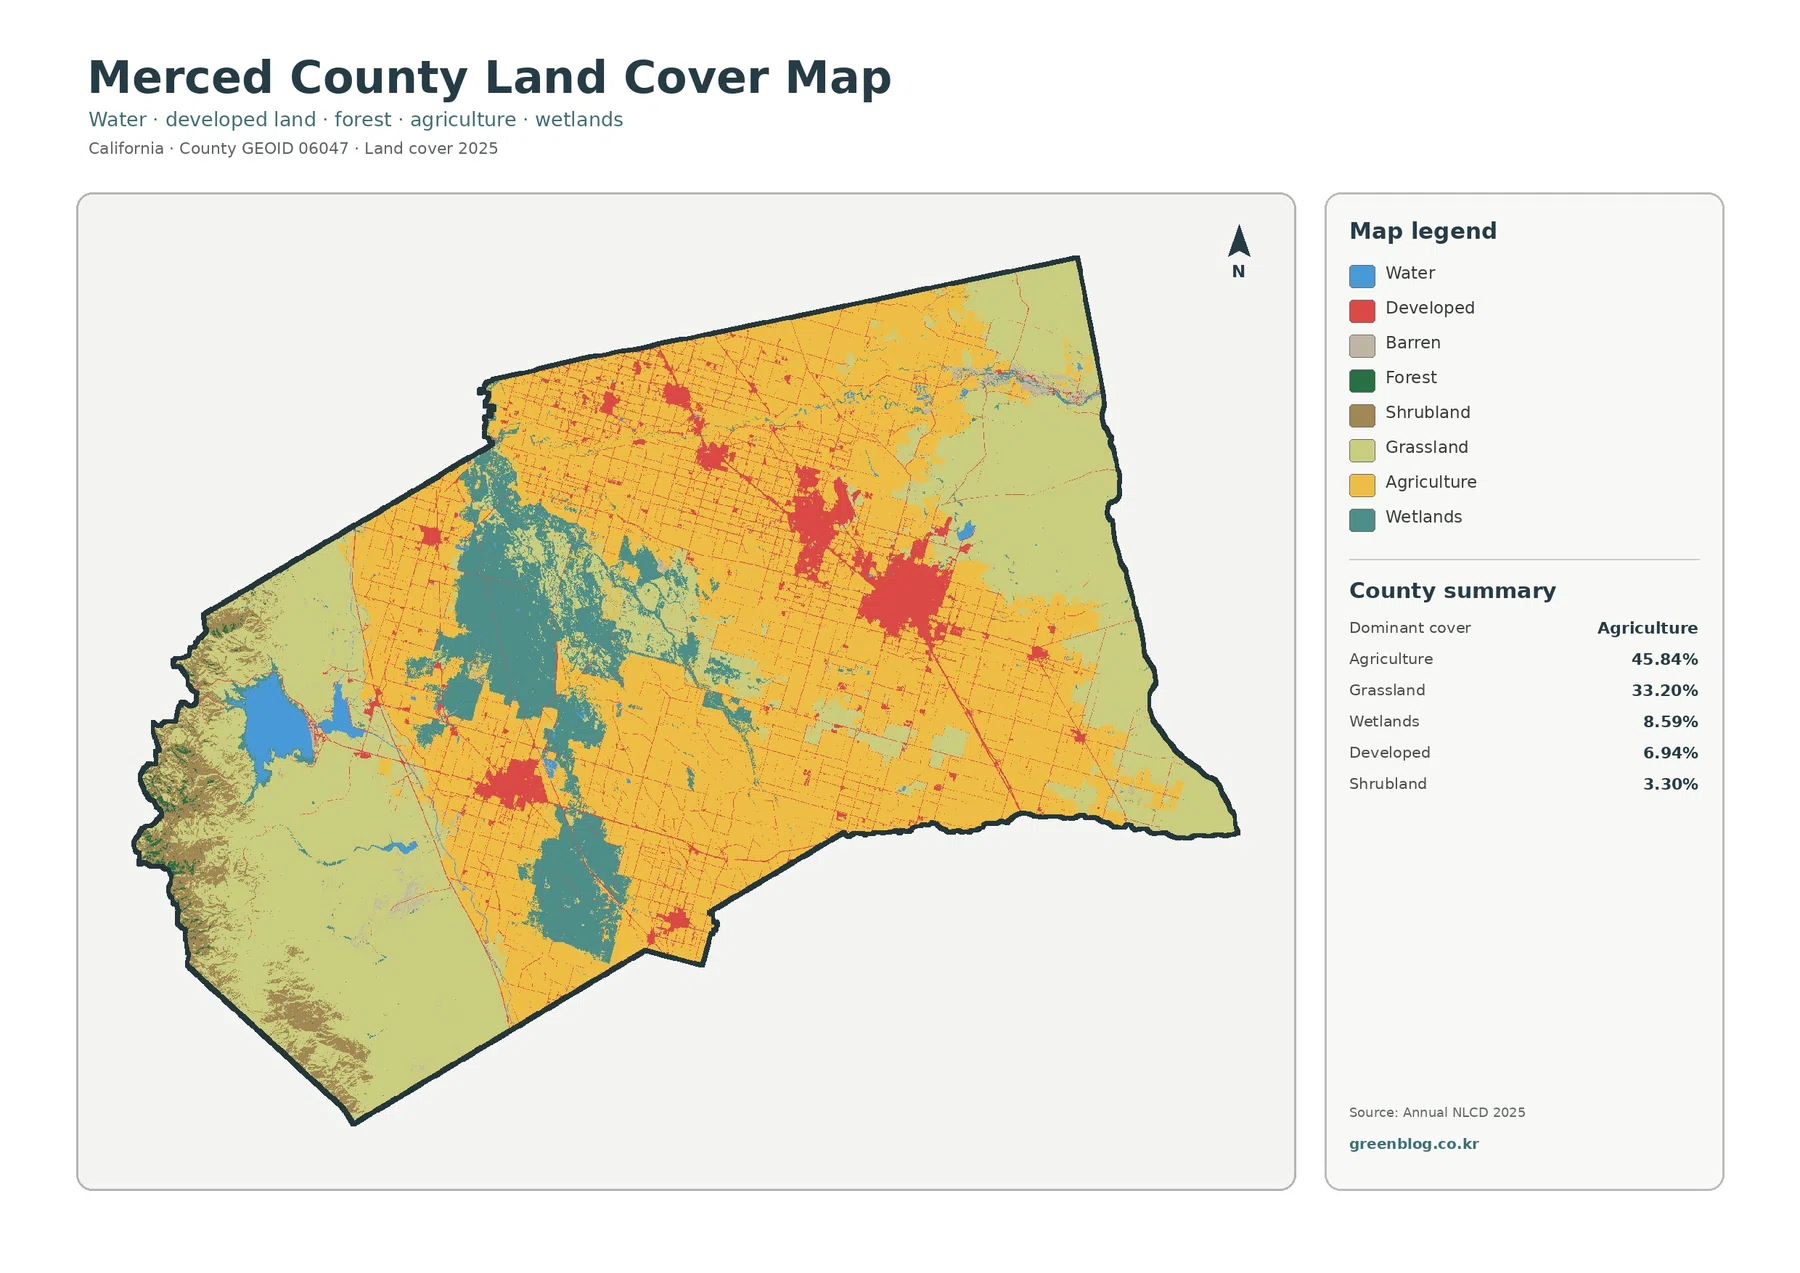
It is important to separate land cover from land use. Merced County’s 2030 General Plan describes agriculture as the dominant land use and says it accounts for more than 90 percent of all land. The Annual NLCD map, by contrast, classifies 45.84% as agricultural cover in 2025. Those figures are not competing estimates of the same thing. A parcel used or designated for agriculture may have grass, wetlands, structures, or other surface cover that falls into a different satellite-based class.
Wetlands interrupt the farm pattern across the center and west
Official U.S. Fish and Wildlife Service descriptions provide context for that pattern. Merced National Wildlife Refuge contains wetlands, native grasslands, vernal pools, and riparian areas. The Grasslands Wildlife Management Area is located in western Merced County within the San Joaquin River basin and protects wetland and grassland habitat along with wildlife-friendly agricultural lands. These protected and managed areas should not be treated as exact boundaries of the NLCD wetland pixels, but they help explain why wetlands are such a visible part of the county landscape. California DWR also identifies San Luis Reservoir and O’Neill Forebay as major water facilities in Merced County, matching the prominent western water setting.
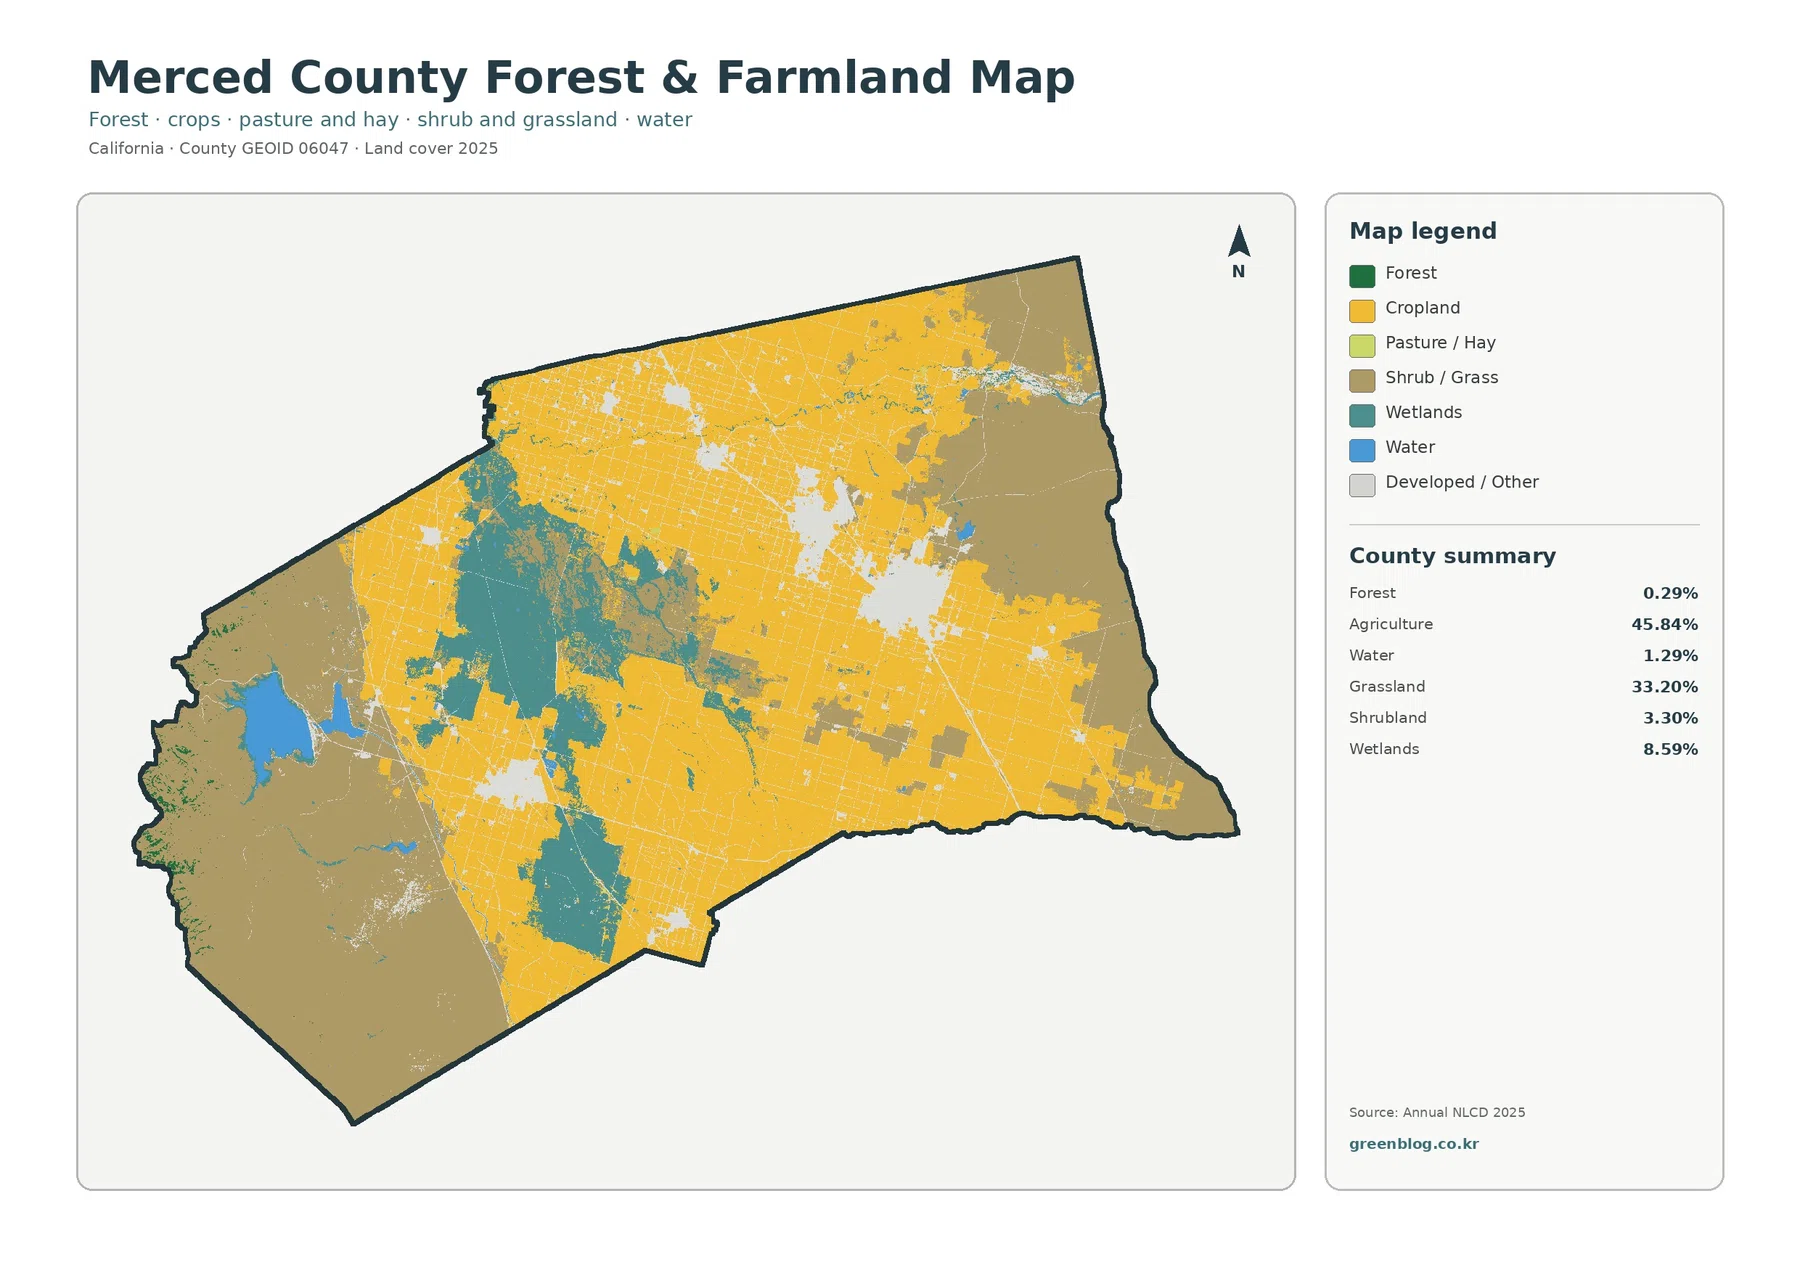
The forest-and-farmland view simplifies the county into fields, open land, and wet areas
The forest-and-farmland map is especially useful here because forest is only 0.29% of the county summary. Instead of a contest between woods and fields, the main comparison is agriculture versus grassland, shrubland, wetlands, and water. Agriculture remains 45.84%, grassland 33.20%, wetlands 8.59%, shrubland 3.30%, and water 1.29%. That makes Merced County visually different from forest-dominated counties where the same map type is organized around large wooded blocks.
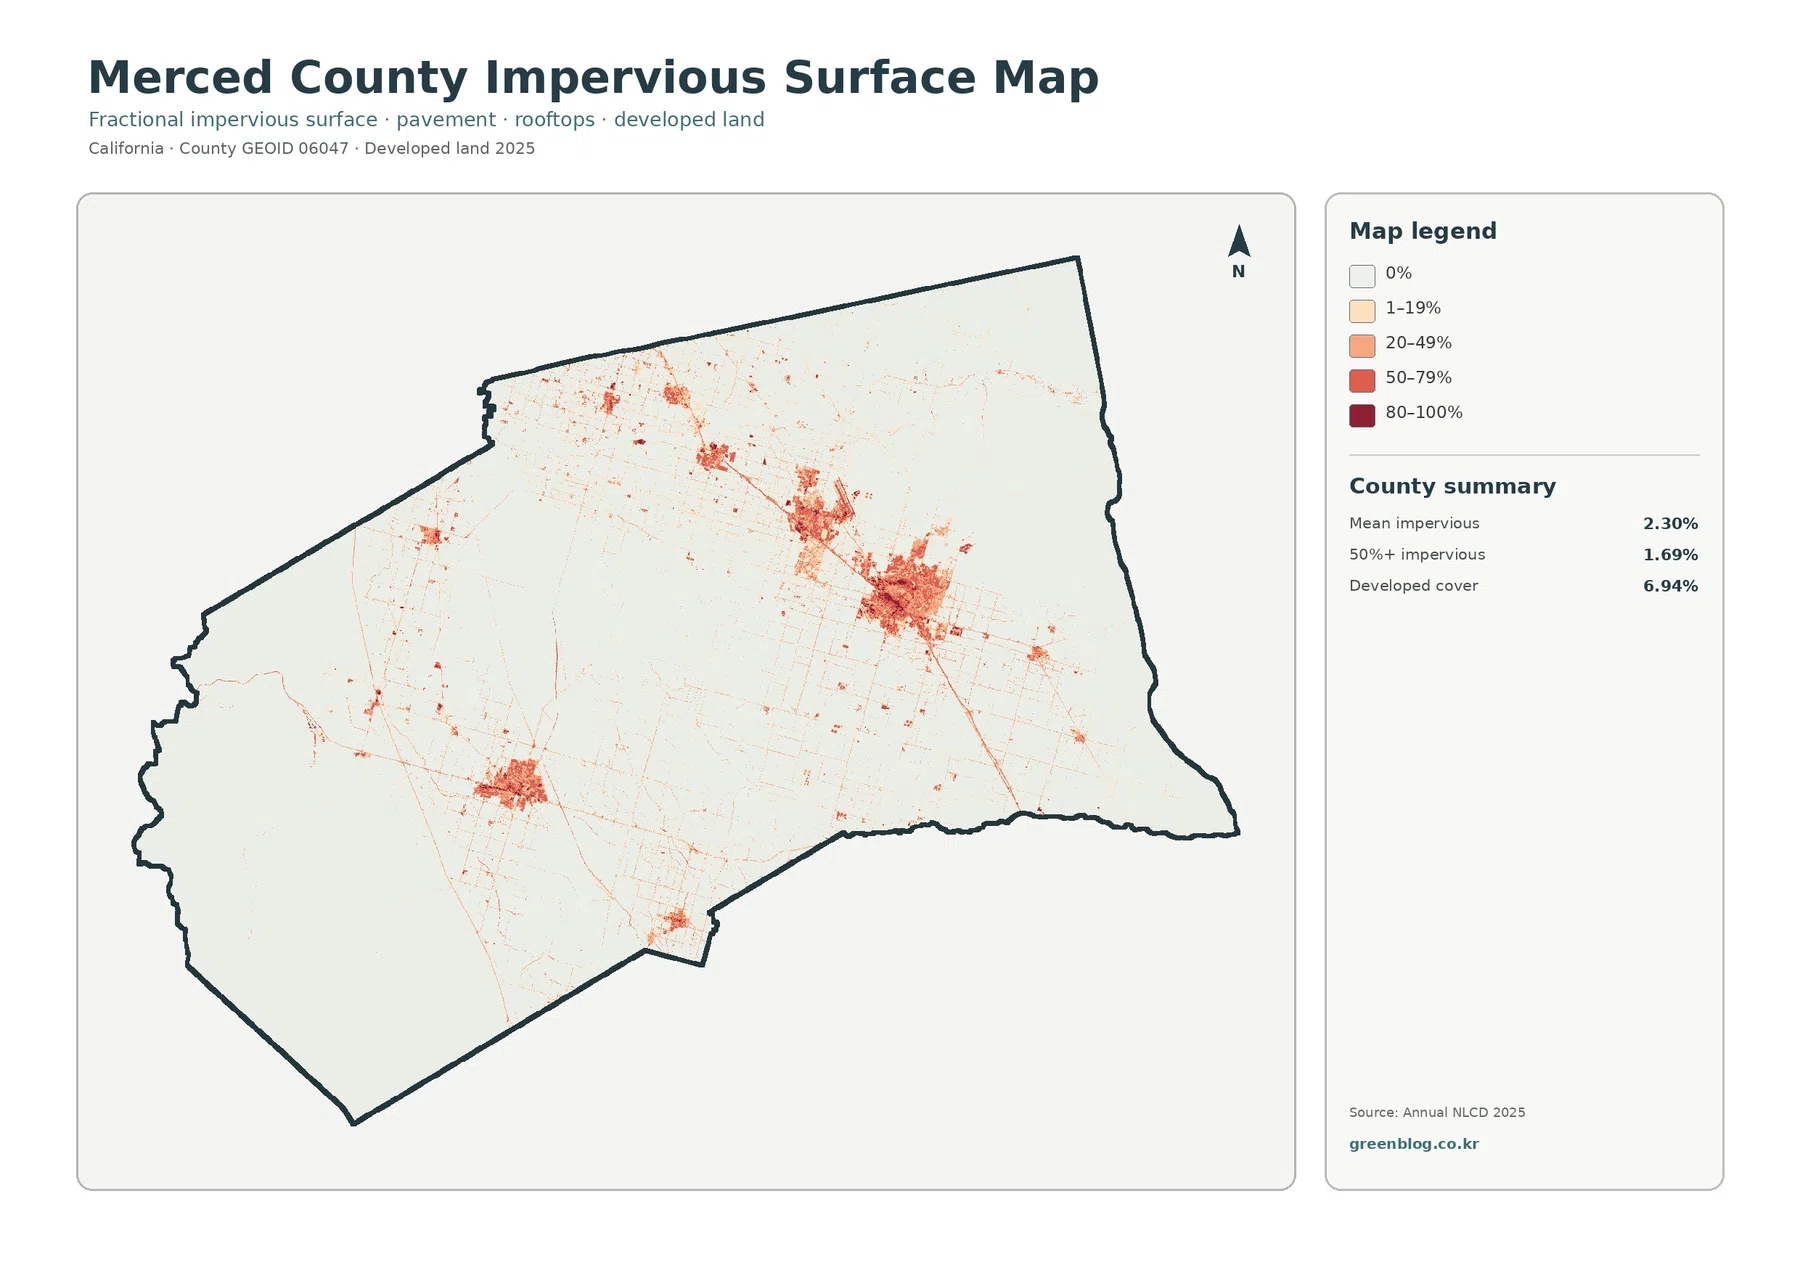
A 2.30% mean impervious surface highlights a few concentrated developed areas
Impervious surface means rooftops, pavement, parking areas, and similar surfaces that do not readily absorb water. Merced County’s mean impervious value is 2.30%, while 1.69% of the county is mapped at 50% impervious or higher. Developed land covers 6.94% in the general land-cover summary. The difference between those figures is expected because a developed land-cover class can contain lawns, trees, bare ground, and other surfaces that are not fully paved.
The 12.11% 1985–2025 class difference is not a simple development total
The change map reports that 12.11% of the county has a different mapped class when 1985 and 2025 are compared. The summary lists 5.70% as other class difference, 2.99% as classified to developed, 2.53% as agricultural loss, and 0.04% as forest loss. Wetland difference also appears as its own legend category. The important point is that the full 12.11% cannot be described as urban growth; it is a combination of several mapped transition categories.
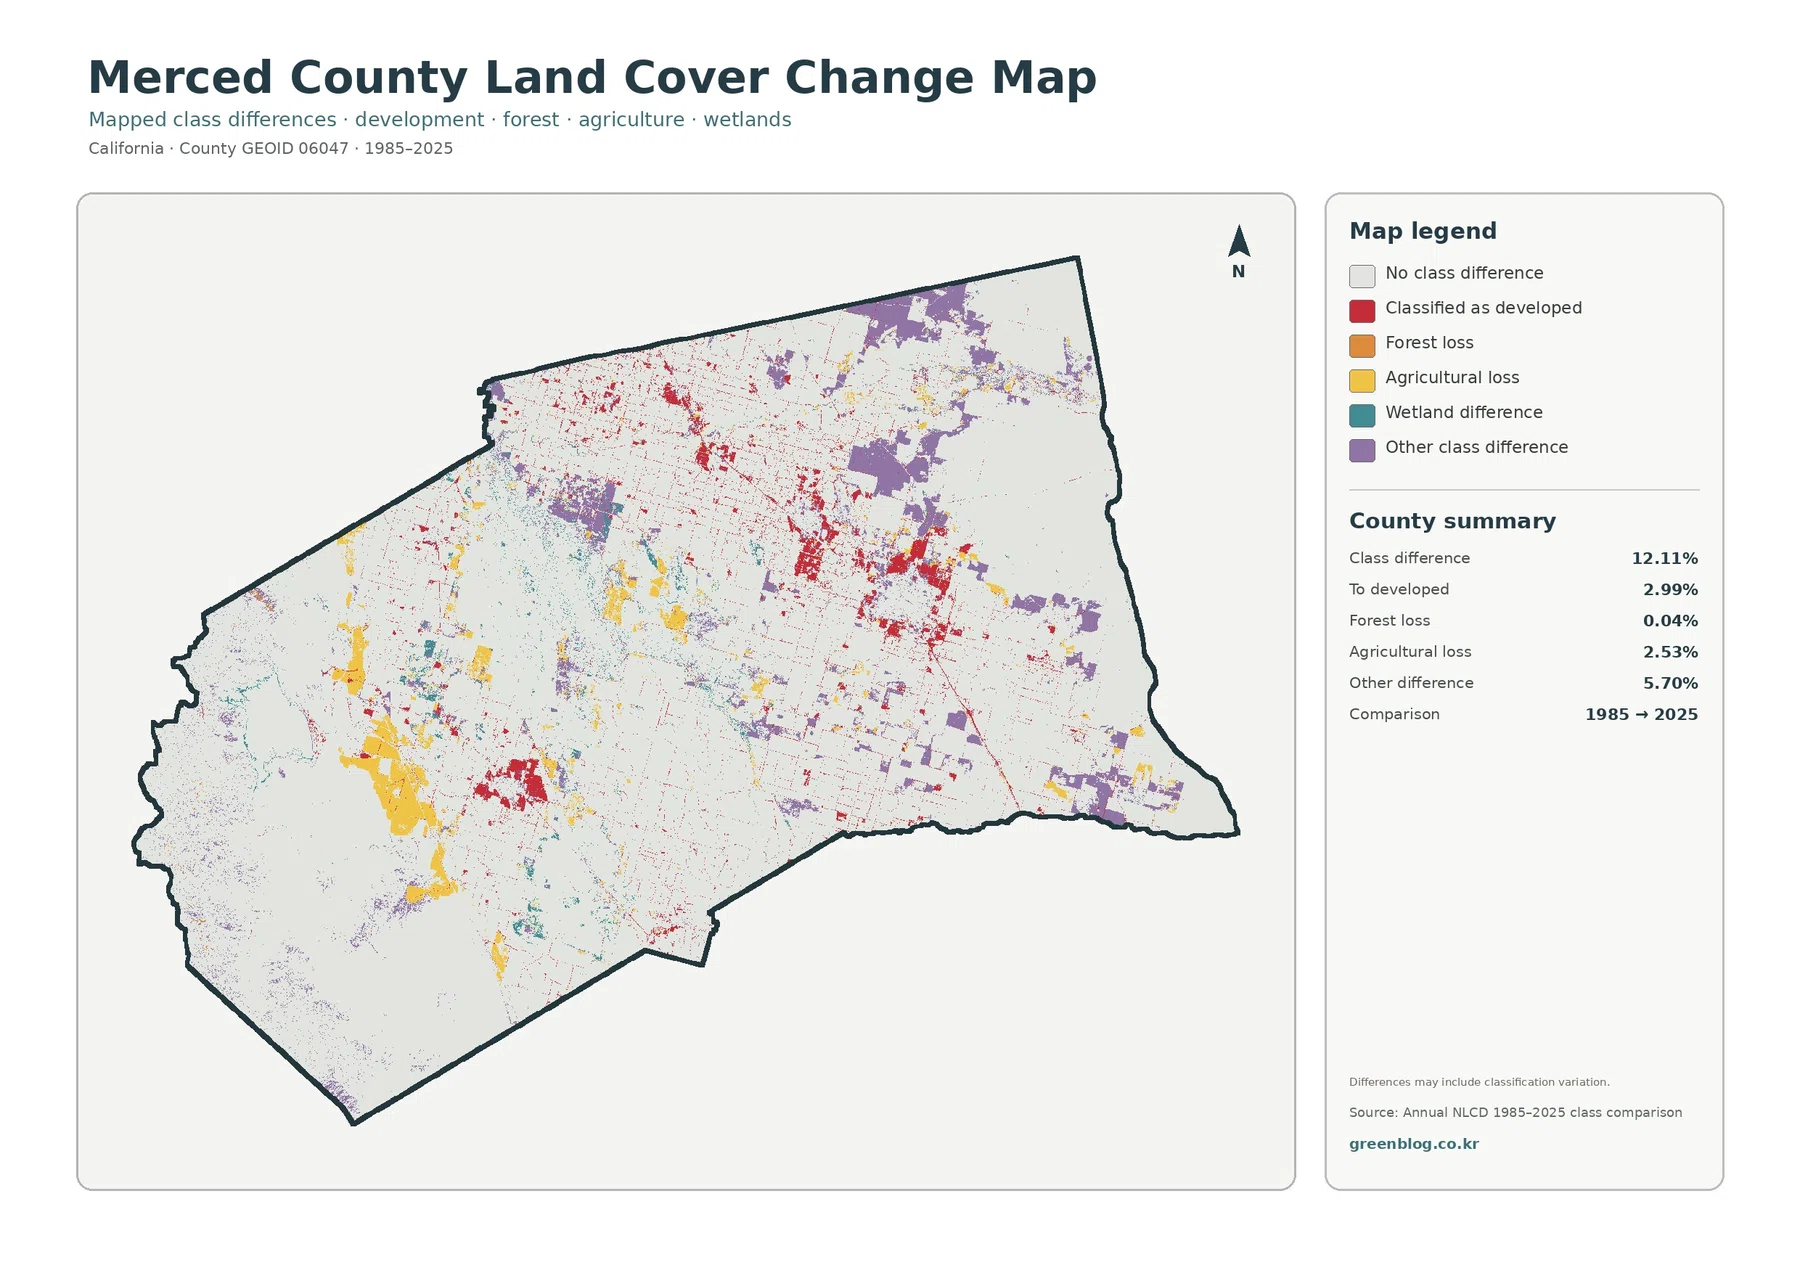
The change map itself warns that mapped differences can include classification variation. Actual land-cover change may be part of the signal, but image conditions, mixed pixels, and differences in classification can also affect the result. A mixed pixel is a 30-meter cell containing more than one surface type. If a location needs to be investigated in detail, intermediate-year imagery, local development records, agricultural records, wetland-management information, and field evidence are better tools for identifying the cause of a particular change.
How to choose among the four maps
Start with the general land-cover map when you need the overall proportions and the broad relationship among agriculture, grassland, wetlands, water, and developed land. Move to the forest-and-farmland version when the goal is to simplify the palette and focus on the farm pattern against open and wet areas. In Merced County, that second view is particularly helpful because forest contributes so little to the total and the more meaningful contrast is between agriculture and the surrounding grassland-wetland landscape.
Download details and original JPG size
Each JPG is 2480×1754 pixels, which is the original source size recorded in the package manifest. That is below the 4961×3508 pixels normally associated with A3 at 300 dpi. The files are suitable for screens, documents, classroom use, and smaller prints, but large-format printing may reveal softness after enlargement. This page therefore describes the actual supplied dimensions rather than promising a higher resolution than the files contain.
Keep the 30-meter grid and land-use distinction in mind
Annual NLCD Collection 1.2 provides raster land-cover and impervious-surface products through 2025 for the conterminous United States. Raster data divide the landscape into cells and assign a representative class or value to each one; the core spatial resolution is 30 meters. A single cell can contain crops, grass, pavement, buildings, or water together, so the mapped class is a generalized representation rather than a parcel survey.
Frequently Asked Questions
What is the largest land-cover category in Merced County?
Agriculture is the largest 2025 category at 45.84%, followed by grassland at 33.20%. Wetlands account for another 8.59% and developed land for 6.94%. The map therefore shows a farm-dominated county, but the central-western wetland concentration and extensive grassland are large enough that they should be considered alongside the agriculture percentage.
Why does the General Plan describe more than 90% agricultural land use while NLCD maps 45.84% agricultural cover?
The two sources measure different things. The General Plan discusses land use and planning, while Annual NLCD classifies the physical surface visible in remotely sensed data. Land used or designated for agriculture can contain grass, wetlands, buildings, roads, or other surfaces that fall into different land-cover classes. The percentages are therefore not expected to match.
Does the 12.11% class difference mean exactly 12.11% of the county was physically transformed?
No. It means 12.11% is mapped in a different class when the 1985 and 2025 endpoint classifications are compared. Real changes can contribute to that result, but classification variation, mixed pixels, and image conditions can also matter. A specific change should be checked with intermediate imagery and local records before assigning a cause.
Map File Information
The four original Merced County land-cover JPG maps are provided together in one ZIP file.
- Included Files: Use only the versions confirmed in the article and supplied images
- File Type: Use the confirmed download contents
- Intended Use: Printing, education, presentations, and map-based projects
Related Maps
- Alameda County California Land Cover Map
- Alpine County California Land Cover Map
- Amador County California Land Cover Map
Sources and references
- MRLC Annual NLCD Data — Annual NLCD Collection 1.2 land-cover and impervious-surface data access
- USGS Annual NLCD Land Cover Classification — reference for the land-cover classes used in Annual NLCD
- Merced County 2030 General Plan — official county context for agricultural land use, natural resources, and wetlands
- California Department of Water Resources — San Luis — official description of San Luis Reservoir and O’Neill Forebay in Merced County
- U.S. Fish & Wildlife Service — Merced National Wildlife Refuge — wetland, grassland, vernal-pool, and riparian context
- U.S. Fish & Wildlife Service — Grasslands Wildlife Management Area — western Merced County wetland and grassland conservation context
Green Map creates custom-edited map images using open geographic data sources such as geoBoundaries, Natural Earth, OpenStreetMap, and government open data.
These maps are edited visual materials, not raw data files, and are provided for education, documents, presentations, and graphic reference.