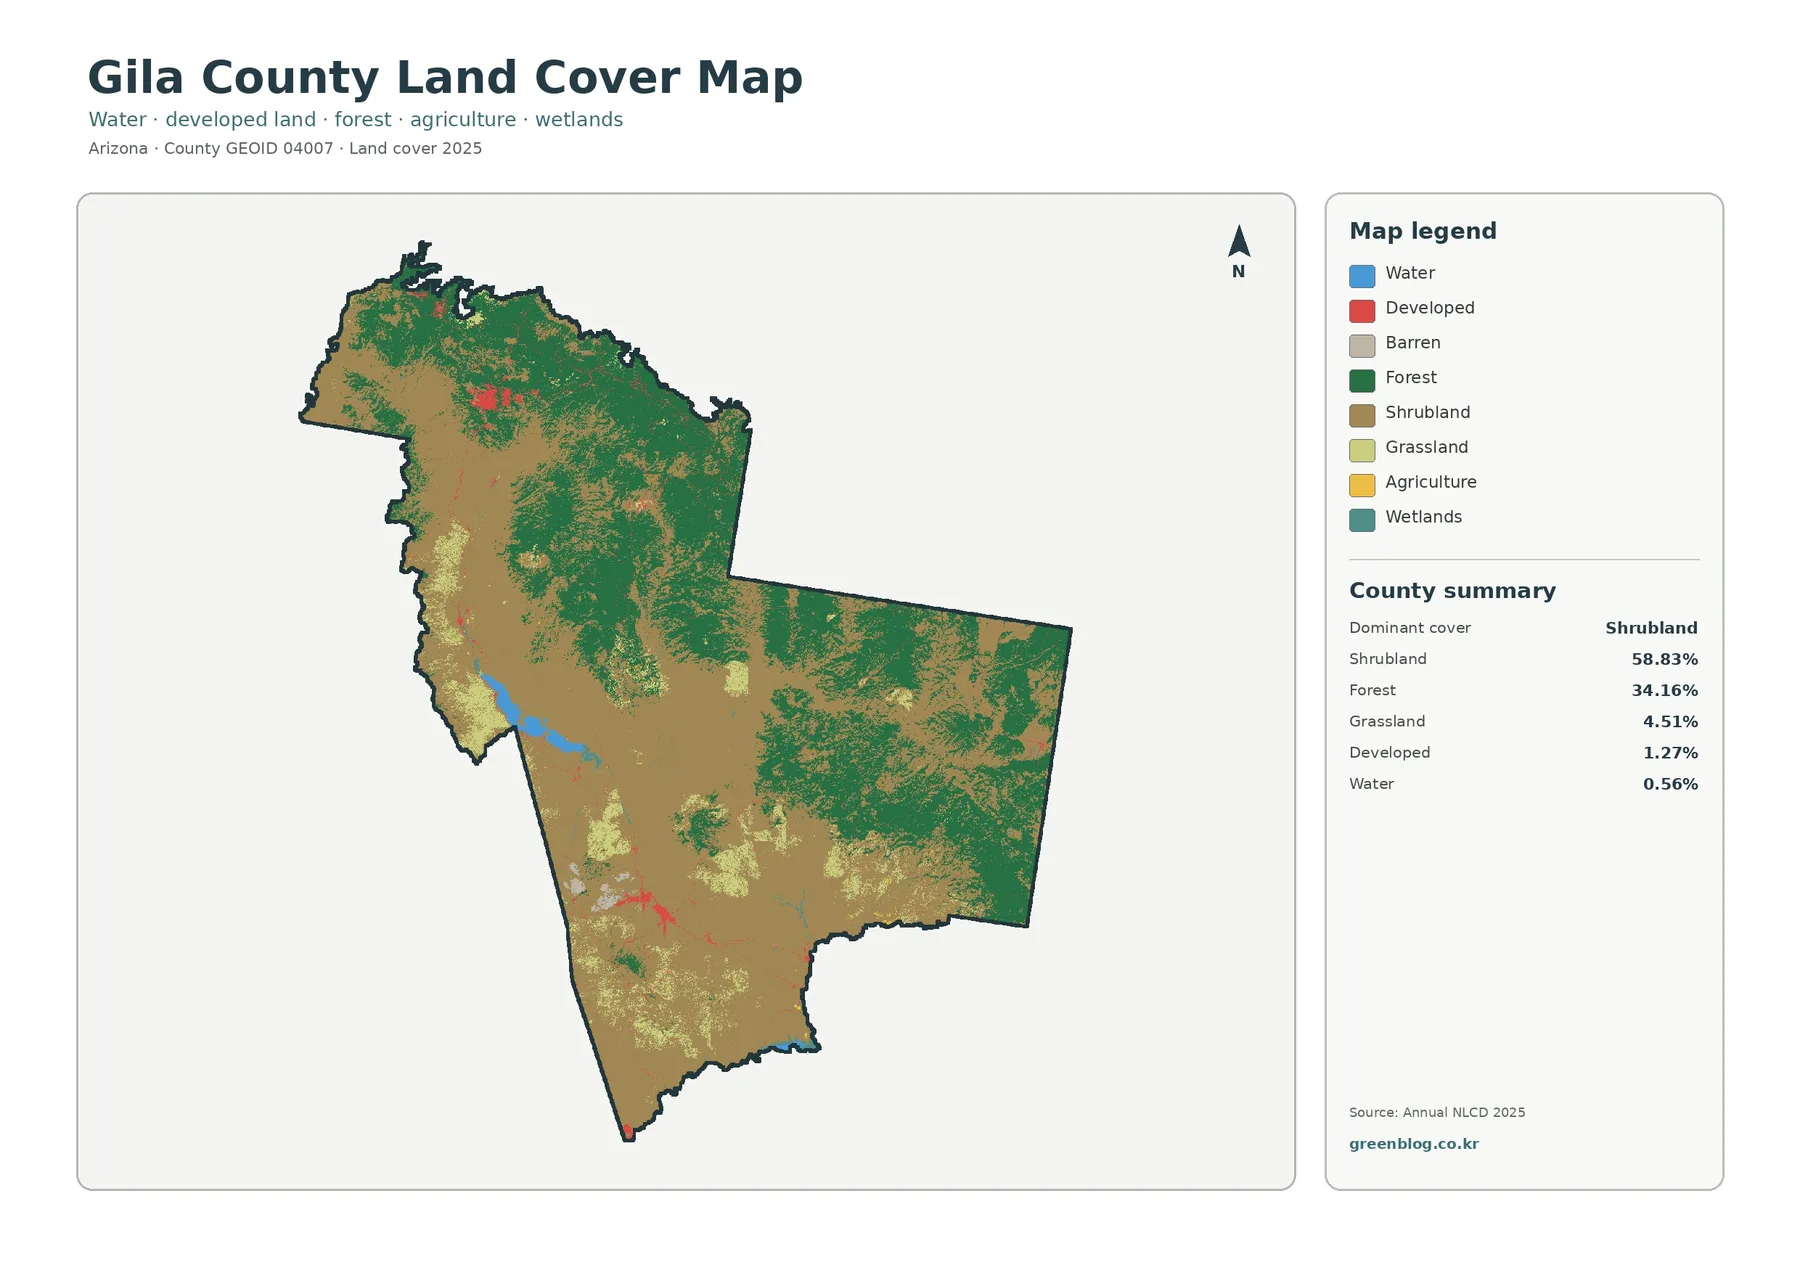
The Mendocino County California Land Cover Map is dominated by forest, but the county does not look uniform from the Pacific side to the interior. Forest accounts for 60.14 percent of the 2025 summary, while shrubland and grassland areas become more noticeable toward the eastern and northeastern portions of the county.
This page compares general land cover, forest and farmland, impervious surface, and 1985–2025 mapped class differences. The four WebP images are arranged for on-page comparison, and the four original JPG maps are available together in one ZIP download for reference, classroom work, documents, and presentations.
Table of Contents
Forest covers most of the county, yet the interior breaks that pattern
Forest is the largest 2025 land-cover group at 60.14 percent. Shrubland follows at 25.13 percent and grassland at 9.32 percent. Developed cover accounts for 3.01 percent, while agriculture is 1.29 percent. Those numbers explain the broad green appearance of the map, but the percentages alone hide an important geographic contrast: the western and central portions are much more continuously forested than the far eastern side.
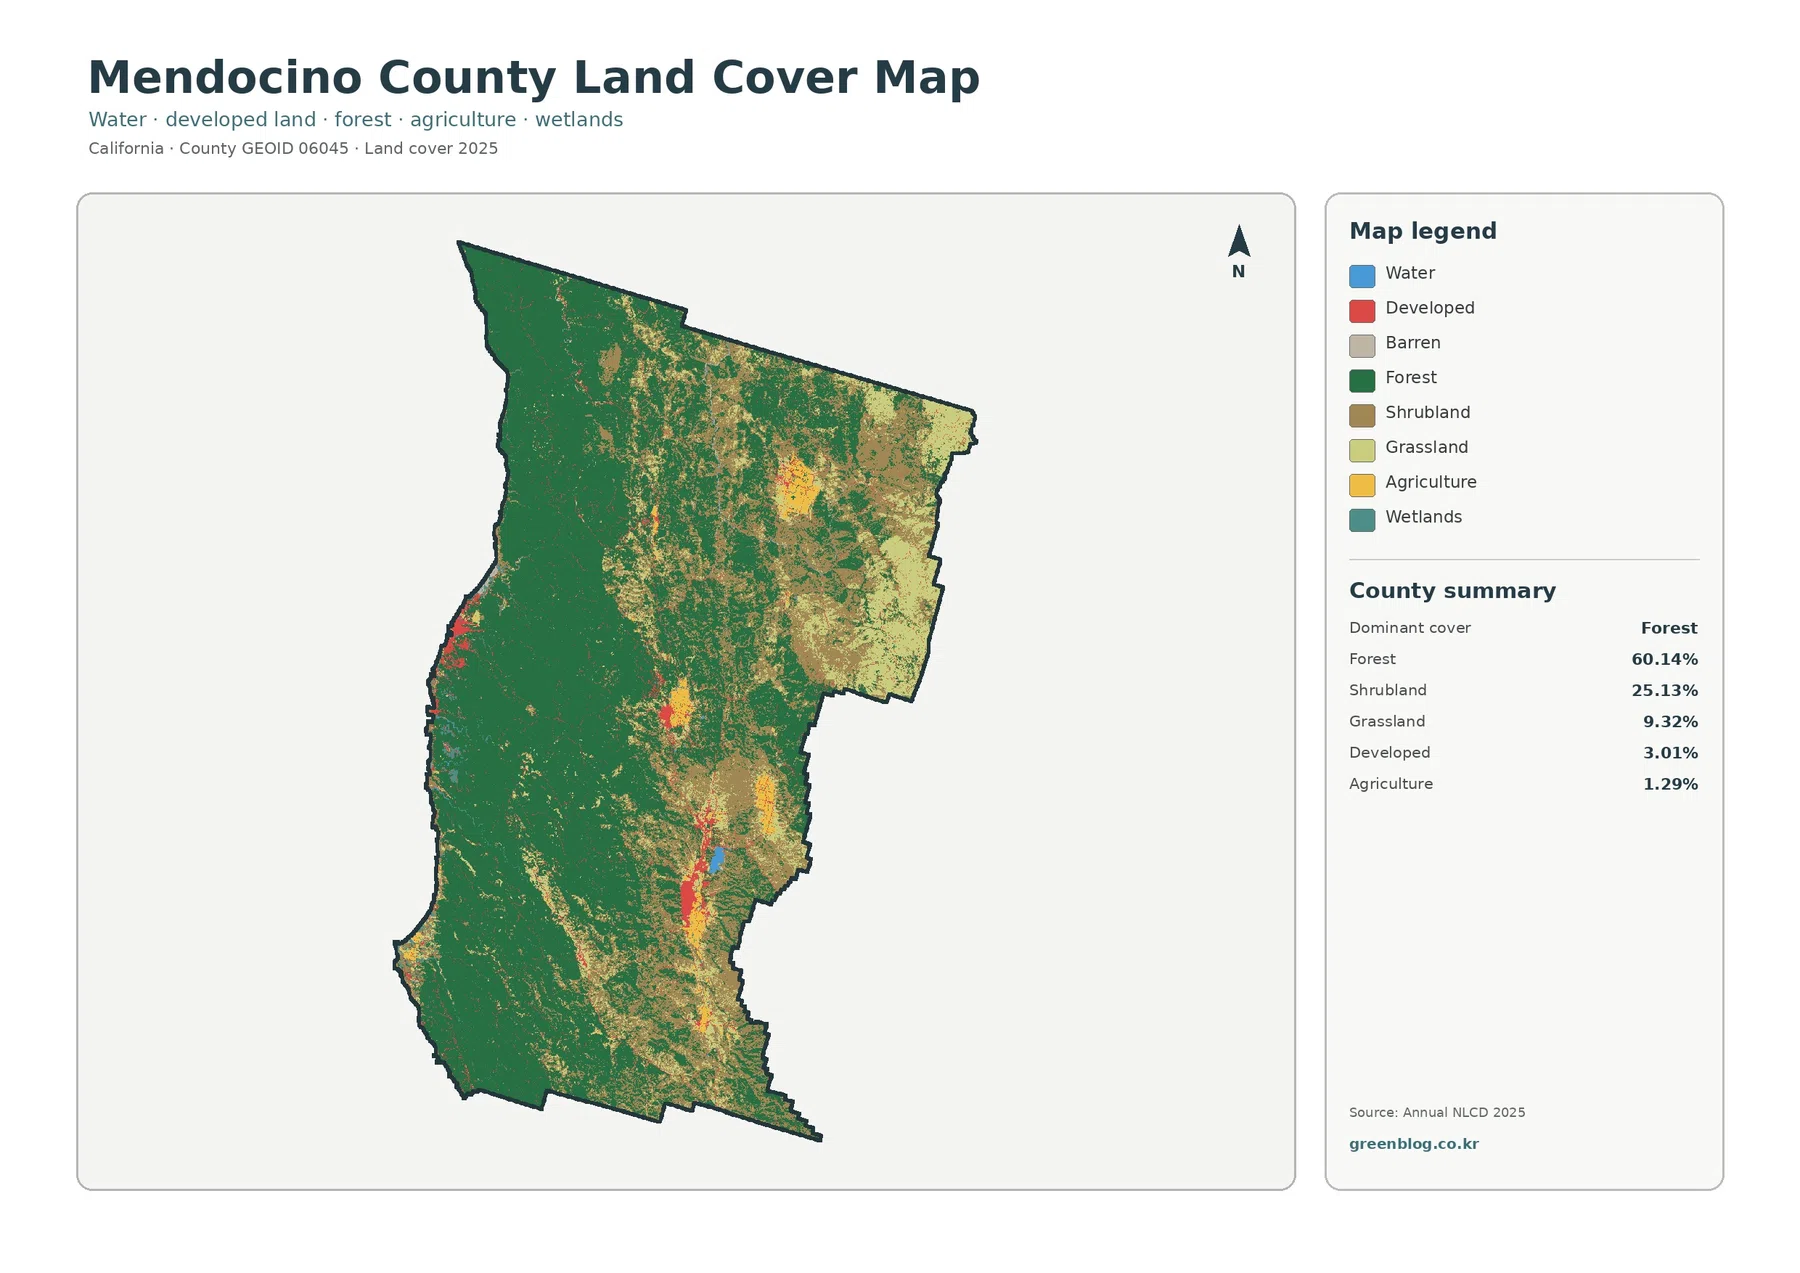
Large forest blocks fill much of the coast-facing and central terrain. Brown shrubland and pale grassland are more extensive in the northeast and east, where they mix with smaller green patches. Developed pixels appear as compact clusters and thin traces rather than one continuous urban field. Agriculture is also concentrated in small interior patches, so its pattern is easier to understand by looking at location rather than by reading the countywide percentage alone.
Hard-surface mapping makes the main settlement areas easier to separate from forest
Fractional impervious surface estimates how much of each mapped cell is covered by hard materials such as roofs, pavement, and parking areas. Mendocino County’s mean impervious value is 0.64 percent in 2025, and only 0.27 percent of the county is in the 50-percent-or-higher impervious group. Developed land is 3.01 percent, which is larger because a developed cell can still contain trees, lawns, soil, and other permeable surfaces.
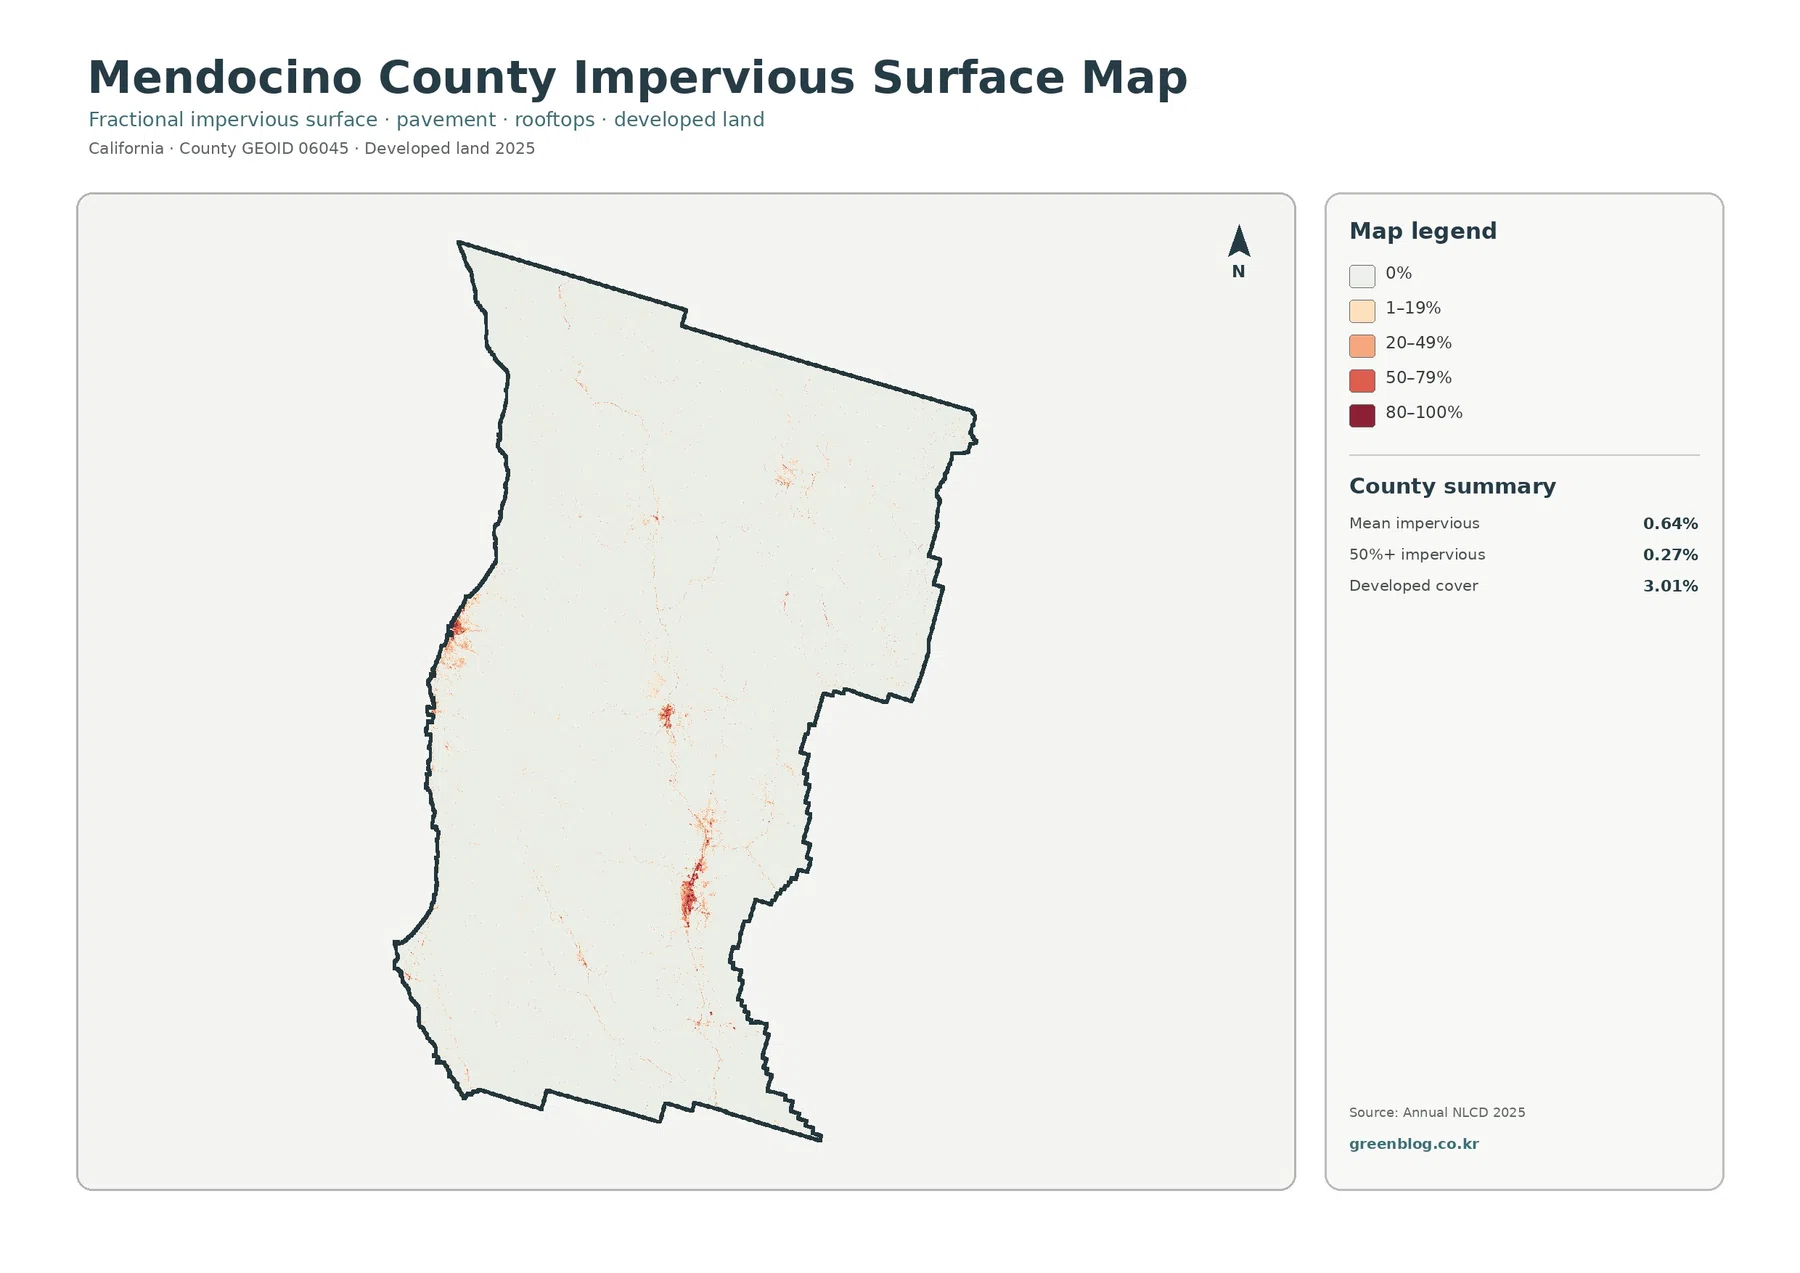
The map is almost white across the large forested and open areas. A much stronger red and orange cluster appears in the south-central interior valley where Ukiah is located. Smaller concentrations occur along the coast and in northern interior settlement areas. Mendocino County planning materials separately address the Ukiah Valley, Fort Bragg area, and Willits area, which provides useful place context for these concentrated built surfaces without turning the impervious map into a municipal-boundary map.
A 1.29% agriculture class can coexist with important farming valleys
The forest-and-farmland view reports 60.14 percent forest, 25.13 percent shrubland, 9.32 percent grassland, 1.29 percent agriculture, 0.63 percent wetlands, and 0.23 percent water. The agriculture share is small at county scale, yet yellow and light-green agricultural patches appear in several interior valley areas. Against the surrounding forest and shrub cover, these clusters stand out more clearly in this simplified map than they do in the general land-cover view.
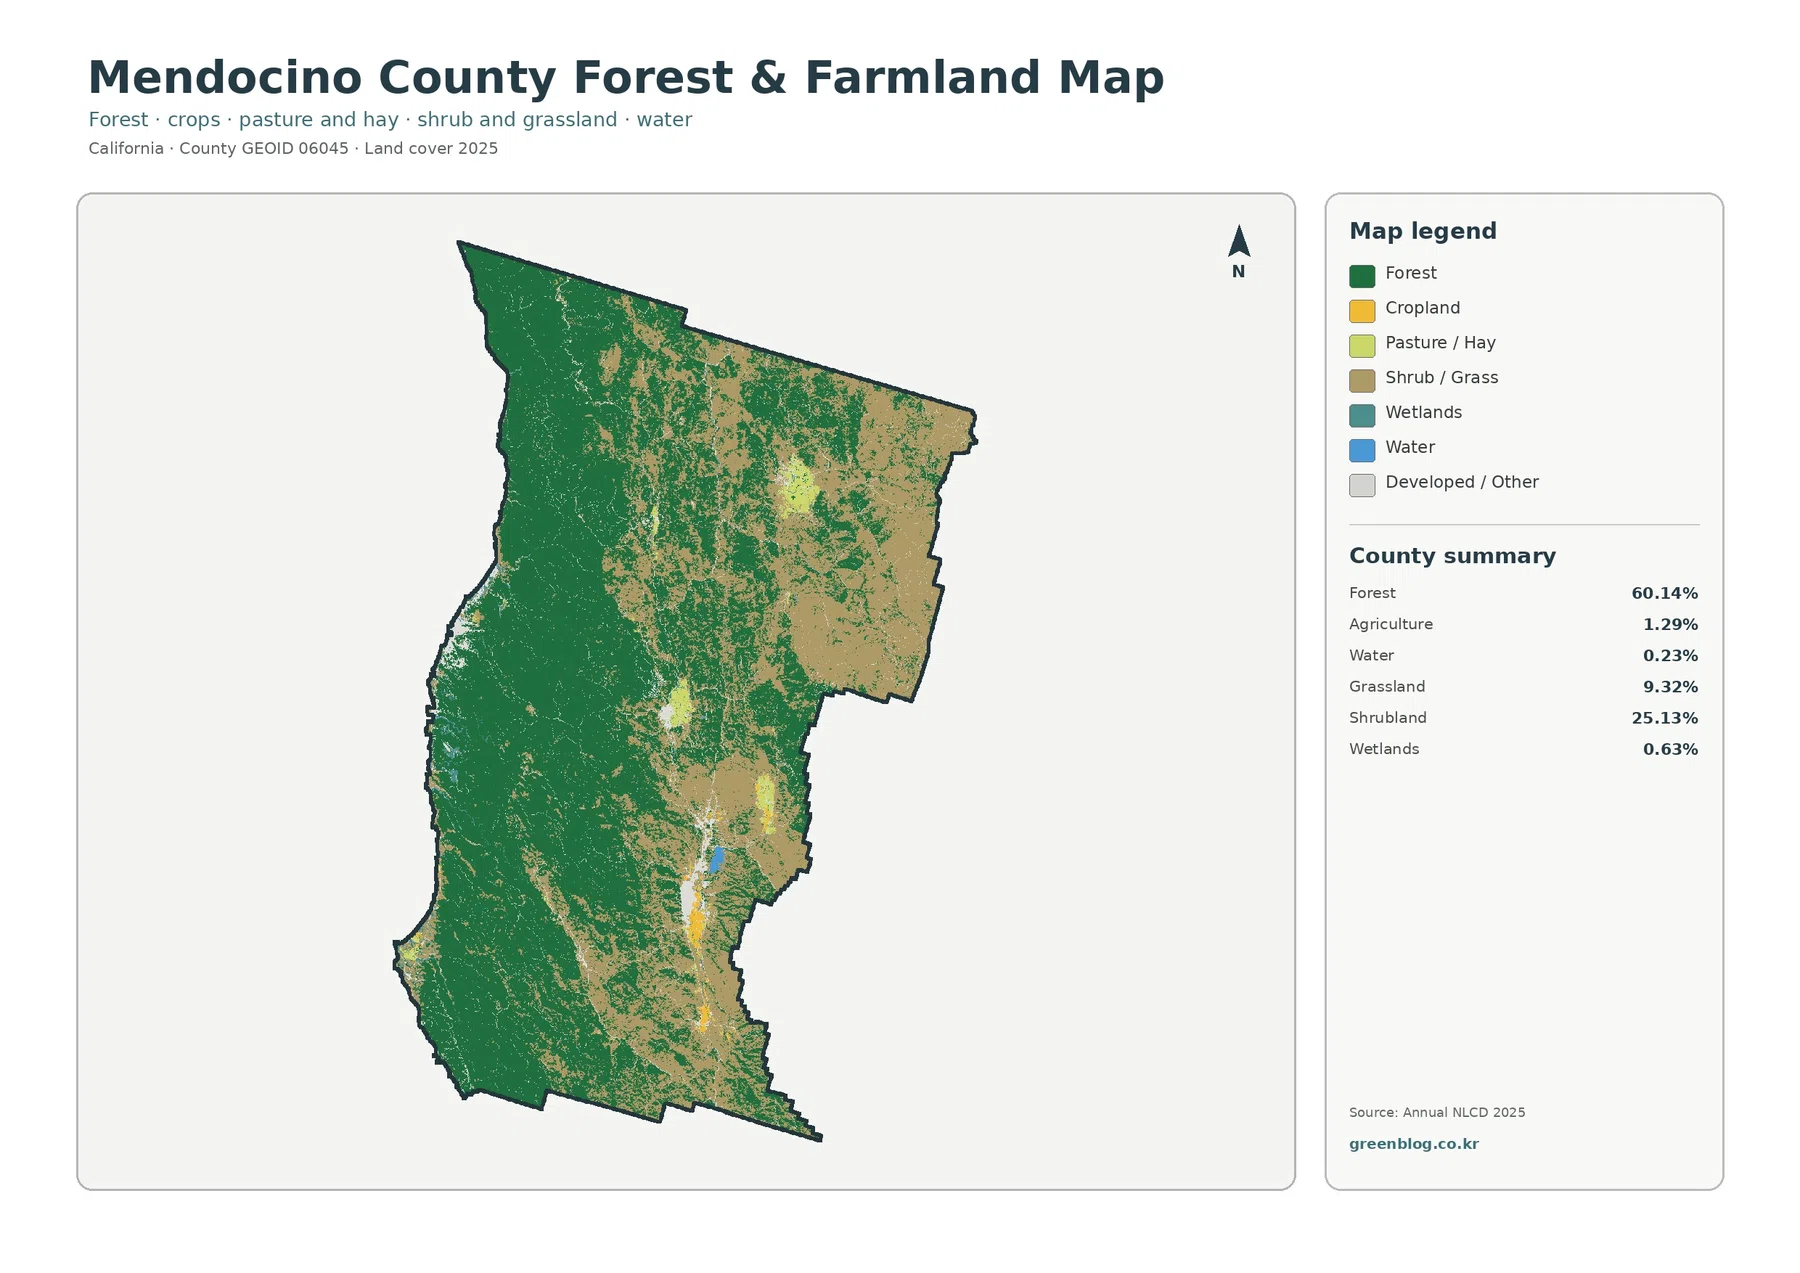
The county’s Resource Management Element discusses agricultural soils and uses in the Ukiah, Hopland, Covelo, Potter, Redwood, Willits, Laytonville, and Anderson valley areas. That planning information is useful because it shows why an NLCD agriculture percentage should not be read as a complete inventory of the agricultural economy. Ranch land may look like grassland, and land managed for agriculture can fall into another surface class if crops are not the predominant cover of a 30-meter cell.
The 1985–2025 layer marks 15.98% as a class difference, not a single kind of change
The long-term comparison marks 15.98 percent of Mendocino County as having a different mapped class between 1985 and 2025. The largest listed component is other class difference at 8.52 percent. The forest-loss category is 6.23 percent, areas classified as developed account for 0.82 percent, and agricultural loss is 0.38 percent. The legend also includes wetland difference, but the map summary does not provide a separate percentage for that category.
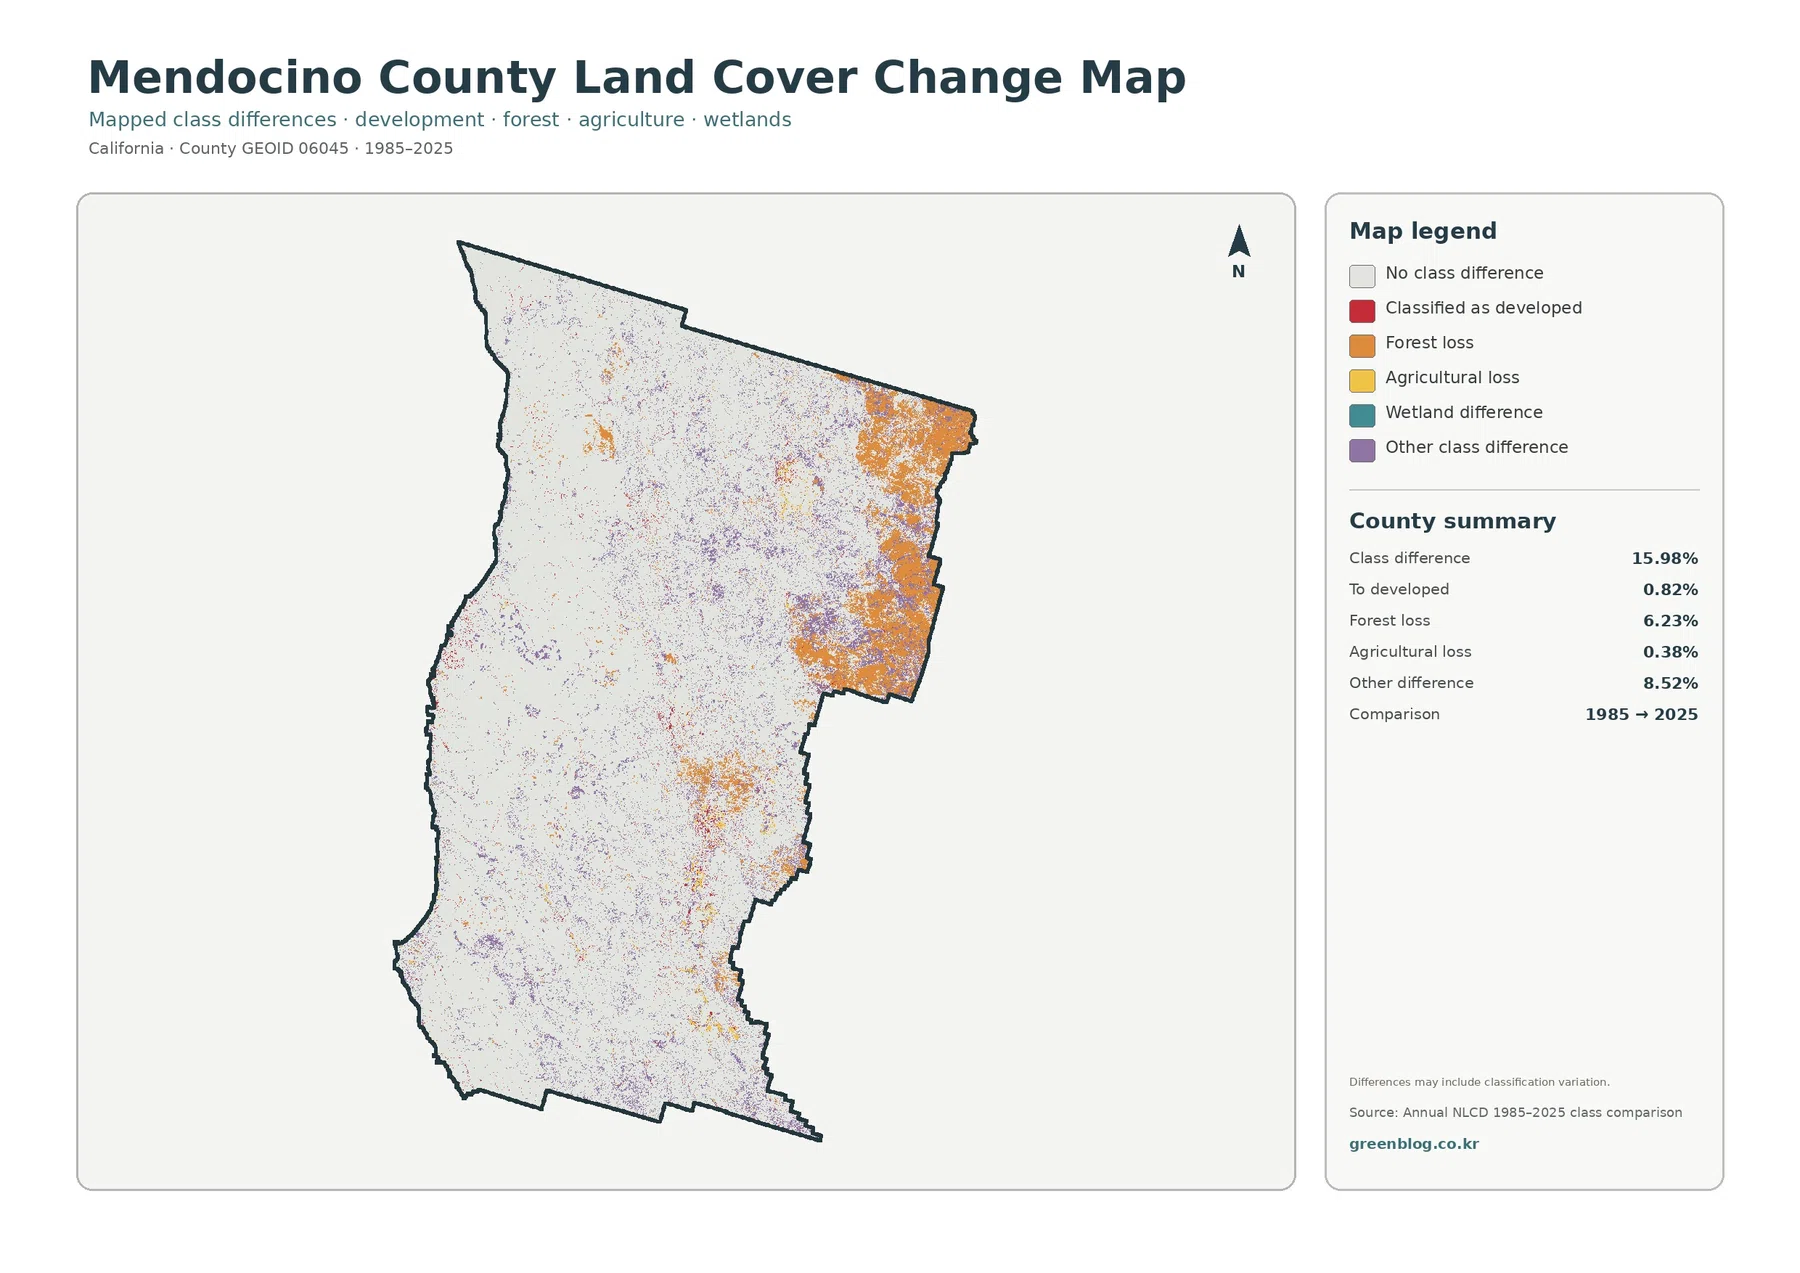
Orange forest-loss patches are especially prominent in parts of the eastern and northeastern interior, with smaller areas elsewhere. Purple other-difference pixels are more widely scattered. Red areas classified as developed are much more limited and tend to appear near existing settlement patterns. This distribution matters because the 15.98 percent total is not a countywide statement that one land-cover type replaced another everywhere.
The map itself notes that class differences may include classification variation. A real change in vegetation or built cover can be present, but image conditions, mixed pixels, and classification behavior can also affect a two-date comparison. A forest-loss color therefore should not automatically be described as logging, wildfire, or permanent deforestation. Those explanations require annual imagery, fire history, forestry records, or field evidence for the location being studied.
Coastal forest and inland valleys provide context without changing what the legend means
Mendocino County’s planning and public-information pages emphasize both coastal redwood forest and inland valleys. The General Plan also contains community-specific policies for places including Anderson Valley, Covelo, Hopland, Laytonville, Potter Valley, Redwood Valley, and the Willits area, plus separate planning for the Ukiah Valley and the coast. That geographic variety helps explain why the map changes from extensive forest to more mixed shrub, grass, agricultural, and developed cover across relatively short distances.
A useful way to compare all four Mendocino County maps
Begin with the general land-cover map when you need the broadest view. It establishes the 60.14 percent forest dominance and shows where shrubland, grassland, development, and agriculture interrupt that cover. The forest-and-farmland version is better when the question is how forest relates to open land and the small agricultural patches in interior valleys.
Map File Information
Each JPG is 2480×1754 pixels, which is the original source size recorded in the county asset manifest. That is below the 4961×3508 pixels associated with an A3 page at 300 dpi. The files work well for screens, ordinary documents, classroom materials, and smaller prints, while large-format printing should be checked for enlargement limits before use.
Resolution, date, and land-use limits matter when the map is enlarged
Annual NLCD Collection 1.2 extends the conterminous U.S. annual product series through 2025 and uses a 30-meter raster grid. A raster divides the landscape into cells and assigns each cell a representative class or value. Trees, grass, bare ground, pavement, and a structure can all occur inside one cell, so the displayed result is a generalized surface description rather than an inventory of every object on the ground.
Frequently Asked Questions
What is the dominant land cover in Mendocino County in 2025?
Forest is the dominant class at 60.14 percent. Shrubland is second at 25.13 percent and grassland is 9.32 percent. The forest is not evenly distributed, however. It is especially extensive across the western and central portions of the county, while shrub and grass cover become more prominent in parts of the eastern interior.
Why does the map show only 1.29% agriculture in a county with vineyards and other farming?
The 1.29 percent figure is an NLCD surface-cover classification, not an agricultural land-use or economic statistic. Mendocino County’s planning documents discuss farming in several inland valleys, and the county publishes annual crop reports. Ranches, working lands, and mixed agricultural properties may appear as grassland, shrubland, forest, or another surface class depending on what predominates in the mapped cell.
Does the 6.23% forest-loss category mean that 6.23% of the county was confirmed as logged or deforested?
No. It is a category in the 1985–2025 class comparison. Real forest change may contribute, but the change map warns that classification variation can also be included. Determining whether a particular area changed because of wildfire, timber harvest, vegetation recovery, development, or another process requires additional evidence beyond this two-date map.
Map File Information
Download the four original Mendocino County land-cover JPG maps together in one ZIP file.
- Included Files: Use only the versions confirmed in the article and supplied images
- File Type: Use the confirmed download contents
- Intended Use: Printing, education, presentations, and map-based projects
Related Maps
- Alameda County California Land Cover Map
- Alpine County California Land Cover Map
- Amador County California Land Cover Map
Sources and References
- MRLC Annual NLCD Data — Annual NLCD data access
- MRLC Annual NLCD Project — 1985–2025 product information
- USGS Annual NLCD Land Cover Classification — land-cover class definitions
- Mendocino County Current General Plan — county planning and resource context
- Mendocino County Crop Reports — county agricultural statistics
Green Map creates custom-edited map images using open geographic data sources such as geoBoundaries, Natural Earth, OpenStreetMap, and government open data.
These maps are edited visual materials, not raw data files, and are provided for education, documents, presentations, and graphic reference.