The Mariposa County California Land Cover Map set shows a county dominated by open shrubland, forest, and grassland rather than continuous development. The 2025 map changes noticeably from the open western and southwestern side to the more heavily forested Sierra terrain farther east.
Four views are provided: overall land cover, forest and farmland, fractional impervious surface, and mapped class differences from 1985 to 2025. The four original JPG files are also available together in one ZIP for reference, classroom work, presentations, or printing.
Table of Contents
A county where shrubland and forest cover nearly seven-tenths of the surface
The 2025 summary puts shrubland first at 39.00 percent and forest second at 30.87 percent. Grassland adds another 25.59 percent. Developed land accounts for only 2.49 percent, while barren cover is 1.07 percent. Those values explain why the county outline is filled mainly with brown, green, and pale grassland colors instead of the red tones used for developed areas.
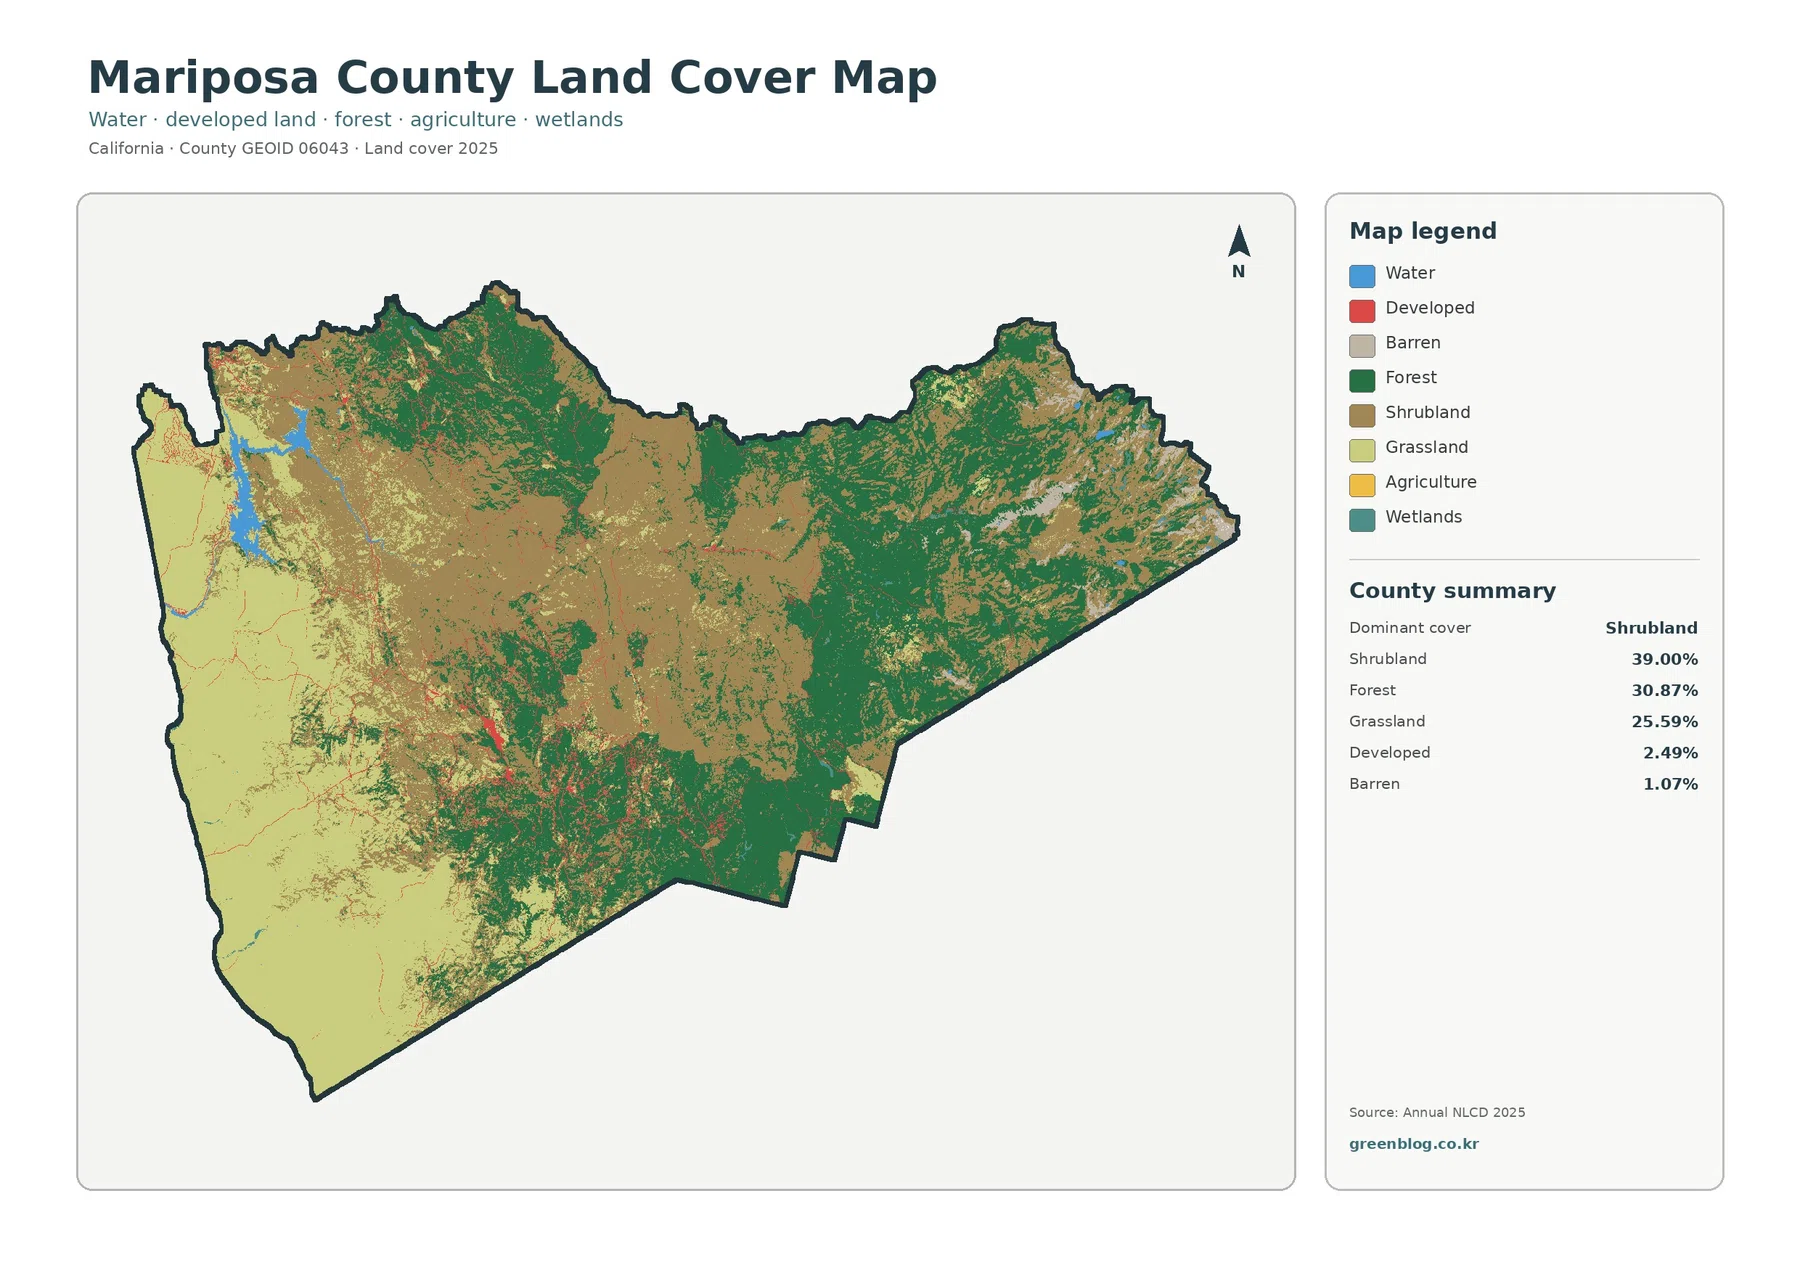
The spatial contrast matters as much as the percentages. Broad grassland occupies much of the western and southwestern portion of the county. Shrubland spreads across large interior areas and mixes with forest on the slopes. Forest becomes more continuous in the east and southeast, where the map shows large green blocks rather than isolated patches. Developed pixels remain small and scattered, often appearing as short lines or compact clusters within a much larger natural landscape.
The impervious map makes the county’s limited built footprint easier to see
Fractional impervious surface measures the share of a pixel covered by hard surfaces such as pavement and rooftops. Mariposa County’s 2025 mean impervious value is only 0.40 percent, and just 0.05 percent of the county falls in the 50-percent-or-higher impervious category. That is much smaller than the 2.49 percent classified as developed land because a developed pixel can still contain vegetation, soil, or other permeable surfaces.
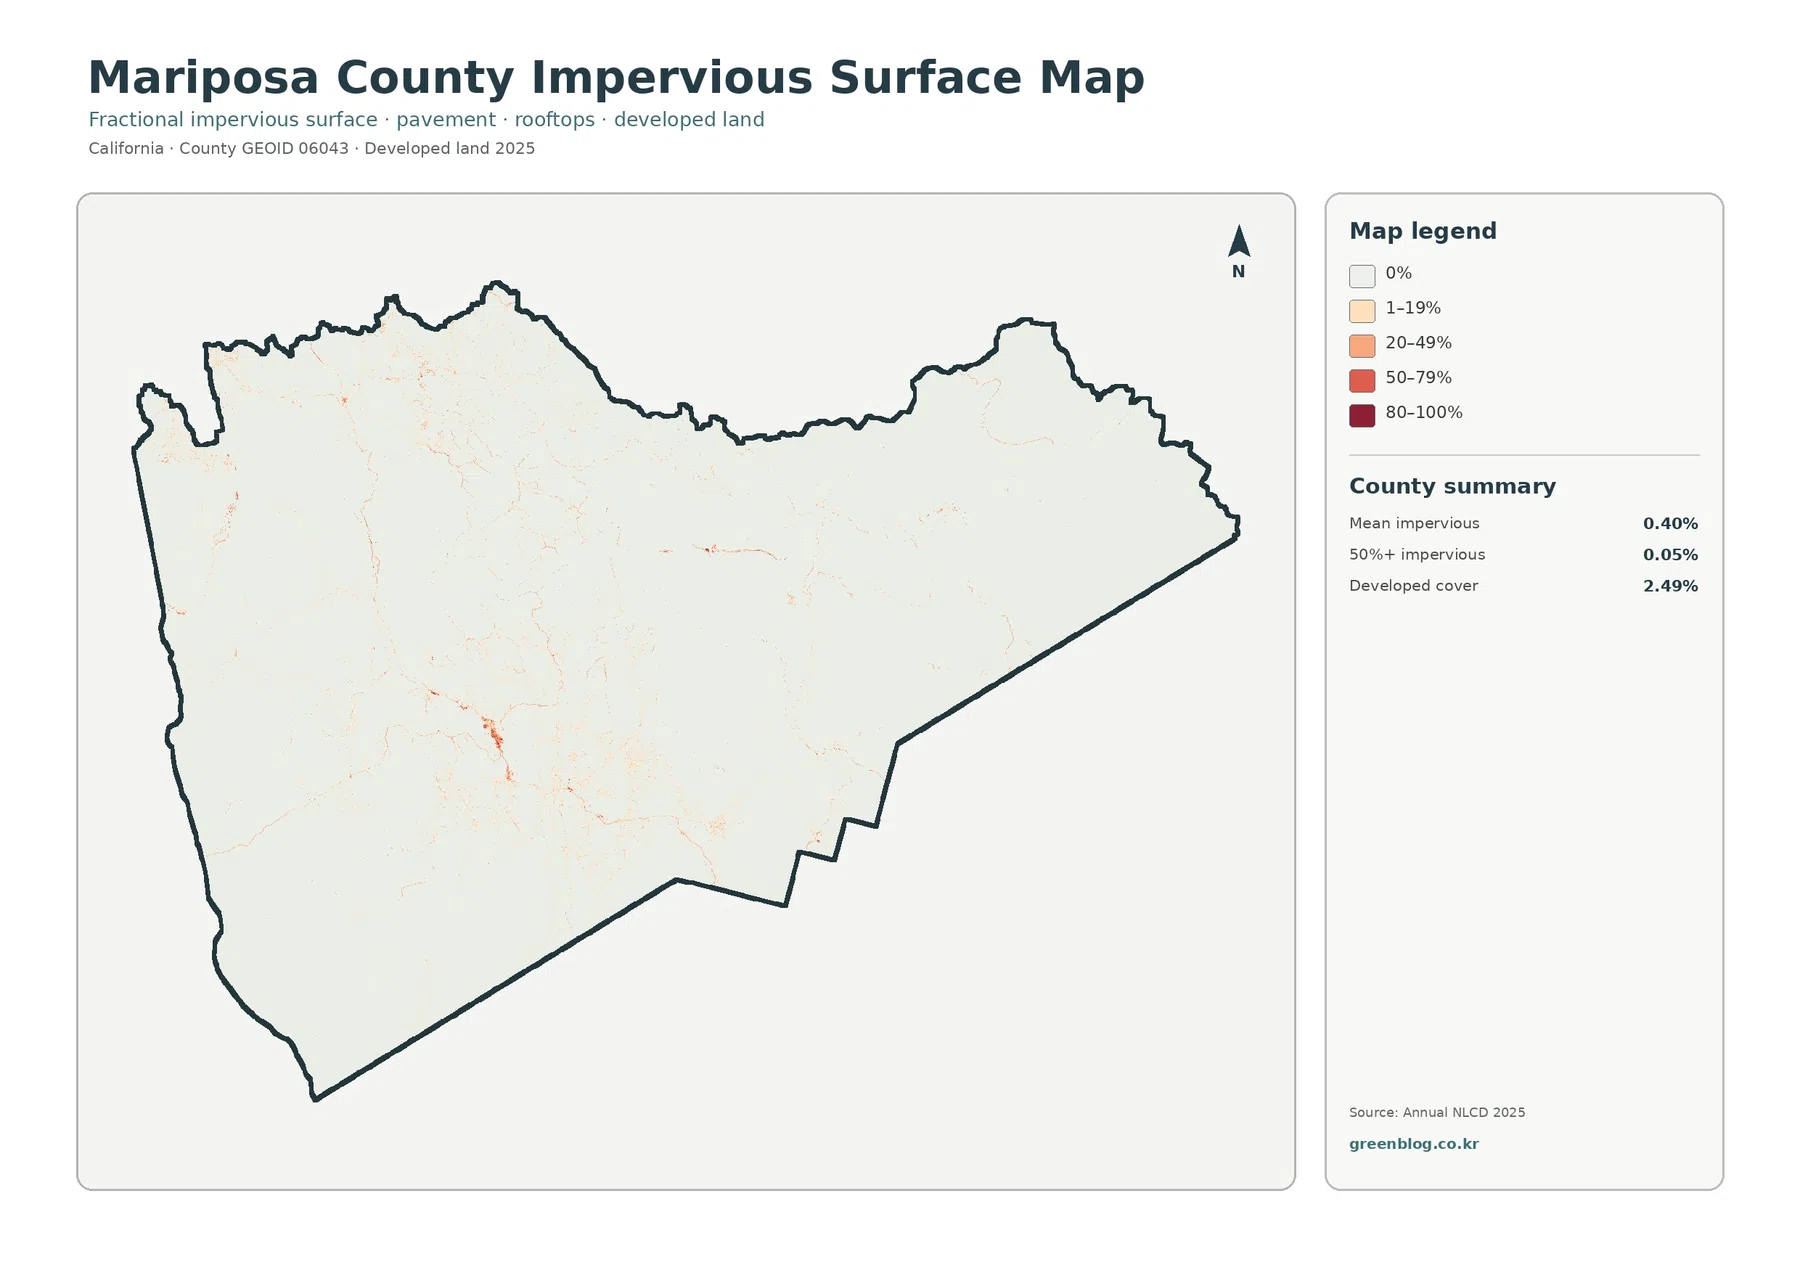
Most of the map therefore appears nearly white. Orange and red marks are sparse, with a few small concentrations in the central and western portions of the county and thin linear traces elsewhere. The map does not label roads or community boundaries, so those marks are best read as areas with more hard surface rather than as exact outlines of a town, highway, or parcel.
Why the forest-and-farmland map reports 0.00% agriculture
The forest-and-farmland view reports 30.87 percent forest, 25.59 percent grassland, 39.00 percent shrubland, 0.69 percent water, and 0.29 percent wetlands. Agriculture is shown as 0.00 percent. That number can be surprising in a rural California county, but it describes an NLCD land-cover class rather than the amount of land used for ranching, agricultural businesses, or land designated for agricultural policy.
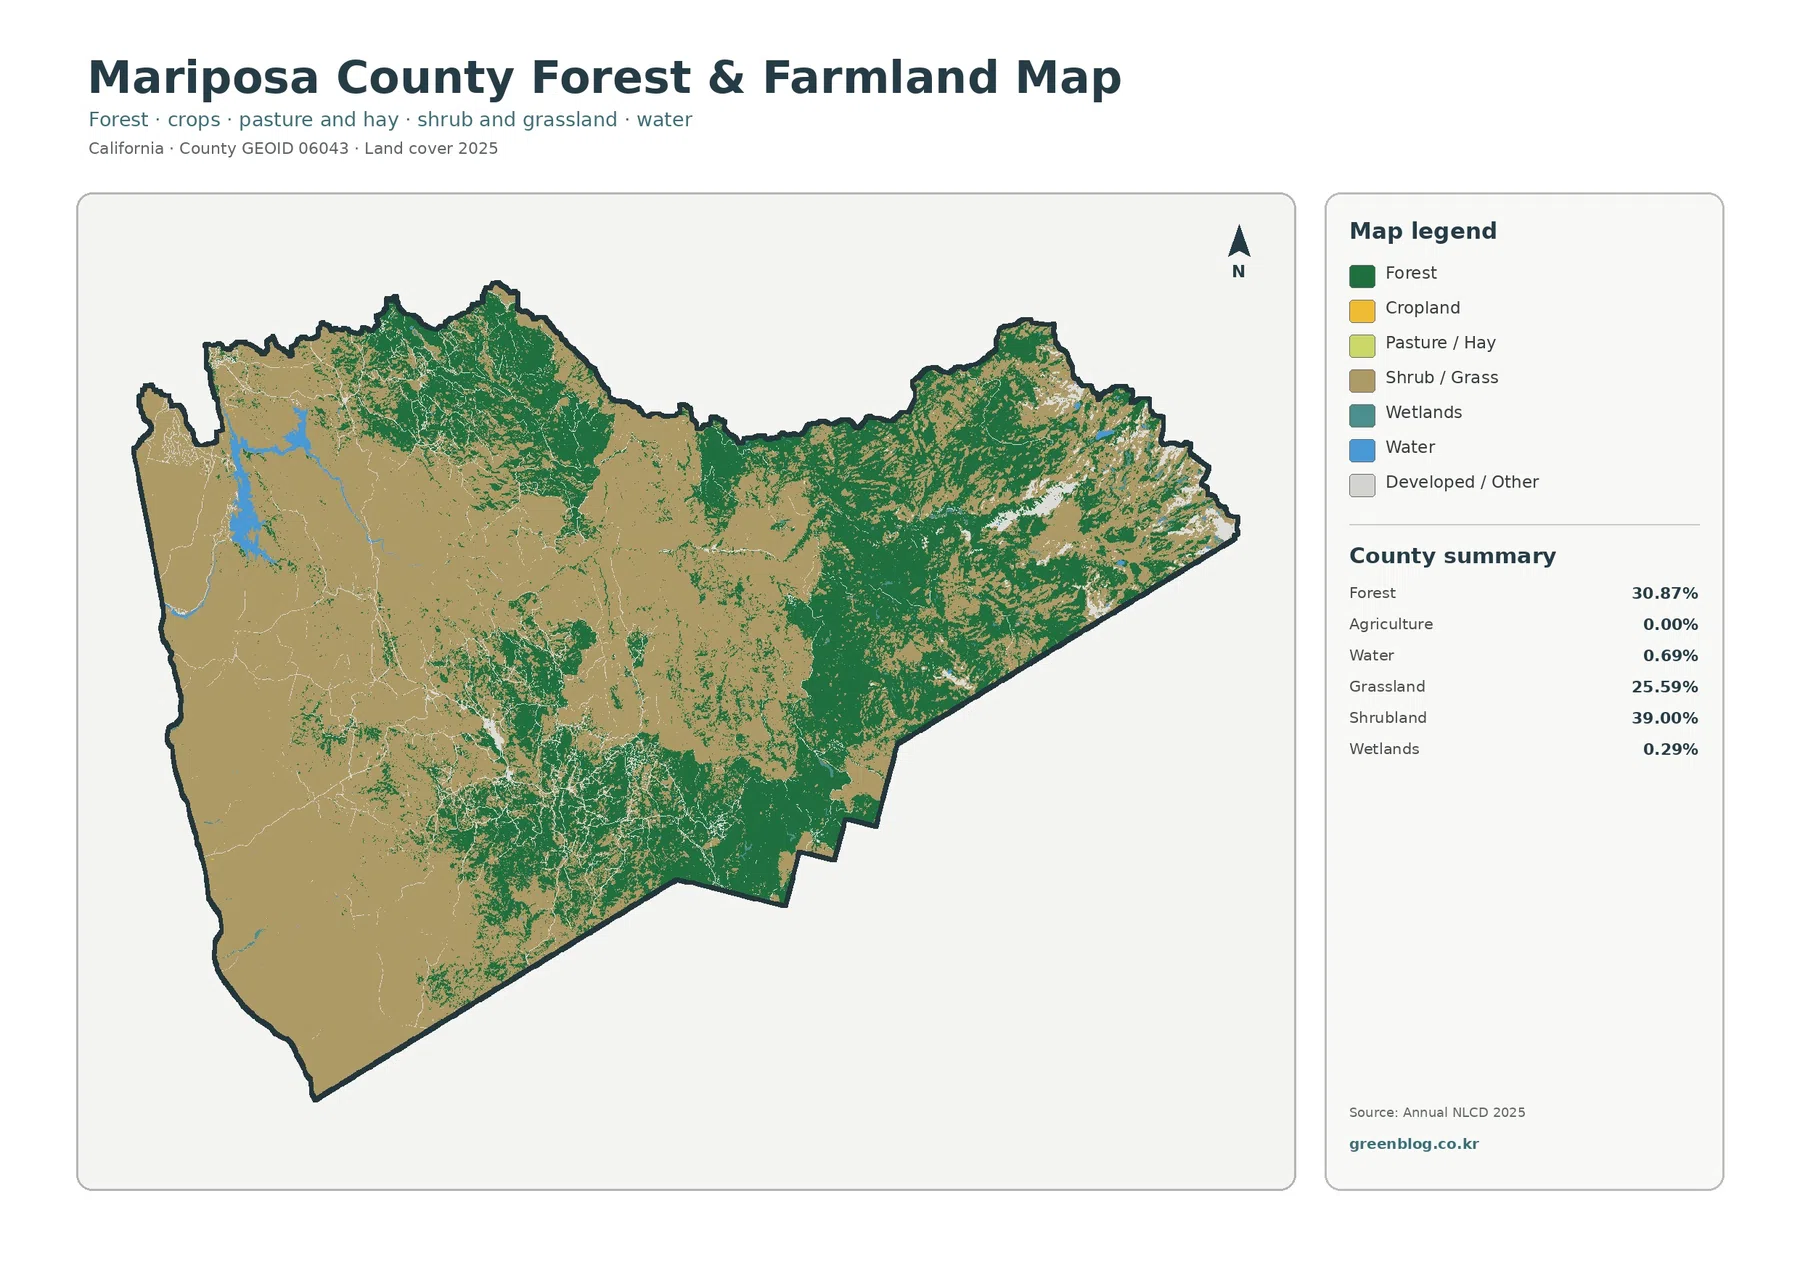
Mariposa County’s Agricultural and Working Lands Conservation Plan makes the distinction particularly clear. The county says roughly half of its 1,463 square miles is designated Agricultural/Working Land Use in the General Plan. A working landscape can still appear as grassland or shrubland in a satellite-based land-cover product, so a planning designation and an NLCD class may describe the same place in completely different ways.
The 1985–2025 layer needs careful reading because class difference is not the same as cause
The change map marks 23.16 percent of Mariposa County as having a class difference between 1985 and 2025. The summary assigns 16.18 percent to the forest-loss category, 0.80 percent to areas classified as developed, and 6.16 percent to other class differences. Agricultural loss is 0.00 percent. These categories describe a comparison between two classifications; they do not by themselves identify why a particular pixel changed.
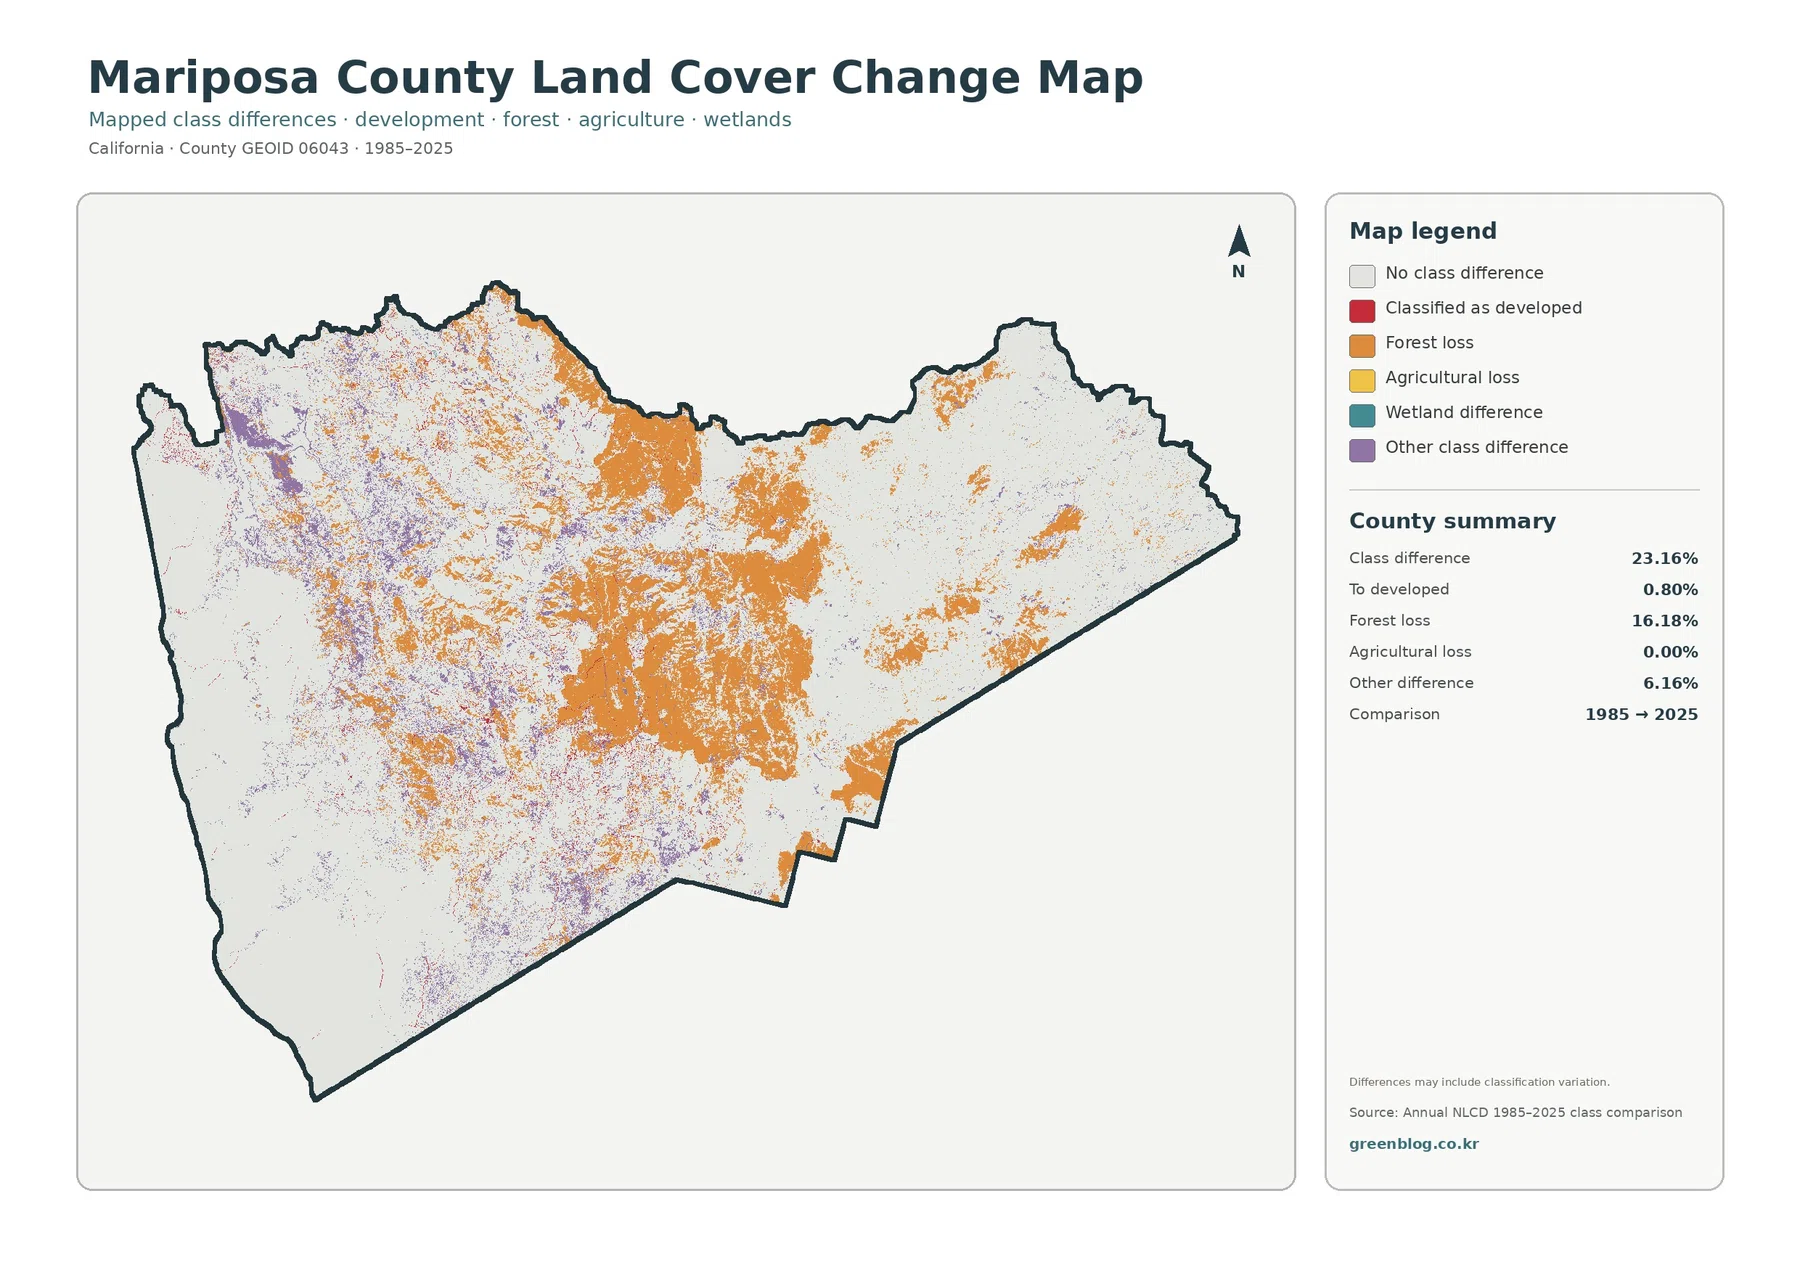
The map itself warns that class differences may include classification variation. Real vegetation change can be part of the result, but mixed pixels, image conditions, and classification rules can also matter. Explaining the 16.18 percent forest-loss category at a specific site therefore requires other evidence such as annual imagery, wildfire history, forest-management records, or field information.
Sierra slopes and the Merced River provide useful geographic context
Mariposa County extends across the western Sierra Nevada, and the county’s technical background discusses the Merced River basin, mountain vegetation, grassland, chaparral, and forest communities. Yosemite Valley and the headwaters of the Merced River are also historically identified within Mariposa County by the National Park Service. This geography helps explain why a single county can contain open foothill cover, extensive shrubland, and large forest blocks over relatively short east-west distances.
A practical order for comparing the four Mariposa County maps
Start with the general land-cover map when you want the fastest overview. It establishes the dominant 39.00 percent shrubland, 30.87 percent forest, and 25.59 percent grassland pattern and shows how small the developed class is by comparison. Move to the forest-and-farmland view when the goal is to simplify the natural-cover comparison and discuss why land cover is different from agricultural or planning land use.
The impervious map is the better choice for discussing settlement and hard surfaces because the general map compresses most development into a few red pixels. Use the 1985–2025 map last when a long-term comparison is needed. That order lets a reader understand the present-day landscape first and then evaluate where classifications differ through time without assuming that every colored change pixel has the same cause.
Map File Information
Each JPG is 2480×1754 pixels. That is the original source size supplied in this county package and is below the 4961×3508 pixels associated with an A3 page at 300 dpi. It is suitable for screen use, ordinary documents, classroom handouts, and smaller prints, while very large prints should be checked carefully for enlargement limits.
Land cover is not zoning, ownership, or a parcel-level development map
Mariposa County’s General Plan and area-planning documents address communities such as Mariposa, Coulterville, El Portal, Foresta, Wawona, and Yosemite West with land-use policies and development standards. NLCD does something different: it classifies the physical surface observed in remotely sensed imagery. A grassland pixel may lie on ranch land, public land, or a residential parcel, and the land-cover map does not tell you which one applies.
Resolution and date limits matter in a county with narrow roads and mixed vegetation
Annual NLCD Collection 1.2 extends the conterminous U.S. annual product series through 2025 and uses raster-based land-cover and impervious products. The standard spatial resolution is 30 meters. A 30-meter cell can contain trees, grass, bare soil, a road, and a structure at the same time, so the assigned class is a generalized representation rather than a field survey of every object inside the cell.
Frequently Asked Questions
What is the dominant land cover in Mariposa County in 2025?
Shrubland is the largest class at 39.00 percent. Forest follows at 30.87 percent, and grassland accounts for 25.59 percent. Together, those three classes dominate the county map. The pattern is not uniform: grassland is especially broad in the west and southwest, while forest is more extensive toward the eastern Sierra side.
Does 0.00% agriculture mean Mariposa County has no agricultural or working land?
No. The 0.00 percent value is an NLCD land-cover result, not a land-use inventory. Mariposa County says roughly half of the county is designated Agricultural/Working Land Use in the General Plan. Working land may appear as grassland or shrubland in satellite classification.
Should the 16.18% forest-loss category be read as confirmed deforestation?
No. It is a mapped class-difference category between 1985 and 2025. Real forest change may be part of it, but the change map also warns that classification variation can contribute to the result. Confirming the reason for a specific change requires additional evidence such as annual imagery, wildfire or forest-management records, and local field information.
Map File Information
Download the four original Mariposa County land-cover JPG maps together in one ZIP file.
- Included Files: Use only the versions confirmed in the article and supplied images
- File Type: Use the confirmed download contents
- Intended Use: Printing, education, presentations, and map-based projects
Related Maps
- Alameda County California Land Cover Map
- Alpine County California Land Cover Map
- Amador County California Land Cover Map
Sources and References
- MRLC Annual NLCD Data — current Annual NLCD data access and Collection 1.2 information
- MRLC Annual NLCD Project — 1985–2025 land-cover, change, and impervious product coverage
- Yosemite National Park — Yosemite Grant Act — geographic reference to Yosemite Valley and the Merced River headwaters in Mariposa County
- Mariposa County Agricultural and Working Lands Conservation Plan — county information on Agricultural/Working Land Use
- Mariposa County General Plan Volume III Technical Background Report — county vegetation, agriculture, hydrology, and natural-resource background
Green Map creates custom-edited map images using open geographic data sources such as geoBoundaries, Natural Earth, OpenStreetMap, and government open data.
These maps are edited visual materials, not raw data files, and are provided for education, documents, presentations, and graphic reference.