Madera County stretches across two very different California landscapes, and the land-cover maps make that contrast immediately visible. Broad agricultural blocks dominate the western valley, while grassland, shrubland, and forest take over through the foothills and higher Sierra Nevada terrain to the east.
This page includes four views: 2025 land cover, a forest-and-farmland view, fractional impervious surface, and a 1985–2025 change comparison. The four original JPG maps are available in one download for printing, classroom use, presentations, or side-by-side reference.
Table of Contents
A county that changes from farm country to the high Sierra
County planning documents describe western Madera County as part of California’s Central Valley, with foothills in the middle and the Sierra Nevada occupying the eastern portion. That broad west-to-east transition is the most useful way to orient yourself before reading the color classes. The western end is relatively uniform and agricultural; the middle becomes more mixed; the eastern half breaks into forest, shrubland, grassland, barren high country, and small water bodies.
The forest-and-farmland view makes the west–east split easiest to see
The simplified forest-and-farmland map is a good place to begin because it reduces the number of competing colors. Cropland covers large, connected areas across the western part of the county. Forest becomes much more extensive from the central uplands into the east, while shrub and grass classes fill much of the transition between the valley floor and the higher mountains.
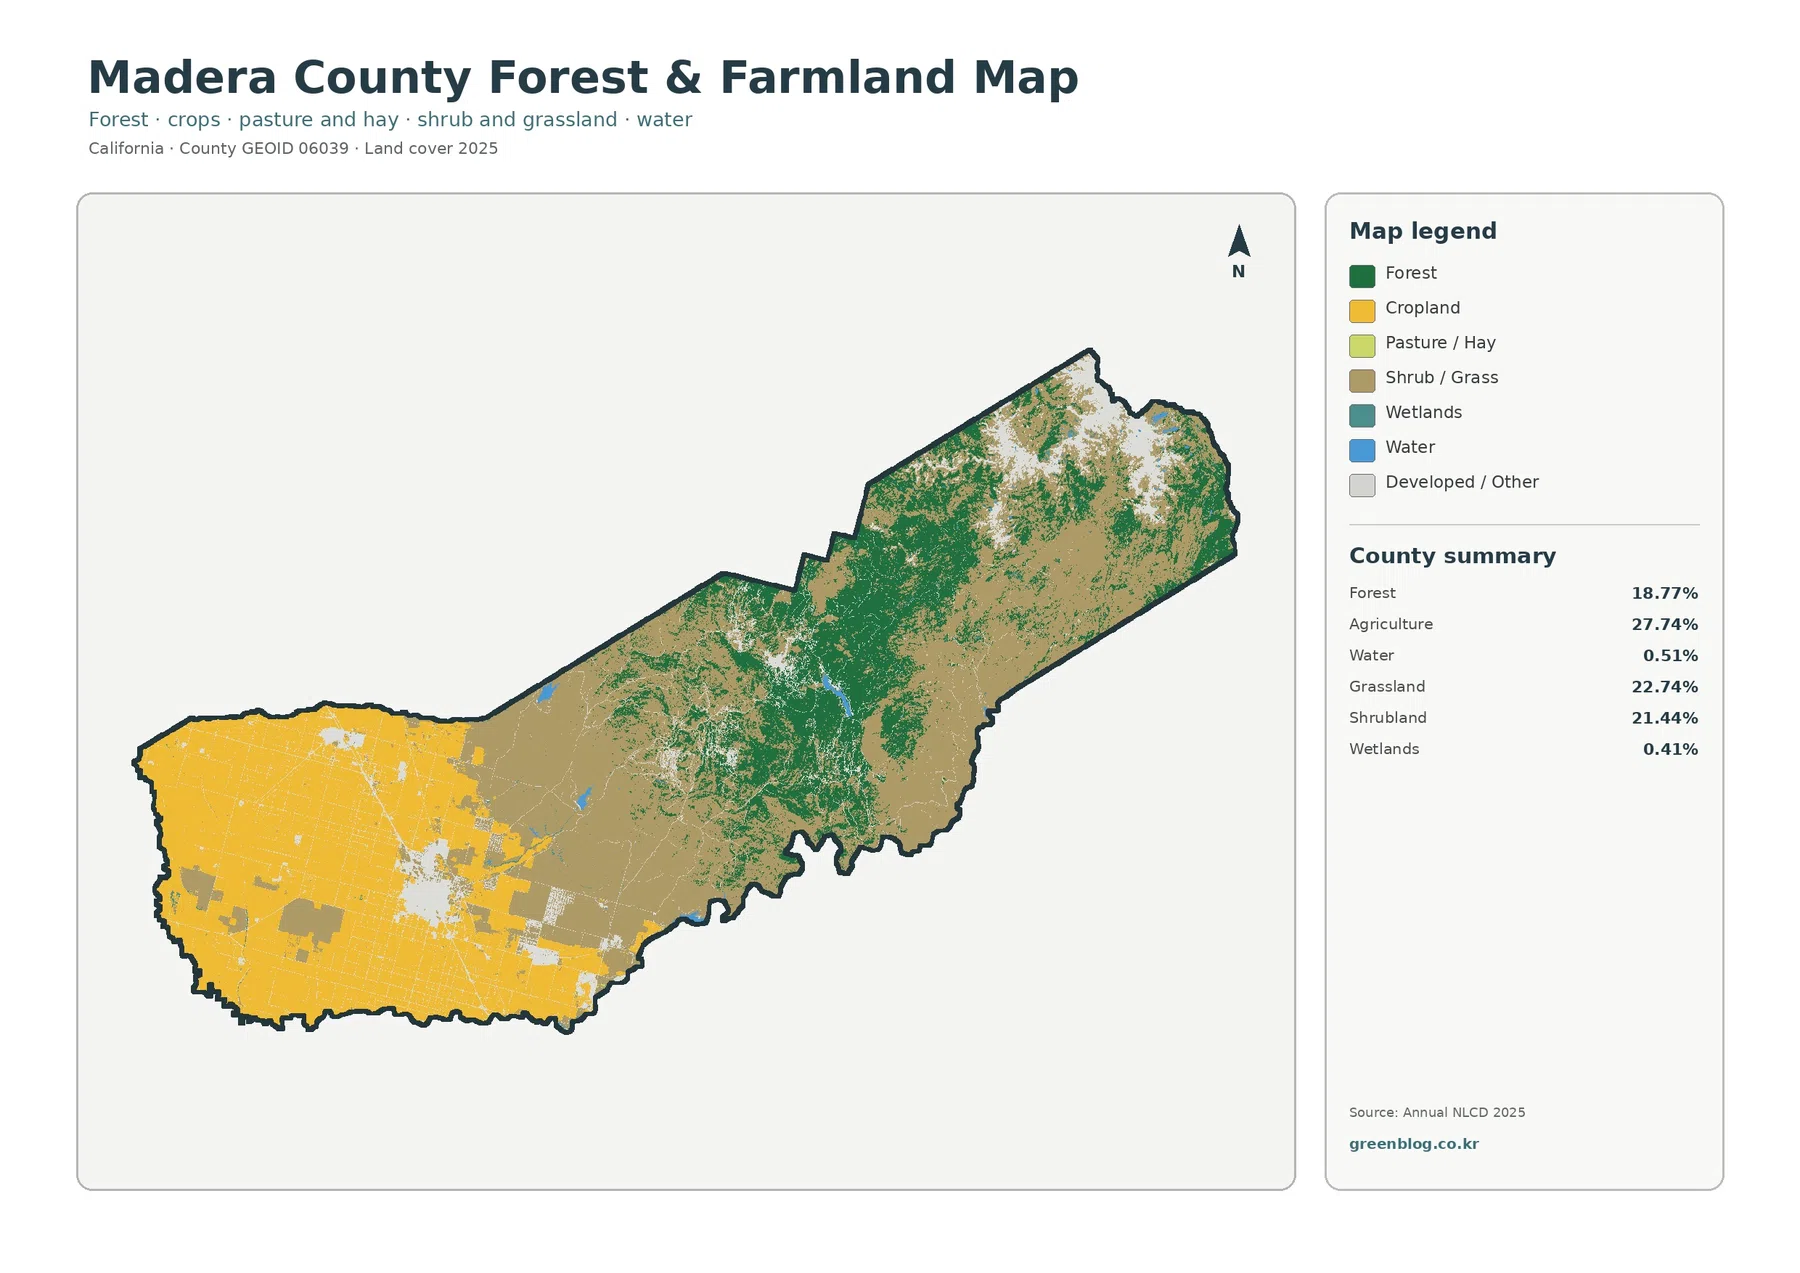
On the mountain side, green forest patches form large connected areas instead of a narrow strip. The U.S. Forest Service describes Sierra National Forest as spanning Fresno, Madera, and Mariposa counties on the western slope of the central Sierra Nevada. The map’s broad forested middle and eastern sections are consistent with that mountainous setting, while lighter shrub and grass colors become more common toward open slopes and higher terrain.
2025 land cover is balanced among four major classes, not one
The 2025 county summary lists agriculture at 27.74%, grassland at 22.74%, shrubland at 21.44%, and forest at 18.77%. Developed land accounts for 5.43%. Water covers 0.51% and wetlands 0.41%. The top four classes are all substantial, which explains why the county looks so varied even though agriculture is the single largest category.
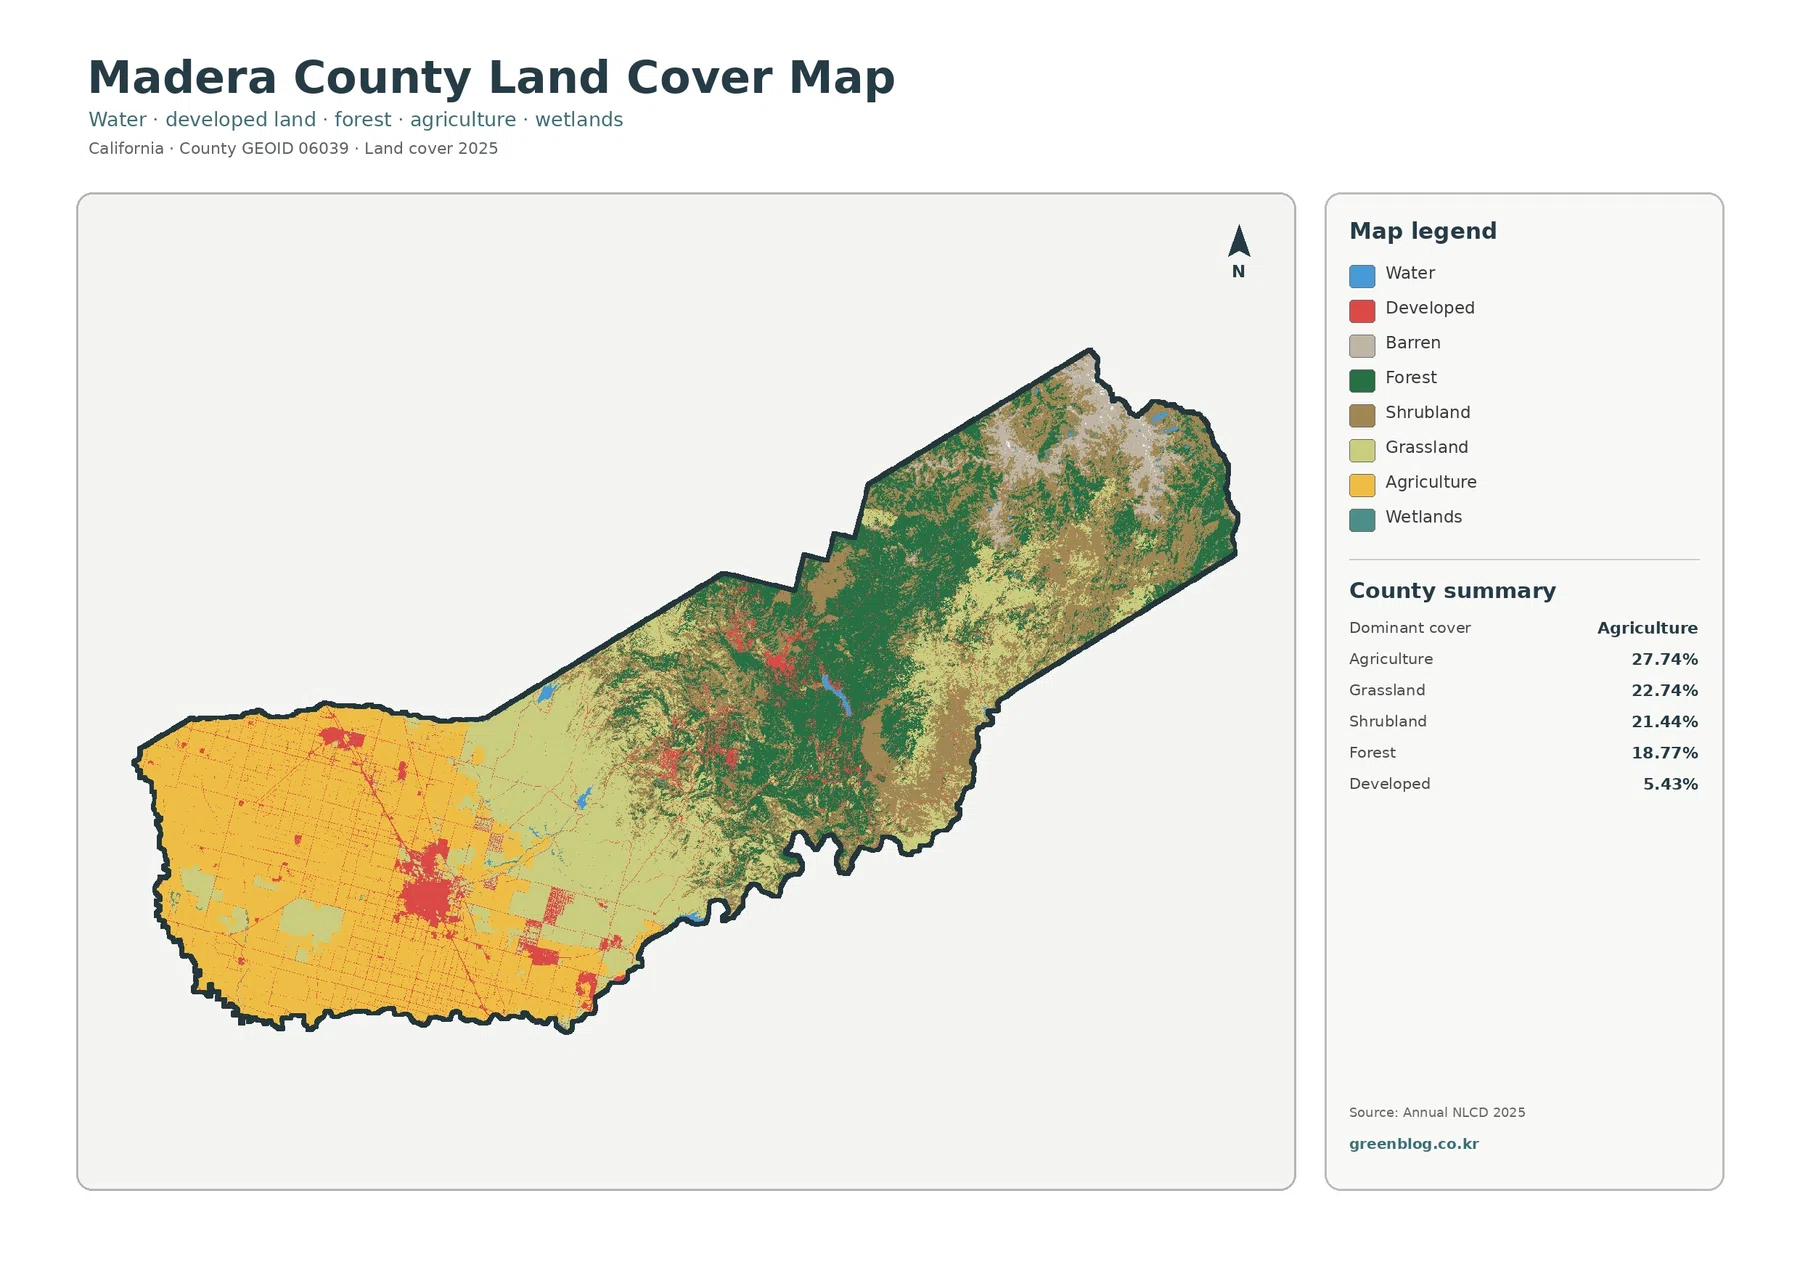
In the western valley, agricultural color forms the background for a grid of roads and several developed clusters. The largest urban patch sits within this farm-dominated landscape rather than replacing it. Smaller developed areas appear farther north and along other settlement corridors, so the map is useful for seeing how towns and transportation surfaces are embedded within working agricultural land.
Hard surfaces are concentrated in a small part of the county
The impervious-surface map strips away most of the natural-cover colors and focuses on pavement, rooftops, and other surfaces that shed water instead of absorbing it. Madera County’s mean impervious value is 1.22%, and only 0.66% of the county falls in cells with at least 50% impervious cover. Those low countywide numbers match the mostly rural appearance of the map.
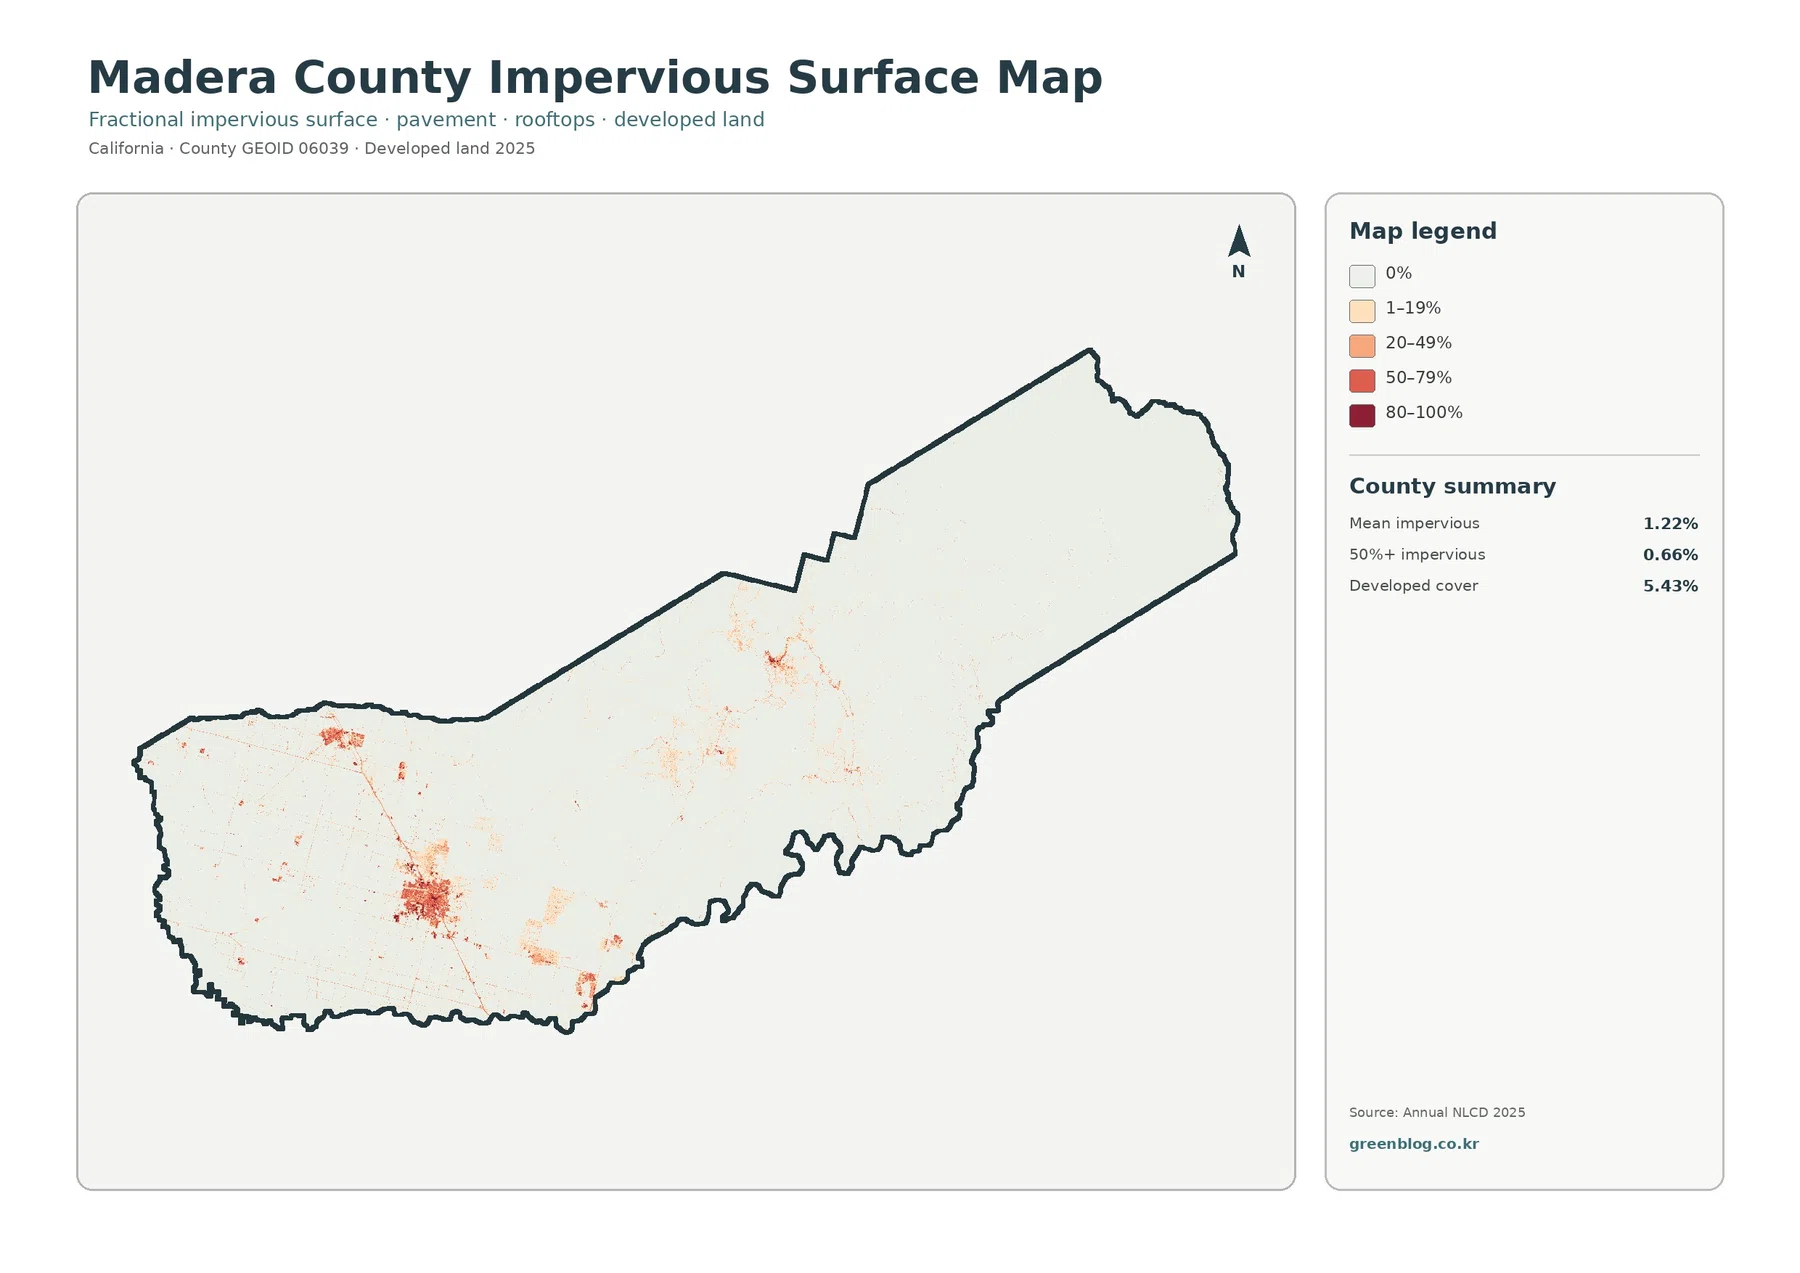
The strongest concentrations occur in the western valley around the county’s largest population centers. Madera County has two incorporated cities, Madera and Chowchilla, along with a number of unincorporated communities. On this map, the valley cities stand out as compact red and orange clusters surrounded by much paler agricultural land.
The 1985–2025 comparison shows where classification changed, not why
Across the county, the change map reports a class difference on 21.98% of the area between 1985 and 2025. Forest loss accounts for 10.49%, conversion to developed for 2.56%, agricultural loss for 0.87%, and other class differences for 7.98%. These categories help locate change, but they do not provide a cause for every pixel.
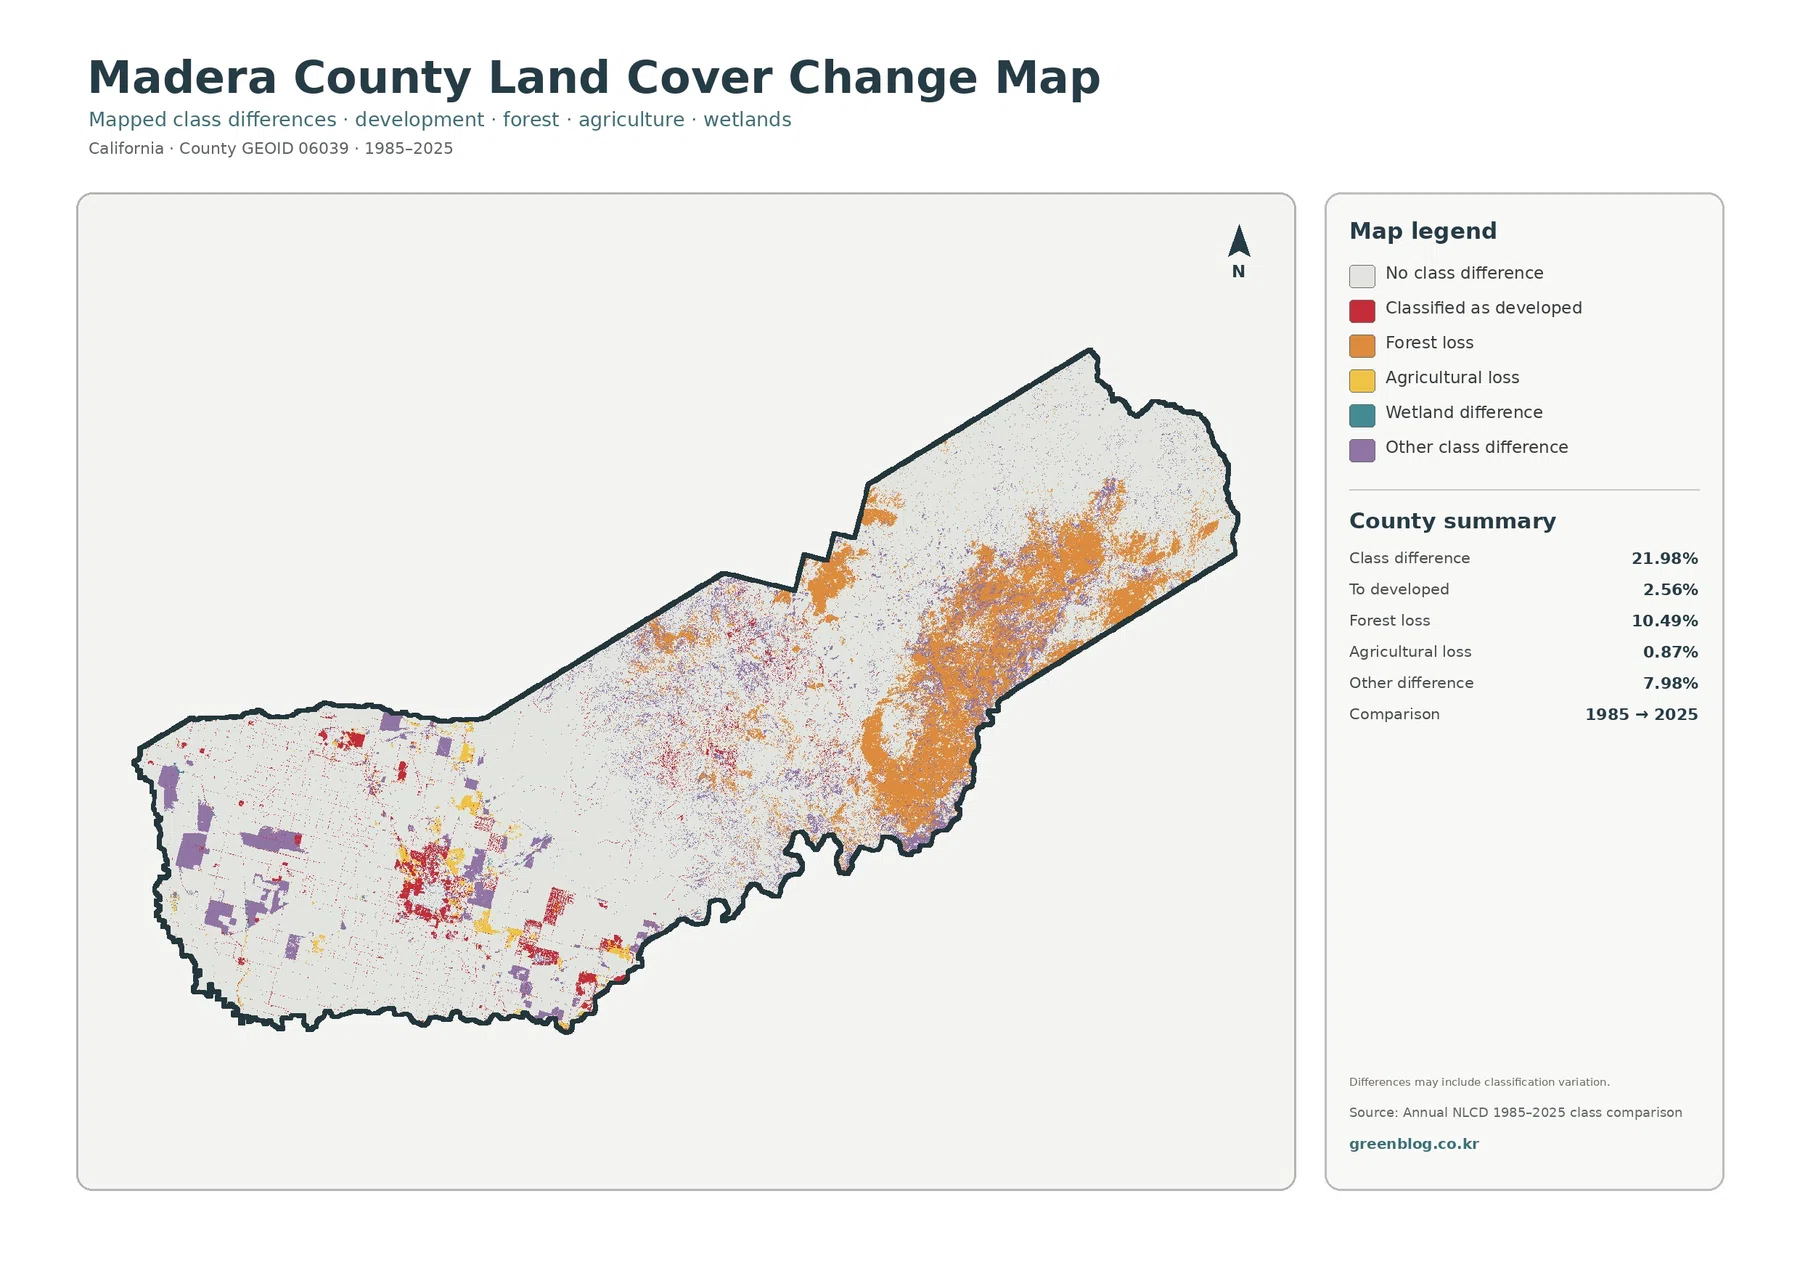
The most extensive mapped change is the forest-loss class across the central and eastern mountain area. Orange patches and speckled areas cover large parts of slopes that are forested or mixed in the 2025 maps. This should be read as a classification transition from forest to another class, not as proof that every marked cell experienced permanent clearing. The map also notes that some differences may reflect classification variation, so a site-specific cause should be checked against additional imagery or local records.
Water and wetlands occupy little area but help anchor the landscape
Water represents 0.51% of the 2025 summary and wetlands 0.41%, so neither class dominates the county. They still matter because Madera County contains major Sierra-fed drainages and reservoirs. County hazard-planning material describes the San Joaquin, Fresno, and Chowchilla river systems, along with reservoirs including Bass Lake, Hensley Lake, and Eastman Lake.
A land-cover raster is not a hydrographic survey. Narrow streams may be smaller than a 30-meter cell, seasonal water can differ from the mapping date, and shoreline cells may mix water with vegetation or developed surfaces. For engineering, flood, or exact stream-location work, use a dedicated hydrography or county GIS layer instead of relying on these land-cover classes alone.
How to use the four maps as a set
For a quick county overview, start with the full land-cover map. It answers the broad question of what covers the western valley, the middle foothills, and the eastern Sierra. Then switch to the forest-and-farmland map when you want a cleaner comparison between working agricultural land and natural upland cover.
Download the JPG set without relying on screenshots
What the maps cannot tell you about a parcel
These maps are designed for landscape-scale interpretation. They do not show legal parcel boundaries, ownership, zoning, building entitlements, agricultural preserve status, or the exact limits of an incorporated city. A bright developed cell can tell you that the surface was classified as developed; it cannot tell you what uses are legally allowed there.
Resolution, mixed pixels, and the 2025 observation year
Annual NLCD is raster based and derived from satellite imagery at 30-meter resolution. Think of the county as being divided into a grid of 30-meter cells, with each cell assigned a representative land-cover value. Where a road crosses grassland, a house sits among trees, or a narrow stream runs through a field, more than one surface may occupy the same cell.
Time matters too. The main maps describe 2025 conditions, while the change map compares 1985 with 2025. Development, fire, vegetation recovery, agricultural conversion, or changing water conditions after the observation year will not appear here. For a current site decision, pair these maps with newer imagery and the appropriate local records.
Frequently Asked Questions
What is the largest land-cover class in Madera County in 2025?
Agriculture is the largest single class at 27.74%. However, grassland at 22.74%, shrubland at 21.44%, and forest at 18.77% are also major parts of the county. The more important visual pattern is where those classes occur: agriculture dominates the western valley while natural upland classes expand through the foothills and Sierra.
Does the 10.49% forest-loss value mean that all of that land was permanently deforested?
No. It means those cells were classified as forest in the earlier comparison and as another class in 2025. Some changes may reflect real disturbance or conversion, but classification variation and vegetation condition can also affect the result. A specific cause should be confirmed with other time-series imagery or local records.
Which map is best for comparing Madera County’s valley cities with its mountain communities?
Use the impervious-surface map to compare where hard surfaces cluster, then check the full land-cover map to see what surrounds those developed areas. The western valley has strong urban concentrations, while eastern communities appear as smaller patches within forest, shrubland, and grassland. Exact city or parcel boundaries still require Madera County GIS or planning data.
Map File Information
Download the four original Madera County land-cover JPG maps together in one ZIP file.
- Included Files: Use only the versions confirmed in the article and supplied images
- File Type: Use the confirmed download contents
- Intended Use: Printing, education, presentations, and map-based projects
Related Maps
- Alameda County California Land Cover Map
- Alpine County California Land Cover Map
- Amador County California Land Cover Map
Sources and References
- MRLC Annual NLCD Data — access to Annual NLCD land-cover and change products
- USGS Annual National Land Cover Database — documentation for the annual 30-meter product suite
- Madera County Agricultural Commissioner — county agriculture programs and annual crop-report information
- Madera County Planning Division — official land-use planning, General Plan, and zoning information
- Madera County GIS — county mapping resources for boundaries, roads, communities, parcels, and zoning
- Madera County Emergency Operations Plan — official county geography, communities, and major river-system context
- U.S. Forest Service – Sierra National Forest — official overview of the central Sierra forest spanning Madera County
Green Map creates custom-edited map images using open geographic data sources such as geoBoundaries, Natural Earth, OpenStreetMap, and government open data.
These maps are edited visual materials, not raw data files, and are provided for education, documents, presentations, and graphic reference.