The Lassen County California Land Cover Map reveals a strong west-to-east contrast: broad forest in the western half gives way to extensive shrubland across much of the east, while lakes, wetlands, grassland, agriculture, and small developed areas break up that larger pattern. The 2025 summary lists shrubland at 48.42%, forest at 22.73%, grassland at 17.24%, wetlands at 3.26%, and agriculture at 3.04%.
Four map views are included on the page, and the four original JPG files are available together in one ZIP download. The set covers general land cover, forest and farmland, impervious surface and developed land, and 1985–2025 land-cover change. These are surface classifications rather than parcel, zoning, ownership, or development-right maps.
Table of Contents
The clearest countywide contrast runs from forested west to shrub-covered east
Dark green forest forms broad, connected areas through much of western Lassen County. The 22.73% county share may seem modest beside the 48.42% shrubland figure, yet the forest is spatially concentrated enough to dominate large sections of the map. Official regional descriptions of Lassen County likewise distinguish extensive forest and mountain terrain in the west from drier hills farther east, providing useful context for the pattern visible in the 2025 classification.
Across the eastern half, tan shrubland becomes the main surface. It continues into the long southeastern portion of the county and surrounds many smaller patches of grassland, wetlands, water, and barren ground. Shrubland is not empty terrain: it represents areas where shrub vegetation is the dominant mapped cover. That distinction matters because some dry-looking areas are instead classified as barren or grassland.
Grassland accounts for 17.24% and often appears between the two dominant cover types. Large pale-green patches occur along forest margins, around some valleys, and through open portions of the south and east. A grassland class does not tell a reader whether a site is grazed, protected, privately owned, or managed for another use. It only identifies the surface vegetation class assigned in the 2025 land-cover dataset.
Developed cover is sparse by comparison. The impervious-surface summary reports only 2.09% developed land for 2025, and red development on the general map is concentrated mainly around a few western and southern settlement areas. Lassen County planning documents identify Susanville as the county seat and the county’s incorporated city, making the western-central development cluster a useful geographic reference without treating the raster map as an exact municipal boundary.
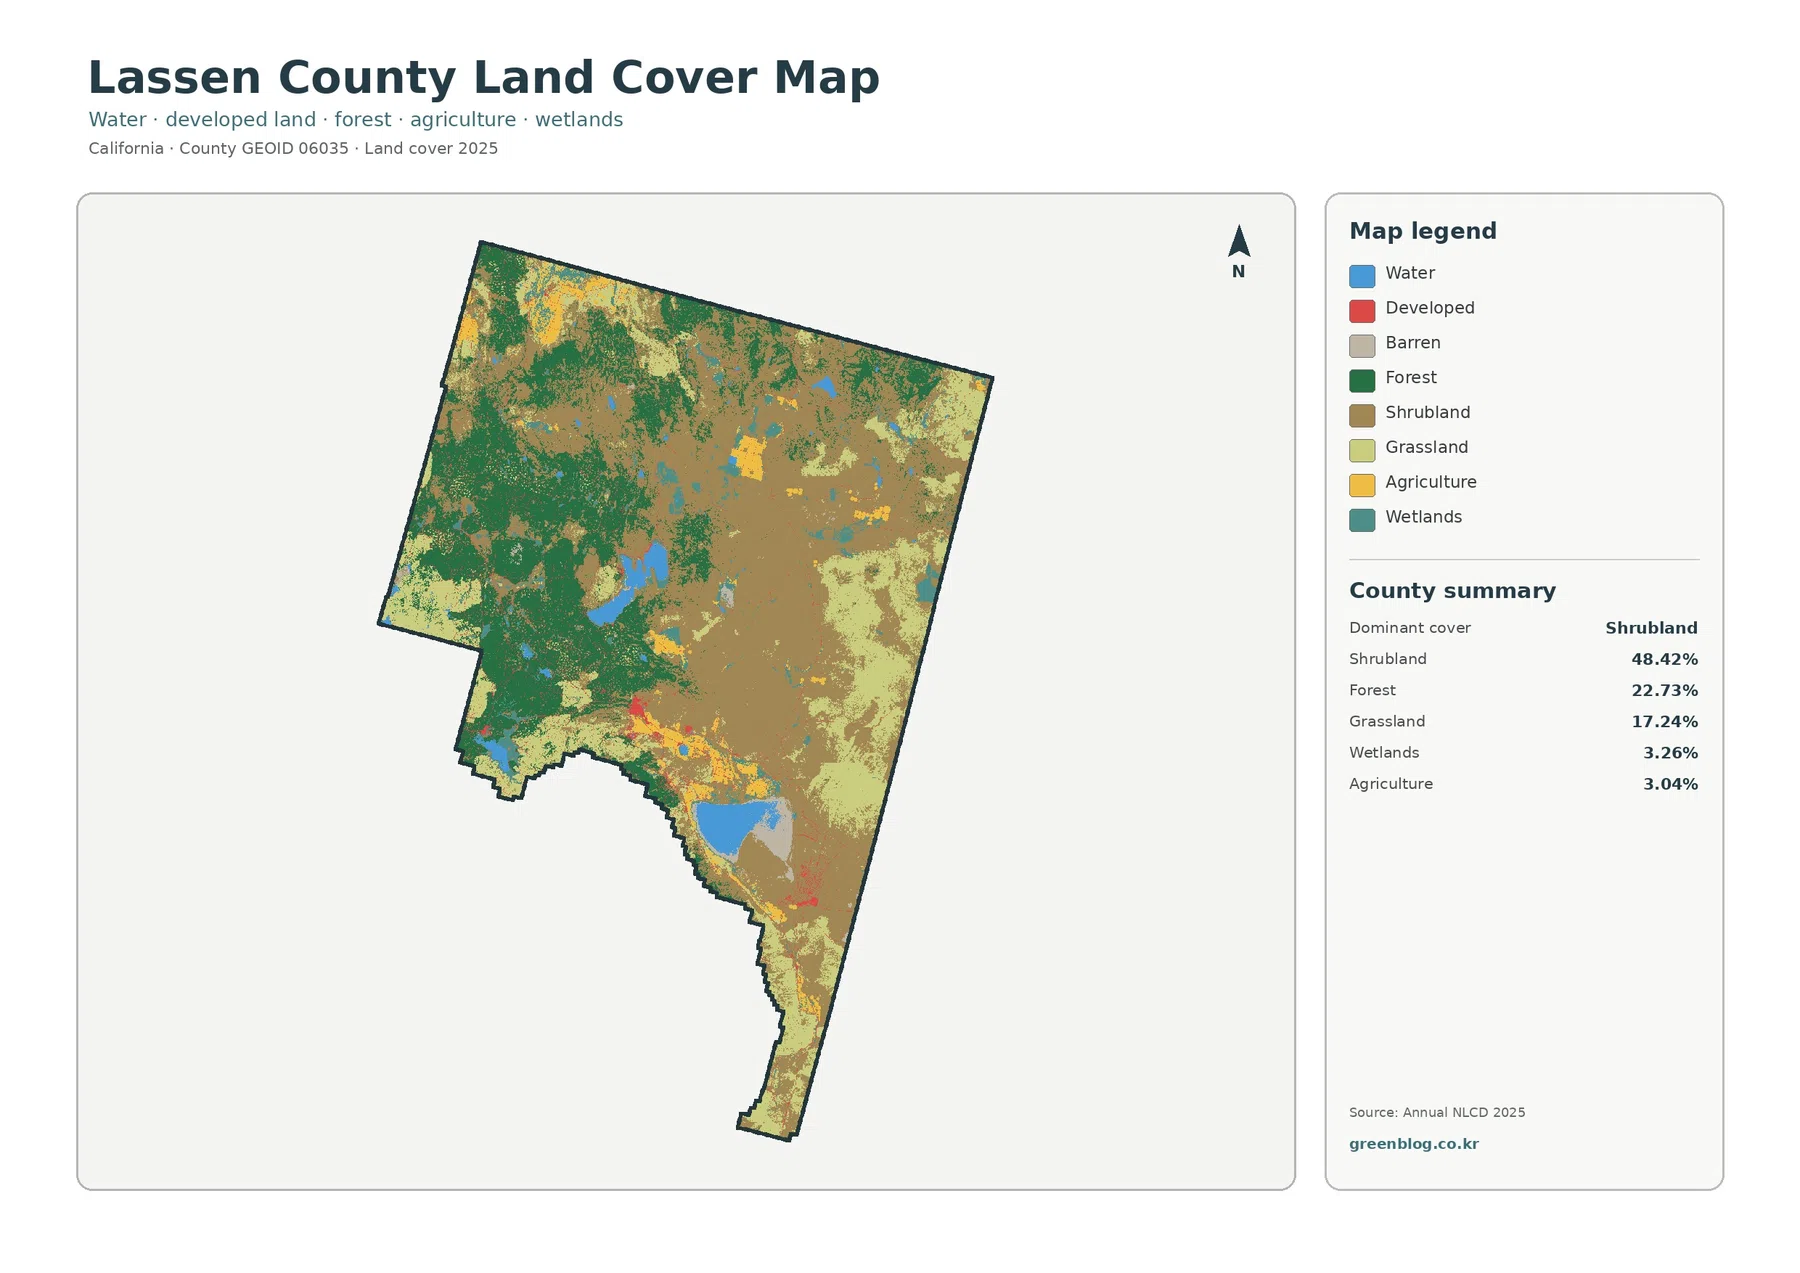
For a quick reading, start with the forest-shrubland divide rather than trying to decode every legend color at once. Grassland and agriculture can then be located in the valleys and openings between those larger classes. Finally, the major blue water bodies and small red settlement areas provide clear reference points for comparing the county’s natural and developed surfaces.
Major lakes make small water percentages visually important
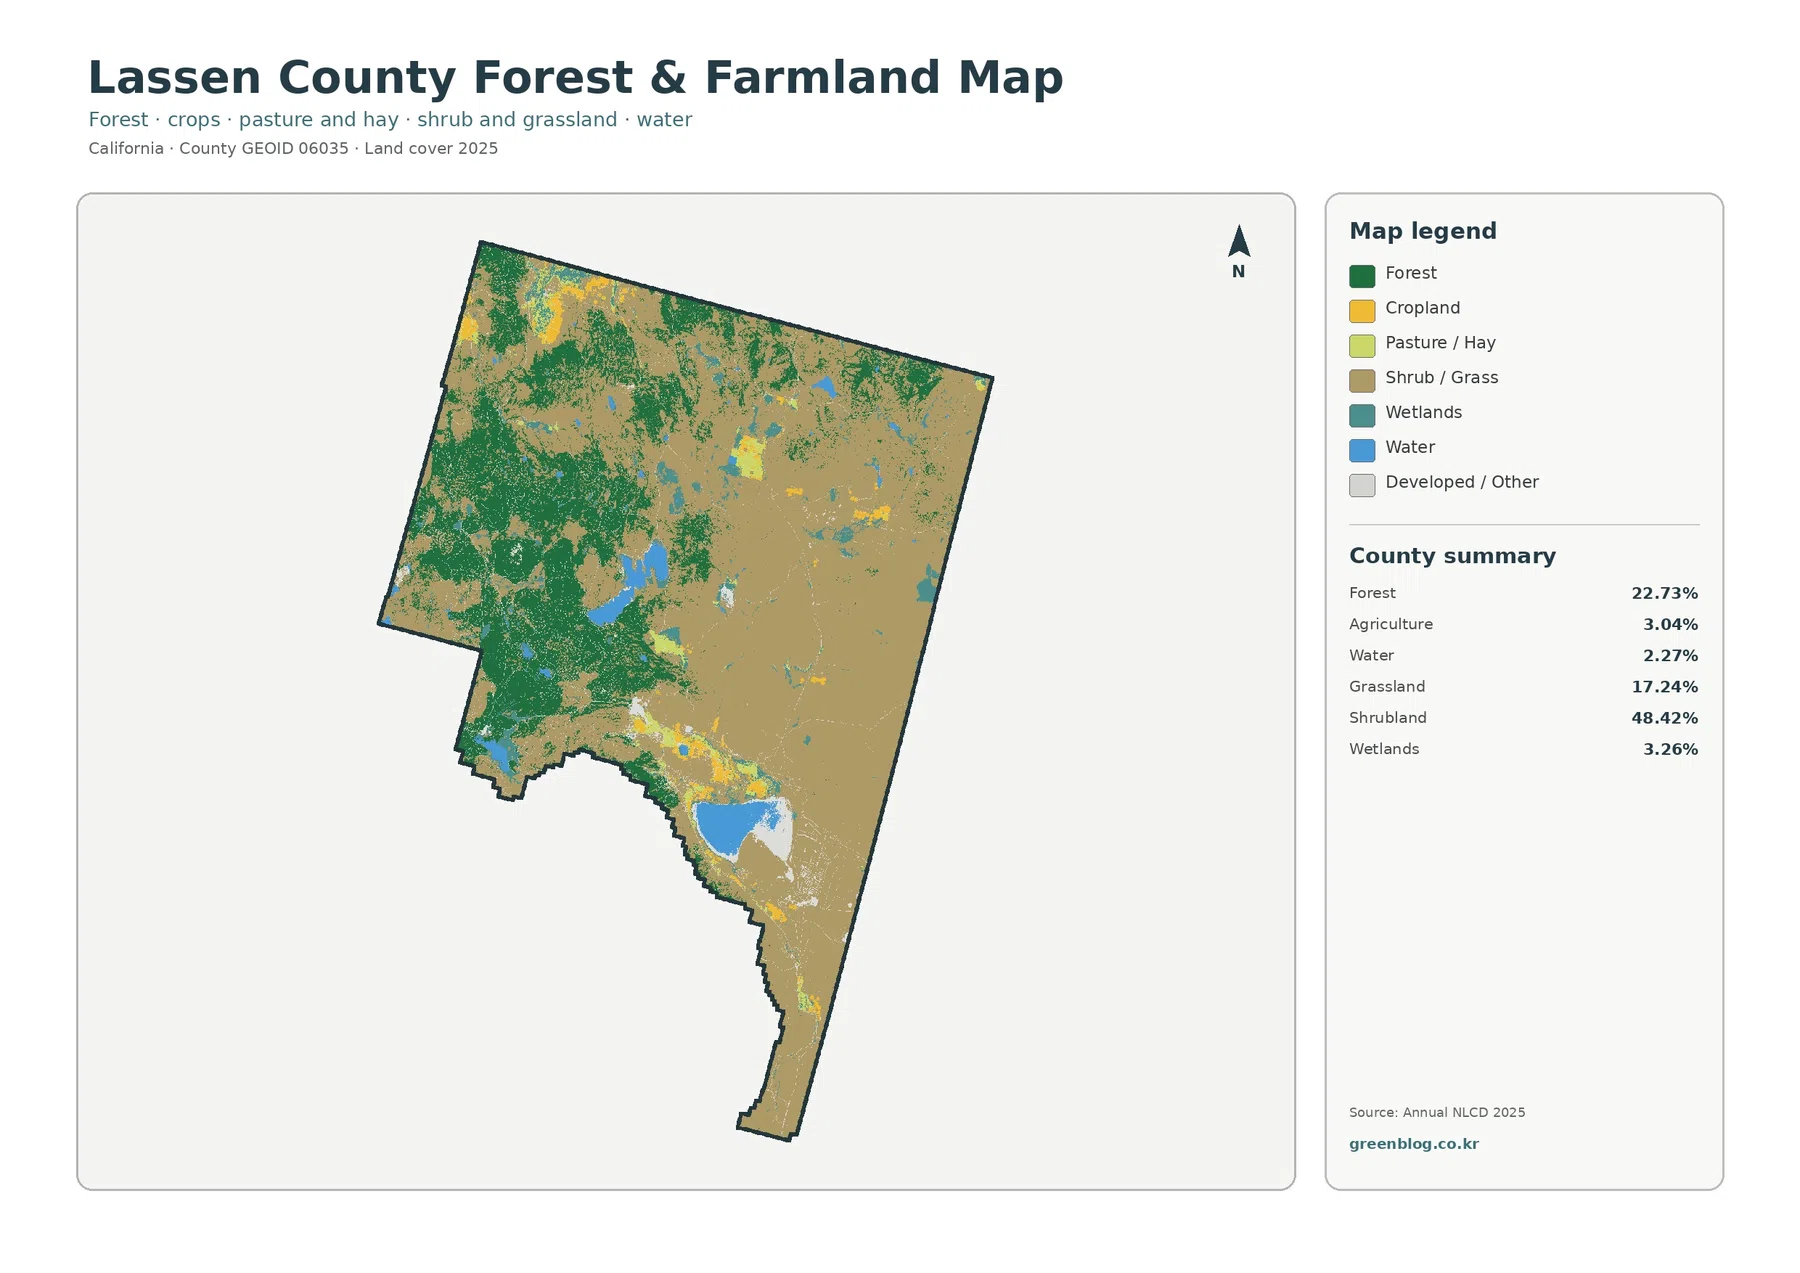
Water covers 2.27% of the forest-and-farmland summary, while wetlands account for 3.26%. Those percentages are small, but the map contains several conspicuous blue features. Eagle Lake and Honey Lake are important geographic reference points in Lassen County, and large water areas stand out sharply against surrounding forest, shrubland, and grassland.
Honey Lake is especially useful for interpreting the southern part of the map. California Department of Fish and Wildlife describes Honey Lake Wildlife Area as roughly 7,600 acres of sagebrush habitat surrounding a shallow Great Basin lake, with wetland vegetation around its margins. The agency also notes that water levels can vary seasonally. That caution is important when a 2025 land-cover image is used to discuss water or wetland extent.
The Susan River provides another verified geographic connection. California Water Boards describes it as an internally drained river whose headwaters are near the Lassen volcanic highlands and whose terminus is Honey Lake. A county-scale land-cover map cannot display every narrow river segment clearly, but the river system helps readers understand why forested uplands, valley vegetation, wetlands, and Honey Lake belong to the same broader landscape.
Wetlands and small water features require a scale warning. Annual NLCD uses raster cells about 30 meters across, so a narrow stream, spring, or wetland edge can be simplified. A cell may contain water, vegetation, and exposed soil at the same time but still receive one dominant class. The map works well for countywide comparison, not for delineating a shoreline or regulatory wetland boundary.
Susanville stands out because hard surfaces are rare almost everywhere else
Impervious surface means pavement, rooftops, parking areas, and other hard surfaces that do not readily absorb water. Lassen County’s 2025 mean impervious value is only 0.44%. Just 0.11% of the county is mapped at 50% or greater imperviousness, while developed cover totals 2.09%. The gap between those values is expected because developed land can include lawns, trees, soil, and other permeable surfaces.
Most of the impervious map is nearly white. The strongest orange and red concentration appears in the western-central part of the county around the Susanville area, with smaller clusters in the south and southwest. Broad forest and shrubland areas contain very little mapped hard surface. This makes the countywide settlement pattern unusually easy to see once the impervious map is placed beside the general land-cover view.
A 0.44% county average should not be applied to an individual town or neighborhood. It combines a compact developed center with thousands of square miles of forest, shrubland, grassland, lakes, and agricultural land. The same map also cannot predict flooding by itself. Runoff depends on slope, soils, rainfall, drainage structures, streams, and many other conditions in addition to pavement and roofs.
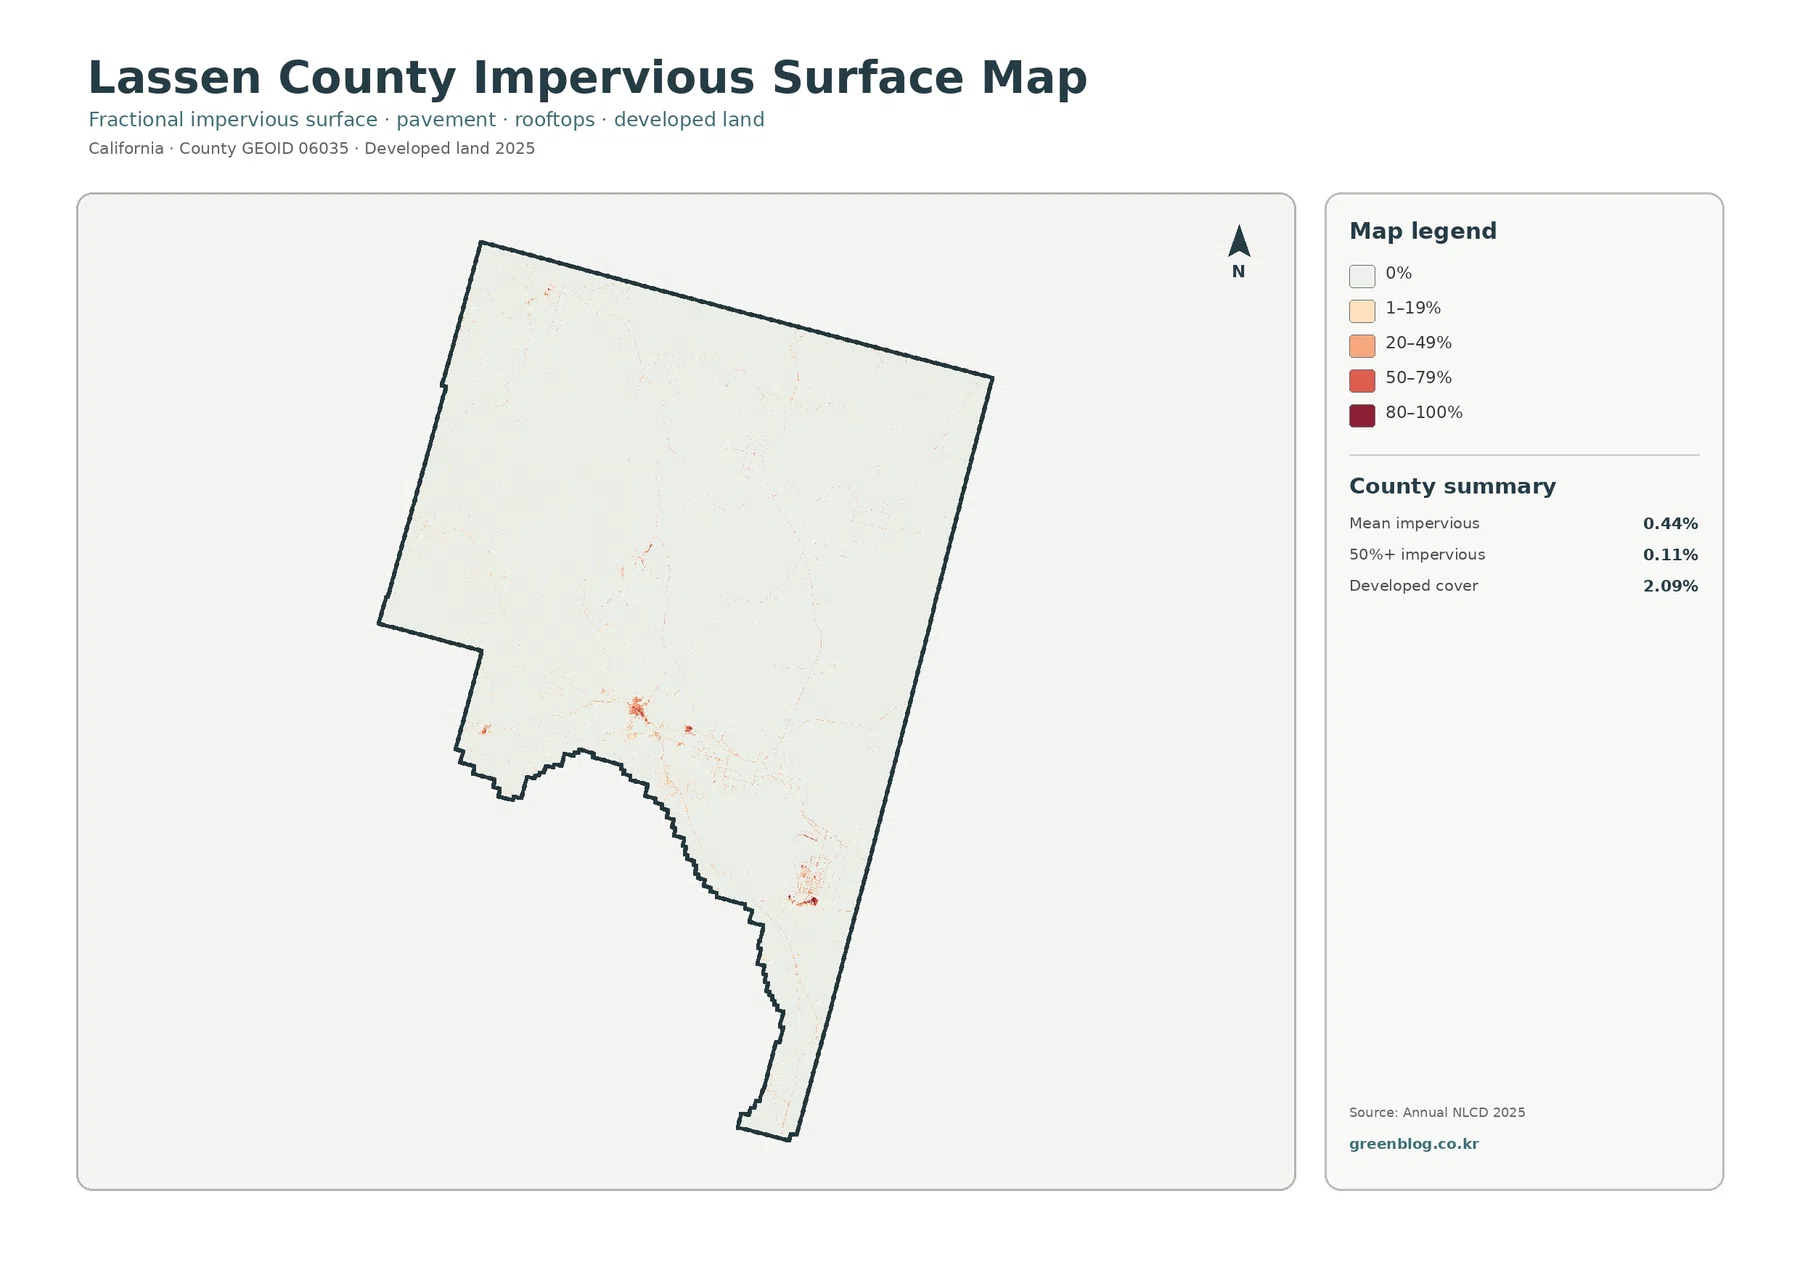
Planning documents answer a different question from this image. Lassen County Planning and Building Services handles the General Plan, zoning, permits, and development review. The impervious map describes a physical surface detected in 2025; it does not show whether a parcel is zoned for development or whether a project can be approved.
Agriculture is limited countywide but meaningful in Honey Lake Valley
Agricultural cover is only 3.04%, yet it forms recognizable yellow patches rather than disappearing into the countywide average. The strongest concentrations occur in southern valley areas near Honey Lake and in a few northern openings. Agricultural color is much less common across the broad eastern shrubland and western forest, which makes the valley pattern easy to distinguish.
The Honey Lake Wildlife Area history provides useful local context. CDFW notes that ranches in the valley historically produced grain, alfalfa, meadow hay, and livestock, and that surrounding rangelands and harvested fields were used for grazing. That history helps explain why agriculture and grassland occur together in the Honey Lake area, but the 3.04% land-cover value is not a crop acreage or production statistic.
Smaller agricultural patches also occur in northern parts of the county. Their significance is geographic rather than numerical: they show that cropland is concentrated in specific valleys and flatter areas instead of being spread uniformly through forest and shrubland. For crop type, active-field status, or agricultural preservation agreements, a dedicated agricultural or county land-use source would be more appropriate.
The simplified forest-and-farmland view is particularly helpful for this comparison because it reduces the number of competing developed classes. Readers can move directly from forest to agriculture, grass/shrub cover, water, and wetlands. That makes it easier to explain how a relatively small agricultural share can still form locally important blocks.
The 1985–2025 comparison contains a large “other difference” category
The change map reports class differences across 27.41% of Lassen County between 1985 and 2025. “Other difference” is the largest category at 18.40%, followed by forest loss at 6.83%. Agricultural loss is 0.62%, and transition to developed land is 0.61%. These are differences between two classifications, not proof that 27.41% of the county permanently changed for a single reason.
Purple other-difference cells are widespread in the east and southeast, with additional patches in the north. Dry-land boundaries between shrubland, grassland, and barren cover can be sensitive to vegetation condition and image timing. Because the category intentionally combines several kinds of class difference, a purple area should be treated as a place to investigate rather than a diagnosis of what happened there.
Orange forest-loss cells are more prominent in western and southwestern forested areas. A cell classified as forest in 1985 and another class in 2025 may reflect real disturbance or vegetation change, but the map cannot identify whether wildfire, timber activity, drought, regrowth stage, or classification behavior caused that difference. Fire history, forest records, and intermediate imagery are needed for a defensible explanation.
Agricultural-loss and developed-transition cells are comparatively limited. Their yellow and red marks occur mainly near valleys and settlement areas, where agriculture and development are present in the current maps. Agricultural classification can change with fallow conditions or crop appearance, while a developed-transition class is not the same as a permit, annexation, or legal land-use change.
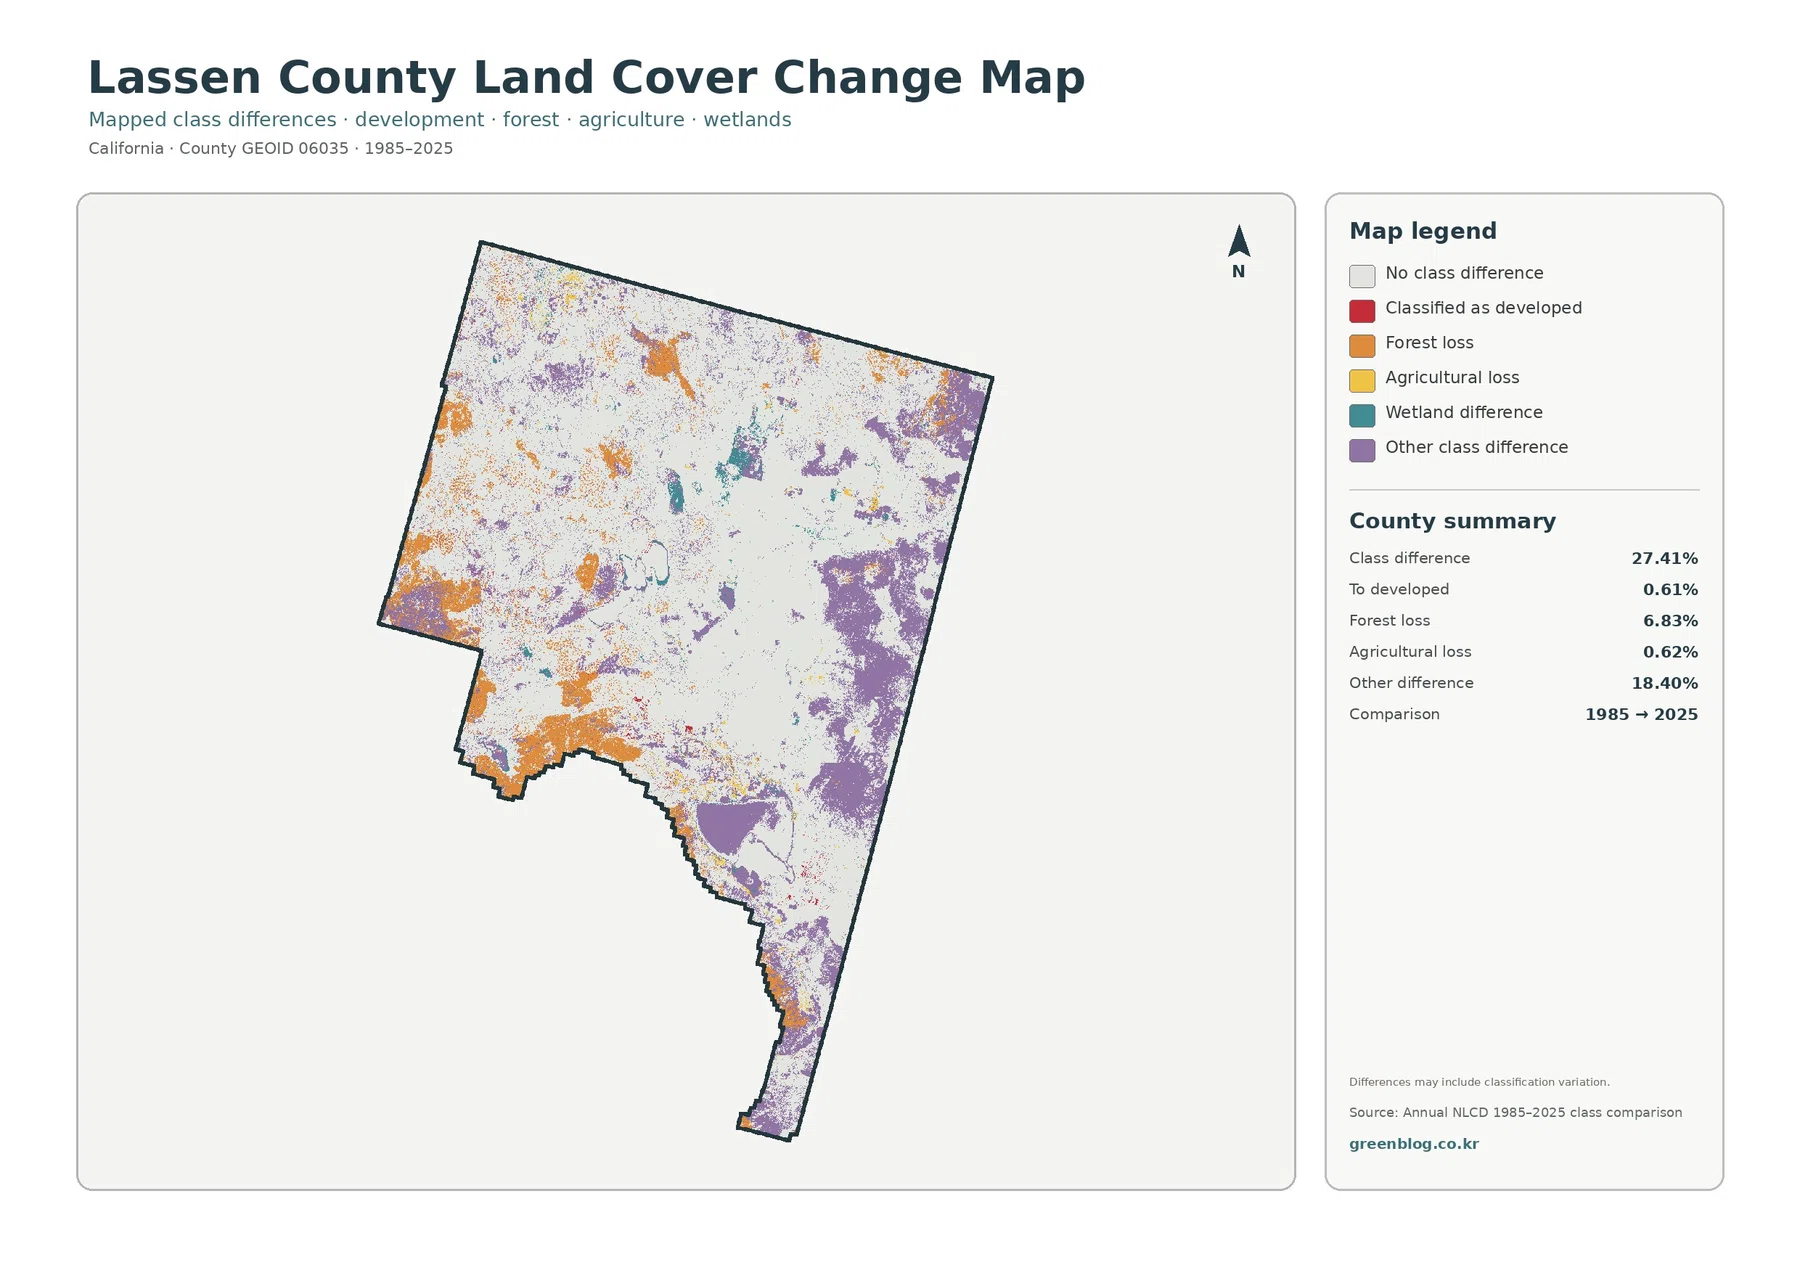
The map itself warns that the differences may include classification variation. That note should remain central to any interpretation. The strongest use of this map is to locate areas where the two dates disagree, compare those areas with the 2025 map, and then decide whether additional time-series or local evidence is needed.
A practical reading sequence for a county with mountains, lakes, valleys, and desert cover
For a county overview, begin with the general land-cover map and establish the 48.42% shrubland versus 22.73% forest contrast. Major lakes then provide geographic anchors, while grassland and agriculture fill in the valleys and open areas between the two dominant classes. This approach gives readers a concrete mental map before individual percentages become the focus.
A water or habitat discussion benefits from the forest-and-farmland view because Eagle Lake, Honey Lake, wetlands, forest, and open vegetation can be compared with fewer legend categories. Honey Lake Wildlife Area adds verified local context, but habitat boundaries themselves require specialized ecological data rather than the countywide land-cover raster.
Urban context is easier to explain with the general and impervious maps side by side. Developed cover is only 2.09%, and the hard-surface map makes its concentration around Susanville particularly clear. The comparison also shows why a broad developed class is not equivalent to a fully paved surface.
Long-term analysis should come after the 2025 pattern is understood. A purple or orange change cell has little meaning until the reader checks what covers that location now. Keeping current and change maps together also reduces the risk of presenting a two-date classification comparison as if it were a current land-cover image.
Download the four original JPG maps
The WebP versions on this page are optimized for quick viewing. The downloadable ZIP contains four original JPG maps: 2025 general land cover, forest and farmland, impervious surface and developed land, and the 1985–2025 land-cover change comparison. All four use the same county boundary, so they can be compared directly in reports, slide decks, lessons, or research notes.
Keep the legend and date visible when reusing an image. Shrubland, grassland, forest, and agriculture are separate classes; developed cover and impervious percentage are different measures; and the change map compares two years. Cropping away that information can make a correct map difficult to interpret.
These are county-scale reference maps rather than surveys or regulatory documents. They do not replace parcel records, zoning, legal wetland boundaries, forestry management maps, permits, or site-specific studies. When an exact boundary or current legal status matters, use the map to locate the area of interest and then move to the responsible agency’s current dataset.
What the 30-meter classification simplifies
Annual NLCD products generally use raster cells about 30 meters across. A raster cell is one square in a large grid. That scale makes countywide comparison efficient, but it can simplify narrow streams, small roads, wetland margins, forest edges, and small agricultural fields.
Mixed cells are common where forest meets grassland or where Honey Lake’s wetlands meet open ground. One cell may contain water, vegetation, bare soil, and a road while the final land-cover map assigns a single dominant class. The mapped edge can therefore look cleaner or more irregular than the real surface on the ground.
Date is another important limit. The current-condition maps represent 2025. Later fires, vegetation recovery, development, agricultural change, or lake-level differences are not included. The change map compares 1985 with 2025 only, so it cannot reconstruct every event that occurred between those dates.
Land-cover classification should also remain separate from land-use regulation. Lassen County Planning and Building Services manages General Plan and zoning questions, while Annual NLCD classifies physical surface conditions. A shrubland or agricultural cell does not reveal ownership or legal development rights.
With those limits understood, the four-map set captures the county’s most useful large-scale contrasts: forested western terrain, extensive eastern shrubland, major lakes and wetlands, valley agriculture, and a small developed footprint centered on a few settlements. The change map adds a second layer by showing where 1985 and 2025 classifications differ without claiming to identify a cause.
Frequently Asked Questions
What is the dominant 2025 land cover in Lassen County?
Shrubland is the largest class at 48.42%, followed by forest at 22.73% and grassland at 17.24%. Shrubland is most extensive across the eastern and southeastern county, while forest is much more prominent in the west and northwest.
Why do Eagle Lake and Honey Lake matter when reading the land cover maps?
Water covers 2.27% and wetlands 3.26% in the supplied 2025 summary. The large lakes and nearby wet areas provide clear reference points, but the 30-meter classification is not a precise shoreline, water-level, or legal wetland map.
Does 6.83% forest loss mean that exactly that amount of forest permanently disappeared?
No. The change map compares 1985 and 2025 classifications and may include classification variation. Intermediate imagery, fire and forest records, and local information are needed before assigning a cause to an individual changed area.
Sources and reference links
Land-cover and impervious-surface classifications can be reviewed through MRLC Annual NLCD Data and the USGS Annual NLCD Land Cover Classification. County boundary and FIPS reference data are available from U.S. Census Bureau TIGER/Line.
Local planning and geographic context can be checked in the Lassen County General Plan Housing Element and through Lassen County Planning and Building Services. Honey Lake habitat and seasonal water context are described by the California Department of Fish and Wildlife Honey Lake Wildlife Area, while the California Water Boards Susan River assessment documents the river’s connection to Honey Lake.
Map File Information
The ZIP includes four original JPG maps for Lassen County: 2025 general land cover, forest and farmland, impervious surface and developed land, and 1985–2025 land cover change.
- Included Files: Use only the versions confirmed in the article and supplied images
- File Type: Use the confirmed download contents
- Intended Use: Printing, education, presentations, and map-based projects
Related Maps
- Alameda County California Land Cover Map
- Alpine County California Land Cover Map
- Amador County California Land Cover Map
Green Map creates custom-edited map images using open geographic data sources such as geoBoundaries, Natural Earth, OpenStreetMap, and government open data.
These maps are edited visual materials, not raw data files, and are provided for education, documents, presentations, and graphic reference.