The Kern County California Land Cover Map shows a county where broad dry-land vegetation, irrigated agriculture, mountain forest, and a large urban concentration meet within one boundary. In the 2025 summary, shrubland is the largest class at 38.55%, followed by grassland at 29.26%, agriculture at 18.40%, developed land at 6.65%, and forest at 4.74%. Those percentages become much more useful when they are read with the map, because the agricultural west and shrub-dominated east look very different even though they are part of the same county.
This page includes four related views: general land cover, forest and farmland, impervious surface and developed land, and a 1985–2025 land cover change comparison. The WebP images are designed for quick browser viewing, while the download section provides all four original JPG maps in one ZIP file. Land cover describes the physical surface class detected in a mapped dataset. It should not be confused with parcel ownership, zoning, legal land use, or permission to develop a site.
Table of Contents
A sharp 2025 contrast between western agriculture and eastern shrubland
The general land cover map immediately separates the western and eastern parts of Kern County. Large yellow agricultural areas occupy much of the west and northwest, with broad grassland around and between them. Farther east, brown shrubland becomes the dominant color, while scattered forest and barren areas appear through the mountain and desert-facing interior. The map is a useful reminder that a countywide percentage cannot describe every part of a county equally well.
Shrubland covers 38.55%, making it the largest single 2025 class. Its broadest continuous areas appear in the eastern and southeastern portions of the county, with additional patches around central mountain terrain. Shrubland is not the same as barren land and should not be treated as forest. It represents land where shrub-form vegetation is the dominant mapped cover. The classification does not identify individual plant species, land ownership, or the management status of each shrub-covered cell.
Grassland is the second-largest class at 29.26%. Light green areas are common around the agricultural west and across open parts of the central county. A grassland class tells readers what kind of surface vegetation was mapped, but it does not establish whether the land is grazed, protected, vacant, or managed for some other purpose. That distinction matters in Kern County, where open land can serve many different agricultural, environmental, and development roles.
Agriculture accounts for 18.40% and is clearly concentrated in the western part of the map. Large connected blocks extend across the northwestern and central-western area instead of being spread evenly across the county. Kern County’s Agriculture and Measurement Standards Department maintains separate GIS layers designed to locate production agricultural field boundaries more precisely. The land cover map is therefore best used for the broad agricultural pattern, while the county’s crop GIS is more appropriate when field-level agricultural boundaries are needed.
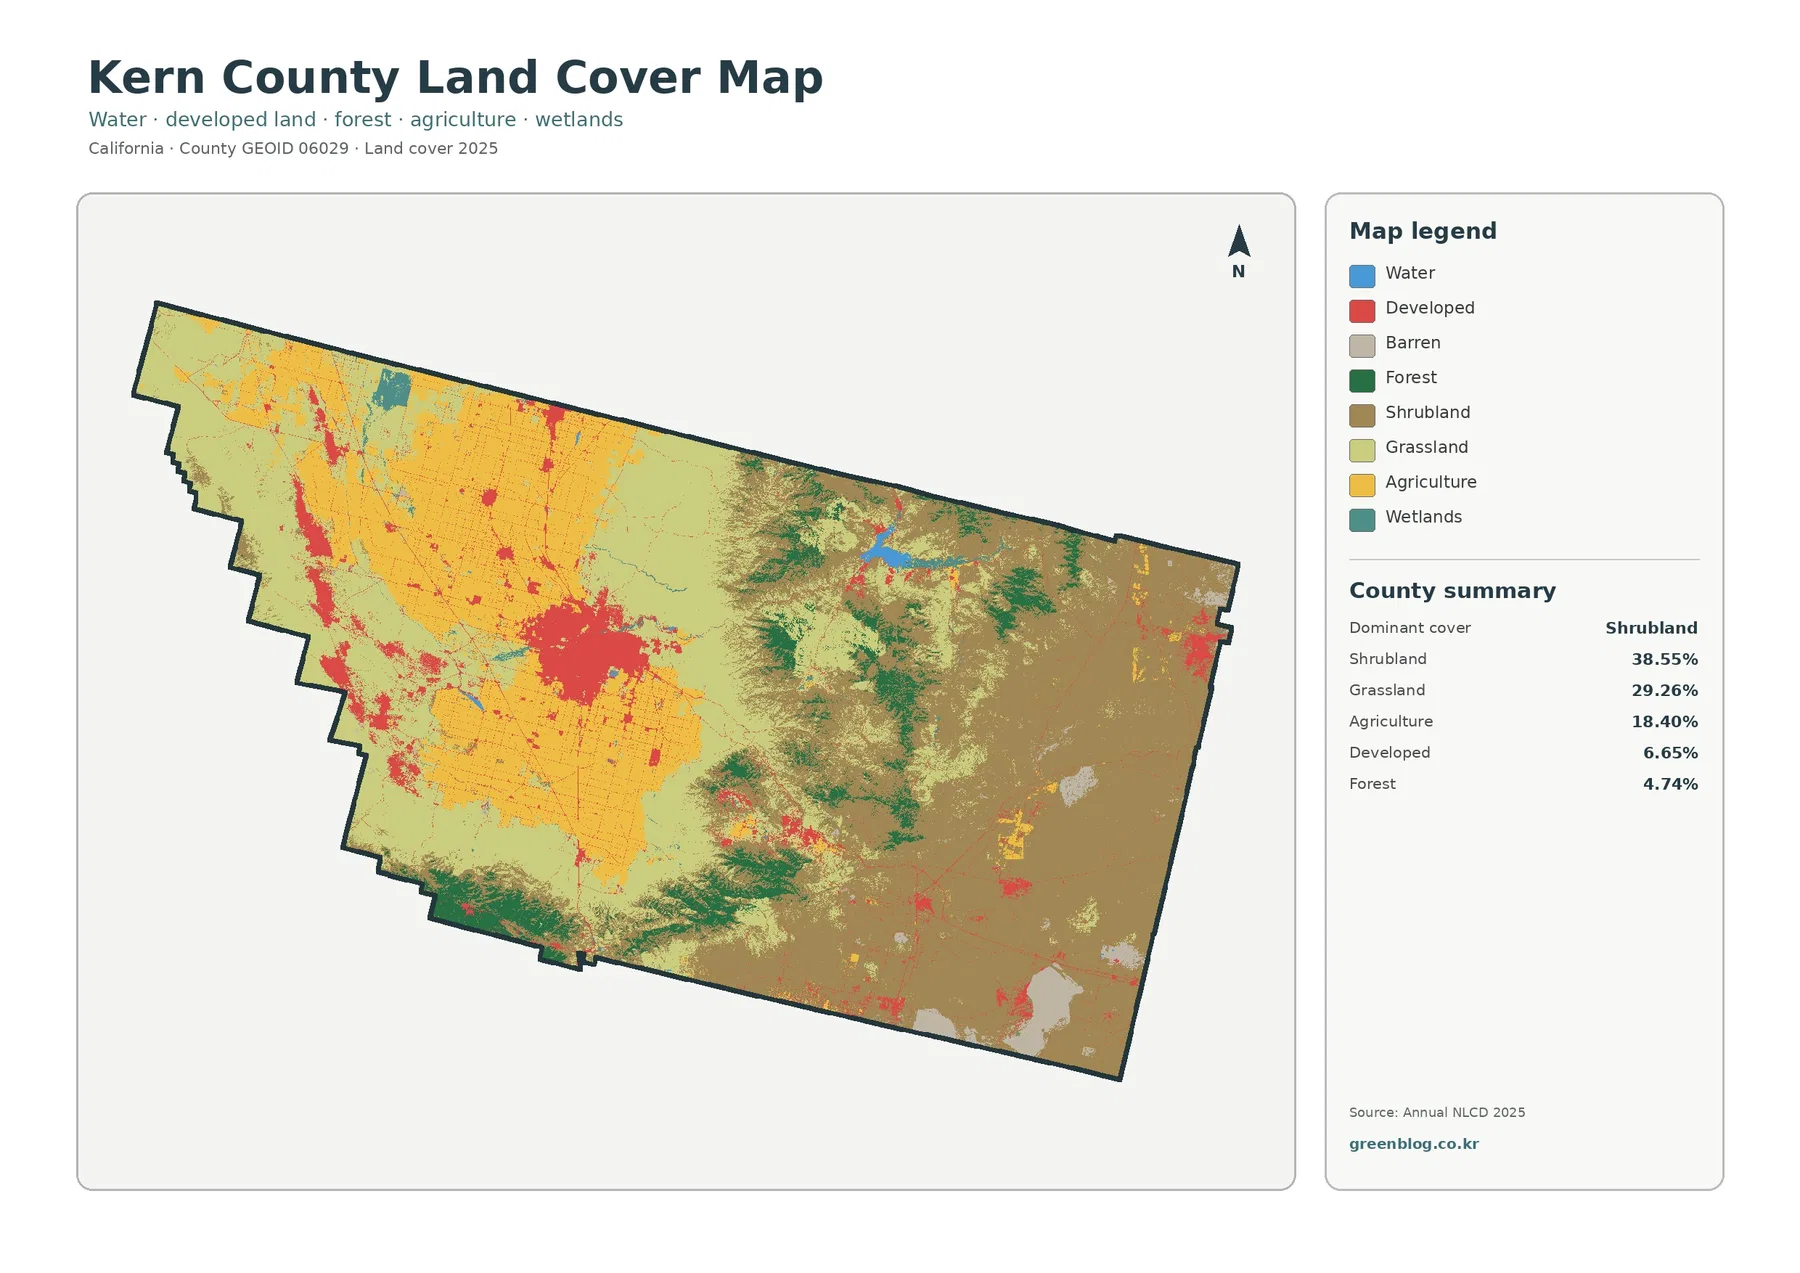
Developed land represents 6.65%, but it is visually prominent because one large red concentration sits in the central-western portion of the county. Official county profiles identify Bakersfield as the county seat and the principal population center, so that large developed zone can be understood in the context of the Bakersfield urban area. Smaller red patches and corridors appear elsewhere. The image is not detailed enough to trace exact city limits or individual roads, so municipal and transportation GIS should be used for that purpose.
The forest and farmland view separates the agricultural belt from mountain vegetation
The forest and farmland map reduces the legend to a smaller group of classes, making the county’s broad land pattern easier to explain in a report or classroom. Forest covers 4.74%, agriculture 18.40%, grassland 29.26%, shrubland 38.55%, wetlands 0.58%, and water 0.23%. The western agricultural blocks stand out clearly, while forest appears in narrower mountain areas through the center, south, and parts of the northeast.
The forest share is small at the county scale, but green patches form distinct mountain groups. Kern County’s own geographic profile describes a county spanning the southern San Joaquin Valley along with portions of the Sierra Nevada, Coast Ranges, and Mojave Desert. The land cover map does not label all of those landforms, but the official description is useful background for the sharp change from agricultural lowlands to forested mountain areas and then to broad shrub and grass cover farther east.
Agricultural cover remains concentrated in the west, where yellow forms some of the largest continuous areas in the map. The county’s agriculture GIS is a useful companion source because it maintains mapped production field boundaries by year. These two products should not be assumed to be identical. Annual NLCD groups surface cover at a raster scale, while the county agricultural layer is designed around production field mapping and agricultural administration.
Water covers 0.23% and wetlands 0.58%, so neither class occupies much of Kern County as a percentage. Even so, a larger blue water feature is visible east of the central agricultural area and smaller aquatic or wetland patches occur elsewhere. Narrow streams, wetland edges, and small ponds can be generalized in a roughly 30-meter raster product. Readers who need drainage, wetland, or water-resource boundaries should use a dedicated hydrology dataset rather than the land cover map alone.
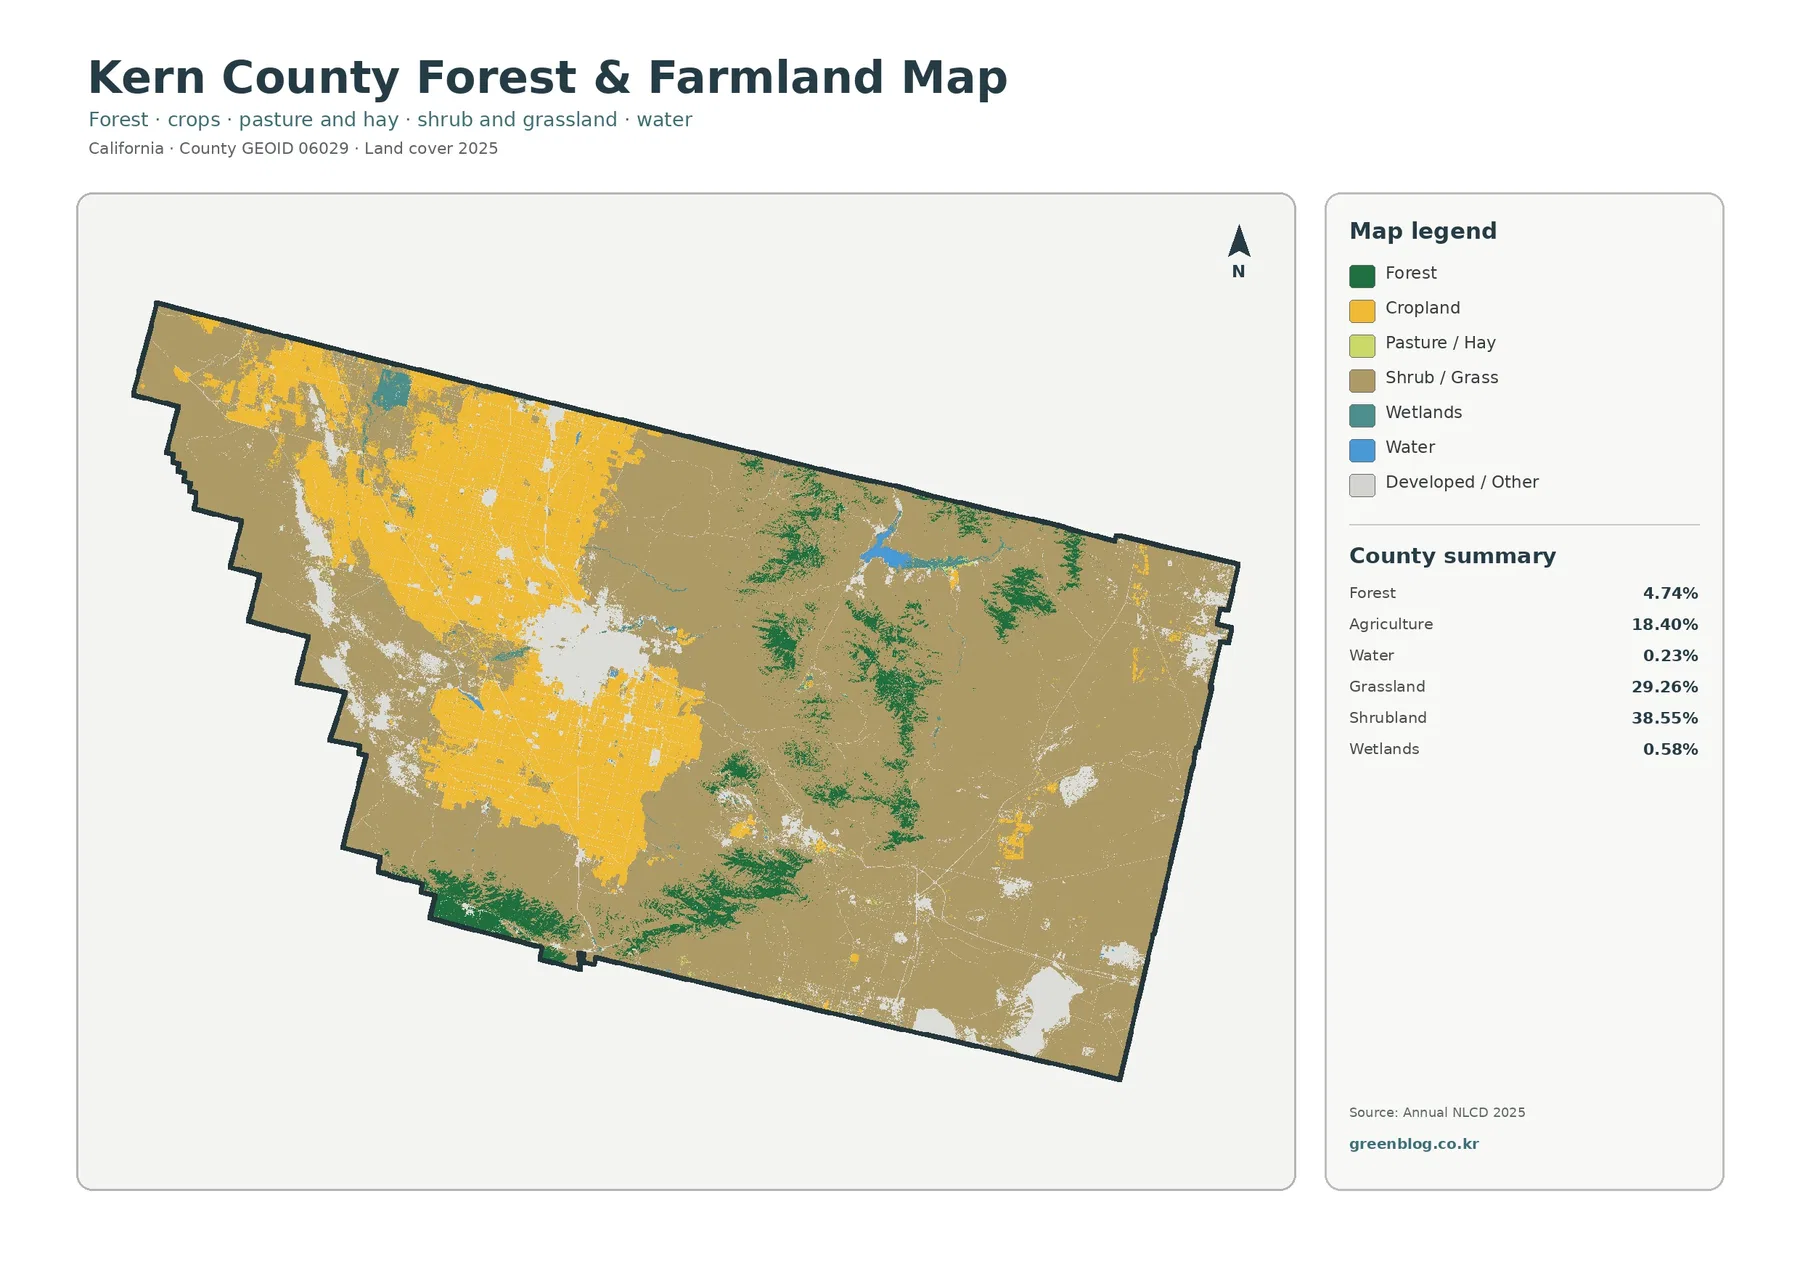
This simplified view works well when the goal is to compare productive agricultural land with mountain and open-land vegetation. It does not provide crop species, farm ownership, grazing status, or forest type. For a broad county overview, that simplification is helpful. For agricultural management, forestry, or habitat work, it should serve as an orientation map before the reader moves to a more specialized local dataset.
Impervious surfaces concentrate around Bakersfield and smaller settlement corridors
Impervious surface describes roofs, pavement, parking areas, and other hard surfaces that do not readily absorb water. Kern County’s 2025 mean impervious value is 1.90%, and 1.39% of the county is mapped at 50% or greater imperviousness. Developed land covers 6.65%, which is a different measure. Developed cells can contain trees, yards, bare soil, and other permeable surfaces, so a developed-land percentage is expected to be larger than the hard-surface percentage.
The most intense red area forms a large cluster in the central-western county. That location corresponds with the biggest developed zone on the general land cover map and sits in the broader Bakersfield area identified in official county planning and profile material. Smaller red marks extend north and west, while additional small clusters appear in the south and east. Most of the shrub-dominated eastern county remains white or very pale on the impervious map.
A mean impervious value of 1.90% is a countywide average, not a description of every community. It combines densely paved urban areas with thousands of square miles of agricultural, mountain, grassland, and shrubland surfaces. It should therefore not be used as the pavement percentage for a neighborhood, town, or watershed. A local stormwater study would need finer-resolution impervious data plus drainage, slope, soil, and rainfall information.
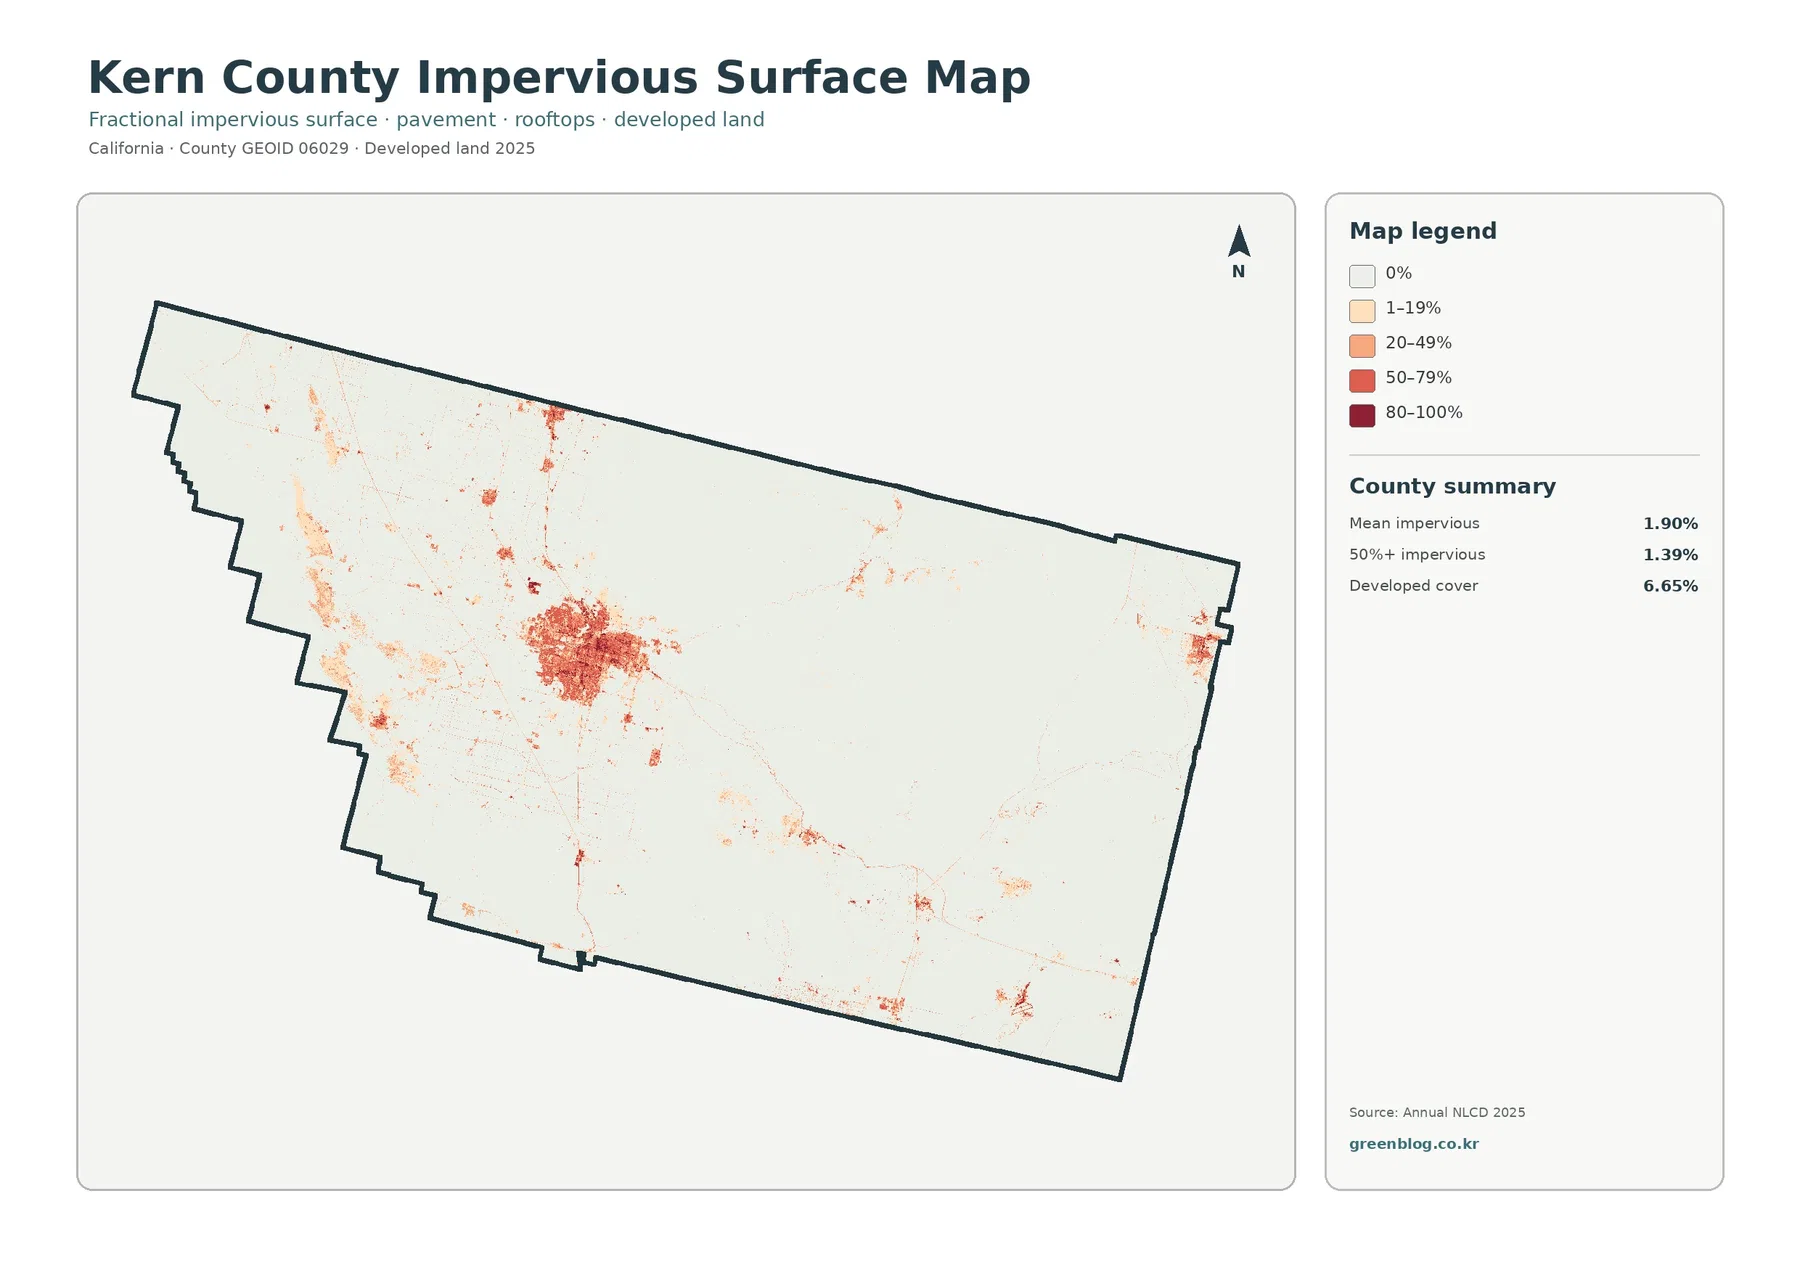
Kern County Planning and Natural Resources publishes General Plan material and land-use maps for regulatory and long-range planning questions. Those documents should be kept separate from the impervious surface map. A red hard-surface cell describes a mapped physical surface in 2025; it does not show zoning, entitlement status, or whether a parcel can be developed. The two sources become useful together only when their different purposes remain clear.
The 1985–2025 map shows 14.90% class difference across several categories
The land cover change map compares the 1985 and 2025 classifications. Total class difference is 14.90%. The largest component is the broad “other difference” category at 6.81%, followed by transition to developed land at 3.17%, agricultural loss at 3.00%, and forest loss at 1.84%. These values describe mapped classification differences between two dates. They do not mean that 14.90% of Kern County changed permanently for one cause.
Red transition-to-developed cells are especially visible around the large central-western developed area and in several northwestern corridors. Comparing the change map with the 2025 impervious map can show where long-term transitions to developed classes overlap with present-day hard surfaces. The 3.17% value is not a total of building permits, annexations, or zoning changes. It is the share of raster cells assigned to the supplied developed-transition category in this two-date comparison.
Agricultural loss accounts for 3.00% and is most visible around parts of the western agricultural region. Some of those cells may represent real conversion away from agriculture, but crop condition, fallow periods, acquisition date, and classification rules can also affect the mapped result. Kern County’s year-specific agricultural GIS provides a useful independent source when readers need to investigate whether production fields changed over time.
Forest loss is 1.84% and appears in mountain areas as orange patches rather than as one continuous band. A cell that changed from forest to another class may reflect disturbance or vegetation change, but the map cannot identify whether fire, harvest, drought, regrowth, or classification behavior caused the difference. The purple other-difference category is even broader. It is best treated as a locator for places where the two classifications disagree and where intermediate imagery may be worth checking.
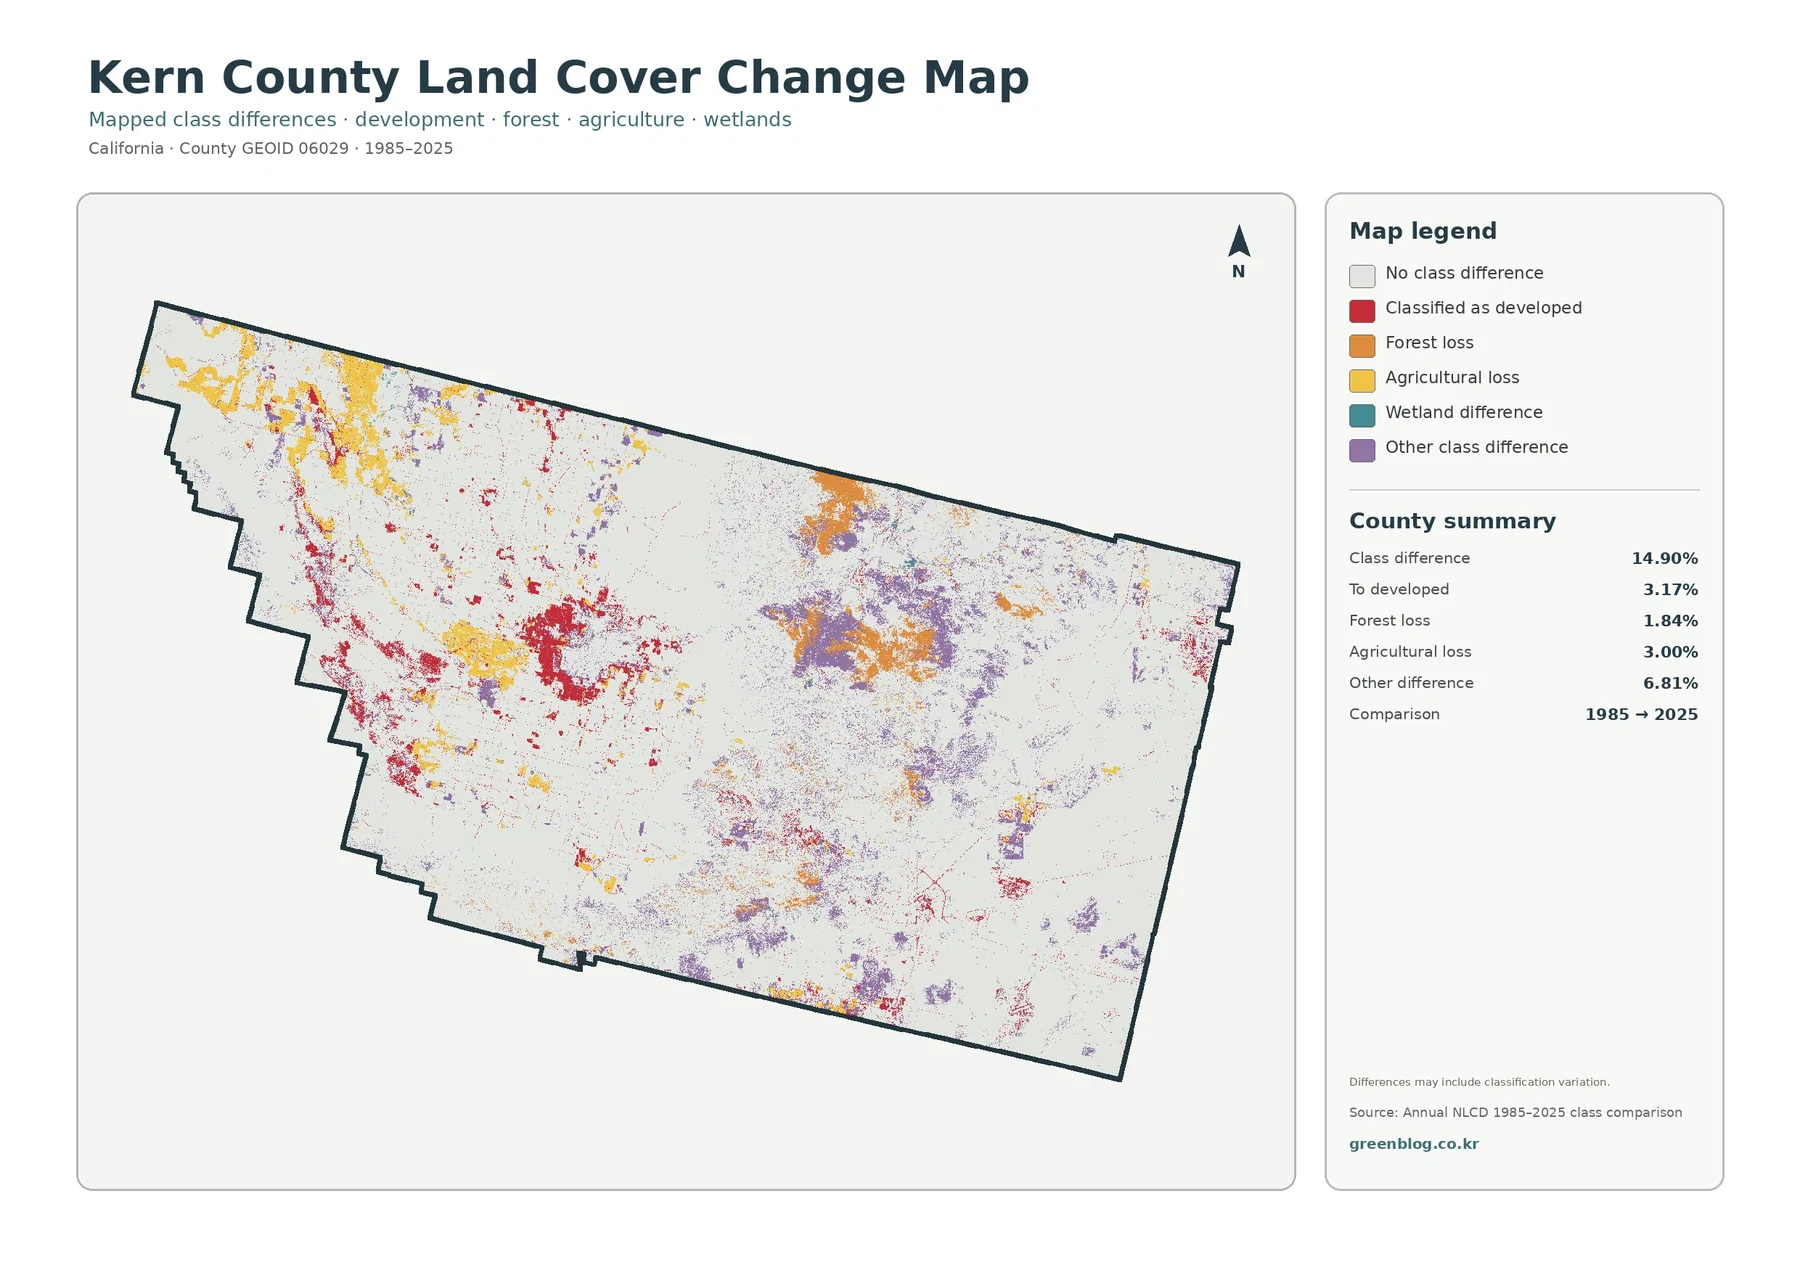
The map includes an important note that differences may include classification variation. This matters in places where a 30-meter cell contains a mixture of crops, bare soil, grass, shrubs, or forest. Dryness, seasonal crop appearance, and image timing can change how a cell is classified. The change map is therefore strongest as a screening and comparison tool, not as proof of a specific development project or ecological event.
County geography helps explain why one map contains so many different patterns
Official Kern County profile material describes a county at the southern end of the San Joaquin Valley that also reaches into the Sierra Nevada, Coast Ranges, and Mojave Desert. The land cover map shows a similarly varied visual pattern: agriculture dominates large western blocks, forest is concentrated in mountain areas, and shrubland and grassland become much more important across the central and eastern county. The official geography provides context, but it should not be used to assign a specific land cover class to every named landform.
For an agricultural presentation, the general land cover and forest/farmland maps are the most useful pair. The first shows agriculture within the complete county classification, and the second strips away some of the competing detail. Readers can then compare the 18.40% agricultural share with the surrounding grassland and shrubland and see why field-level crop GIS is still necessary for precise agricultural boundaries.
For an urban or infrastructure discussion, the general and impervious maps work better together. Developed land at 6.65% describes a broader developed footprint, while the 1.90% mean impervious value emphasizes the smaller share actually occupied by hard surfaces. The central-western concentration stands out on both maps, but the impervious image makes the difference between a developed landscape and fully paved ground much easier to explain.
For long-term comparison, the current 2025 maps should be visible before the change map is introduced. A red, orange, yellow, or purple change cell does not tell the reader what the current land cover is. Looking back to the current map makes it possible to identify whether the present-day surface is agricultural, grassland, shrubland, forest, developed, water, or another class. Captions should keep the 1985–2025 comparison period explicit.
Download the four original JPG maps
The WebP images on this page are convenient for fast browsing, while the downloadable ZIP contains four original JPG maps: 2025 general land cover, forest and farmland, impervious surface and developed land, and the 1985–2025 land cover change comparison. Because the maps use the same county boundary, they can be placed side by side in reports, slide decks, lessons, or research notes.
Keep the legend and date visible when reusing the images. Shrubland, grassland, and agriculture are separate classes, developed cover is not the same as impervious percentage, and the change map compares two years rather than depicting current conditions. Those distinctions can be lost if the images are cropped too tightly or if their captions are removed.
These are county-scale reference maps, not parcel surveys or regulatory documents. They do not replace zoning, assessor records, agricultural field maps, legal wetland boundaries, engineering plans, or site-specific habitat studies. When a decision depends on an exact boundary, the best workflow is to use these maps to locate the area of interest and then move to the responsible county or agency dataset.
Limits of a 30-meter land cover classification
Annual NLCD products generally classify the landscape with raster cells about 30 meters across. That scale is efficient for a countywide overview, but it simplifies narrow roads, small buildings, stream edges, small wetlands, crop-field edges, and sharp transitions between open land and forest. A single cell may contain crops, soil, grass, shrubs, and pavement even though the map must assign one land cover class or one impervious percentage.
Mixed cells are especially relevant in Kern County because agricultural fields, open grassland, shrubland, and mountain vegetation often meet along complex boundaries. A map edge can therefore look cleaner or more irregular than the real landscape. The data are well suited to comparing large areas and recognizing concentrations, but they should not be used to measure a parcel or determine the exact edge of a field.
The observation year matters as well. The three current-condition maps represent 2025. Development, crop changes, fire, regrowth, or water conditions after that year are not included. The change map compares only 1985 with 2025, so it cannot show every intermediate event. A location may have changed several times and returned to a similar class before the end date.
Kern County’s General Plan and GIS resources answer different questions from the land cover maps. Planning documents describe policy, land-use designations, and long-term decisions. County agriculture GIS maps production field boundaries. Annual NLCD provides a consistent surface classification. Using the three together can improve context, but one dataset should never be substituted for another.
With those limits in mind, the four maps provide a strong visual summary of Kern County. Shrubland and grassland make up the largest shares, agriculture forms extensive western blocks, forest occupies smaller mountain areas, and developed and impervious surfaces cluster most strongly in the central-western urban area. The 1985–2025 comparison adds locations where those classifications differ over time without pretending to identify a cause for every changed cell.
Frequently Asked Questions
What is the largest 2025 land cover class in Kern County?
Shrubland is the largest class at 38.55%, followed by grassland at 29.26% and agriculture at 18.40%. The map shows the strongest agricultural concentration in the west and much broader shrubland in the east and southeast.
Why is developed land 6.65% while mean impervious surface is only 1.90%?
Developed land is a broader land cover category. Developed cells can still contain trees, yards, soil, and other permeable surfaces. Impervious data measure hard surfaces such as roofs and pavement, so the countywide impervious mean is lower.
Does 14.90% class difference mean that exactly 14.90% of Kern County permanently changed?
No. The change map compares 1985 and 2025 classifications and can include classification variation. Intermediate imagery, county agricultural GIS, and other local records are needed before assigning a specific cause to a changed cell.
Sources and reference links
Land cover and impervious surface classifications can be reviewed through MRLC Annual NLCD Data and the USGS Annual NLCD Land Cover Classification. County boundary and FIPS reference data are available from U.S. Census Bureau TIGER/Line.
County planning material is available through Kern County Planning and Natural Resources General Plans & Elements, and the county’s broader mapping resources are listed in the Kern County GIS Menu. Production agricultural field boundaries can be explored through the Kern County Agriculture Historical Crops GIS.
Map File Information
The ZIP includes four original JPG maps for Kern County: 2025 general land cover, forest and farmland, impervious surface and developed land, and 1985–2025 land cover change.
- Included Files: Use only the versions confirmed in the article and supplied images
- File Type: Use the confirmed download contents
- Intended Use: Printing, education, presentations, and map-based projects
Related Maps
- Alameda County California Land Cover Map
- Alpine County California Land Cover Map
- Amador County California Land Cover Map
Green Map creates custom-edited map images using open geographic data sources such as geoBoundaries, Natural Earth, OpenStreetMap, and government open data.
These maps are edited visual materials, not raw data files, and are provided for education, documents, presentations, and graphic reference.