The Contra Costa County California Land Cover Map captures one of the sharpest land-cover contrasts in the Bay Area. Dense developed cover dominates much of the western and central county, broad grassland and shrubland occupy the interior hills, and agriculture becomes much more visible toward the eastern Delta side. The 2025 summary lists developed land at 35.49%, grassland at 25.75%, shrubland at 12.55%, agriculture at 9.85%, forest at 7.92%, water at 5.49%, and wetlands at 2.61%.
This page provides four related map views: general land cover, forest and farmland, impervious surface and developed land, and a 1985–2025 land-cover comparison. The WebP images are meant for quick on-page reading, while the original JPG maps can be downloaded together in one ZIP. Each sheet is useful at county scale, but none should be treated as a parcel survey, zoning map, or legal land-use record.
Table of Contents
A county where urban cover, open hills, and Delta agriculture meet
Contra Costa County does not have a single dominant landscape from west to east. The official county planning context describes West County as the first part of the county to urbanize heavily, Central County as a developed urban area, and East County as a historically agricultural landscape that has also experienced substantial residential growth. That broad history is visible in the 2025 map without requiring the map to label every city or planning district.
Developed cover forms a large continuous presence at the western end and across much of the north-central portion of the county. Farther inland, the red developed class is interrupted by extensive grassland, shrubland, and smaller forest patches. At the eastern end, development remains visible, but large blocks of agricultural cover and water channels make the surface pattern noticeably different from the dense western side.
The 35.49% developed figure is important, yet it should not be read as 35.49% pavement. NLCD developed classes can include lawns, trees, bare soil, and other pervious surfaces mixed with buildings and roads. The separate impervious map is therefore the better tool for estimating where hard surfaces such as rooftops, parking lots, and pavement are most concentrated.
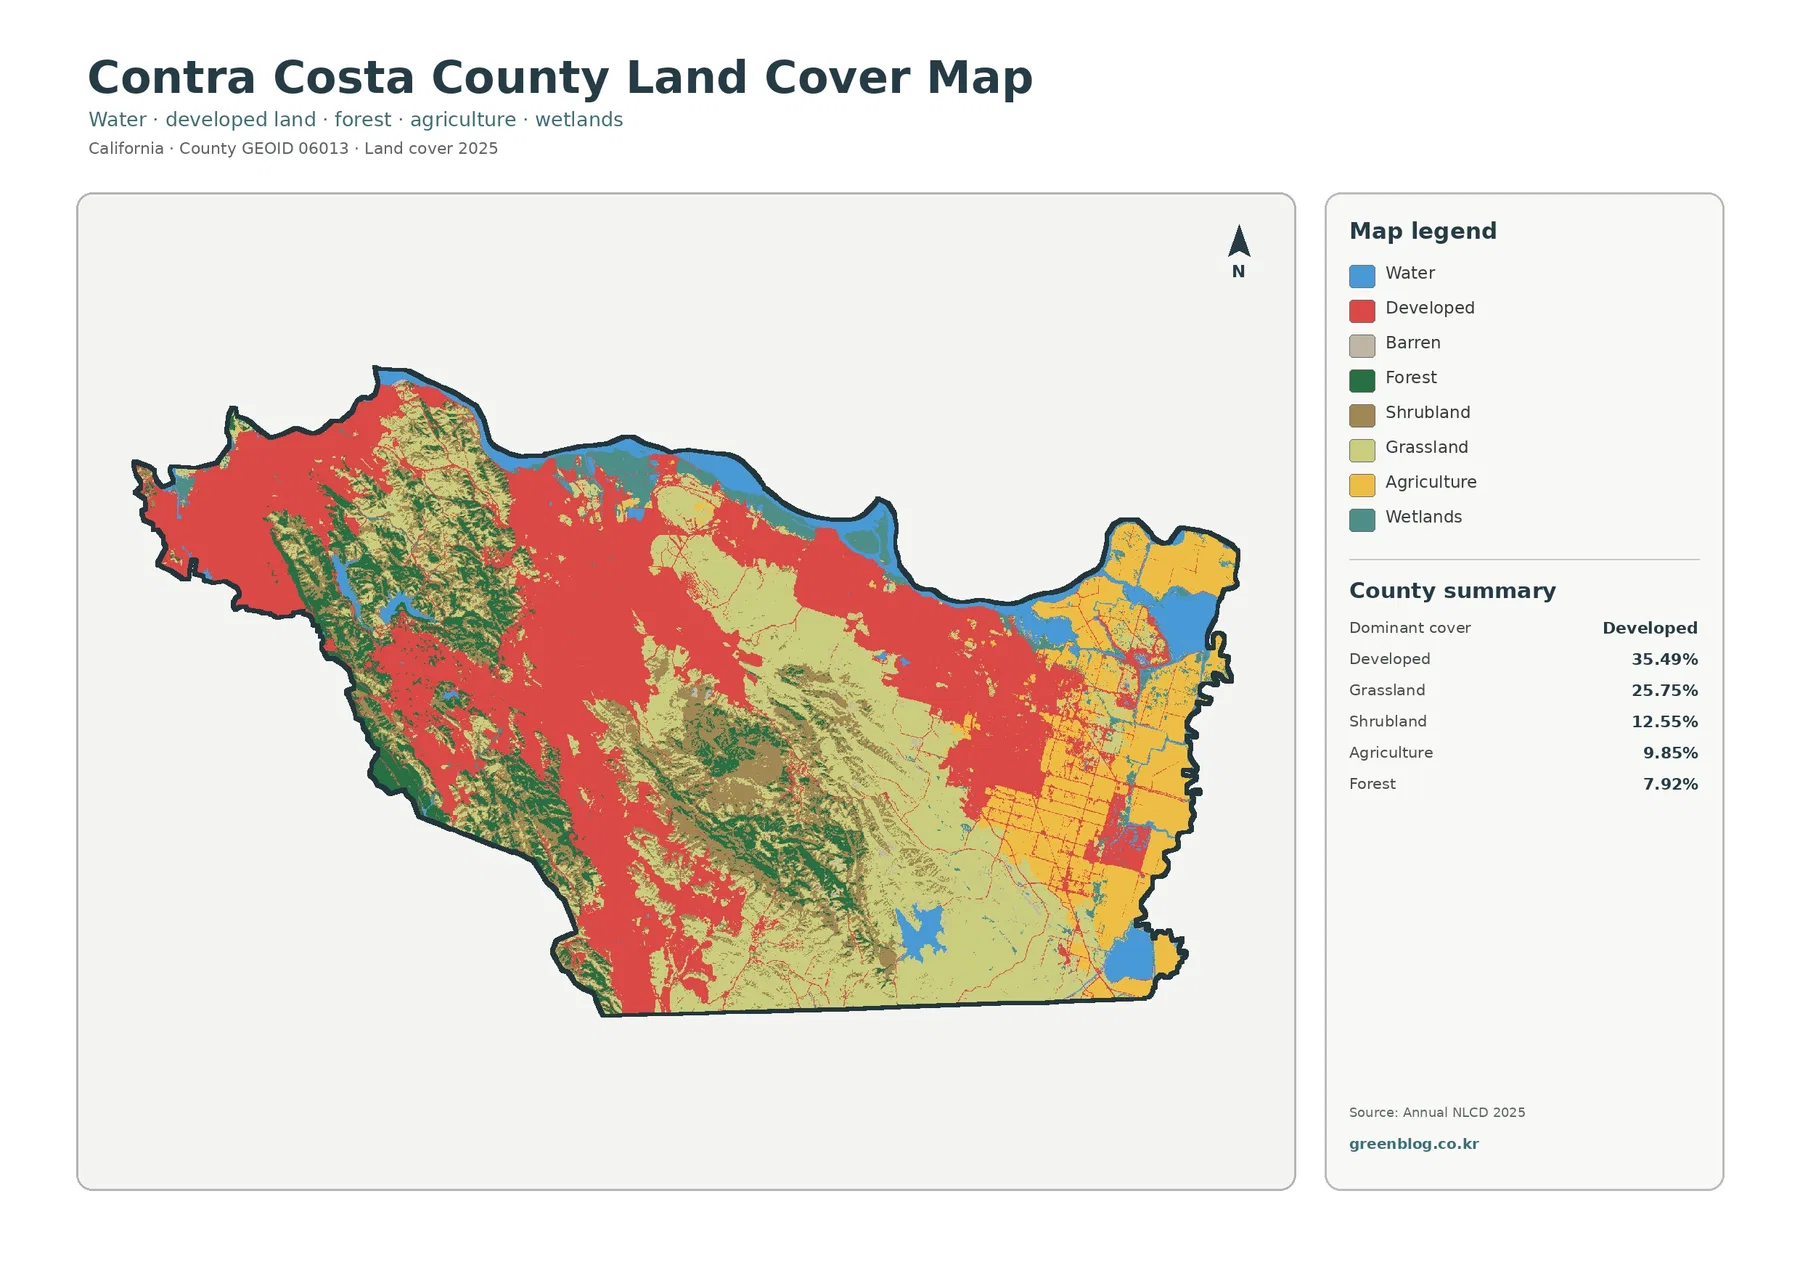
One advantage of the full land-cover sheet is that it keeps the transition zones visible. The interior is not simply an empty gap between the urban west and agricultural east. Grassland accounts for 25.75% of the county and shrubland another 12.55%, so open vegetation is a major part of the county surface even though developed land is the largest single class.
Water is a useful geographic anchor along the northern and eastern edge
Water covers 5.49% of the mapped county area and is easy to use as a reference when moving between the four sheets. Blue water follows much of the northern edge and continues into the eastern Delta side, while smaller inland water bodies appear as distinct blue patches. The county’s own planning maps identify San Pablo Bay and Suisun Bay as major northern water features, with additional channels toward the Delta.
Wetlands make up 2.61% and are especially noticeable where the map approaches these water margins. Teal wetland cells appear along parts of the northern shoreline and in the eastern lowlands, sometimes next to agriculture or developed cover. Their location matters more than their countywide percentage when the goal is to understand how urban, agricultural, and aquatic environments meet.
Narrow shorelines and channels are also places where a 30-meter raster can simplify reality. A single grid cell may contain open water, wetland vegetation, soil, and pavement, yet the land-cover product assigns one representative class. The map is appropriate for county-scale watershed or environmental education, but a regulatory wetland boundary or a precise shoreline measurement requires a more detailed source.
What the impervious map adds to the developed-land picture
Impervious surface means the share of the ground covered by materials that do not readily absorb water, such as rooftops, pavement, and parking areas. Contra Costa County has a mean impervious value of 15.47%, and 15.15% of the mapped area falls in the 50%-or-higher impervious category. Those numbers are much lower than the 35.49% developed-cover share because the two measures describe different things.
The darkest impervious values are concentrated in the urban west, the northern developed corridor, and major central settlement areas. Narrow lines and branching patterns connect some of these concentrations, reflecting hard-surface corridors within the broader urban fabric. East County also contains clear developed clusters, but the surrounding agricultural and open land keeps large areas at low or near-zero impervious values.
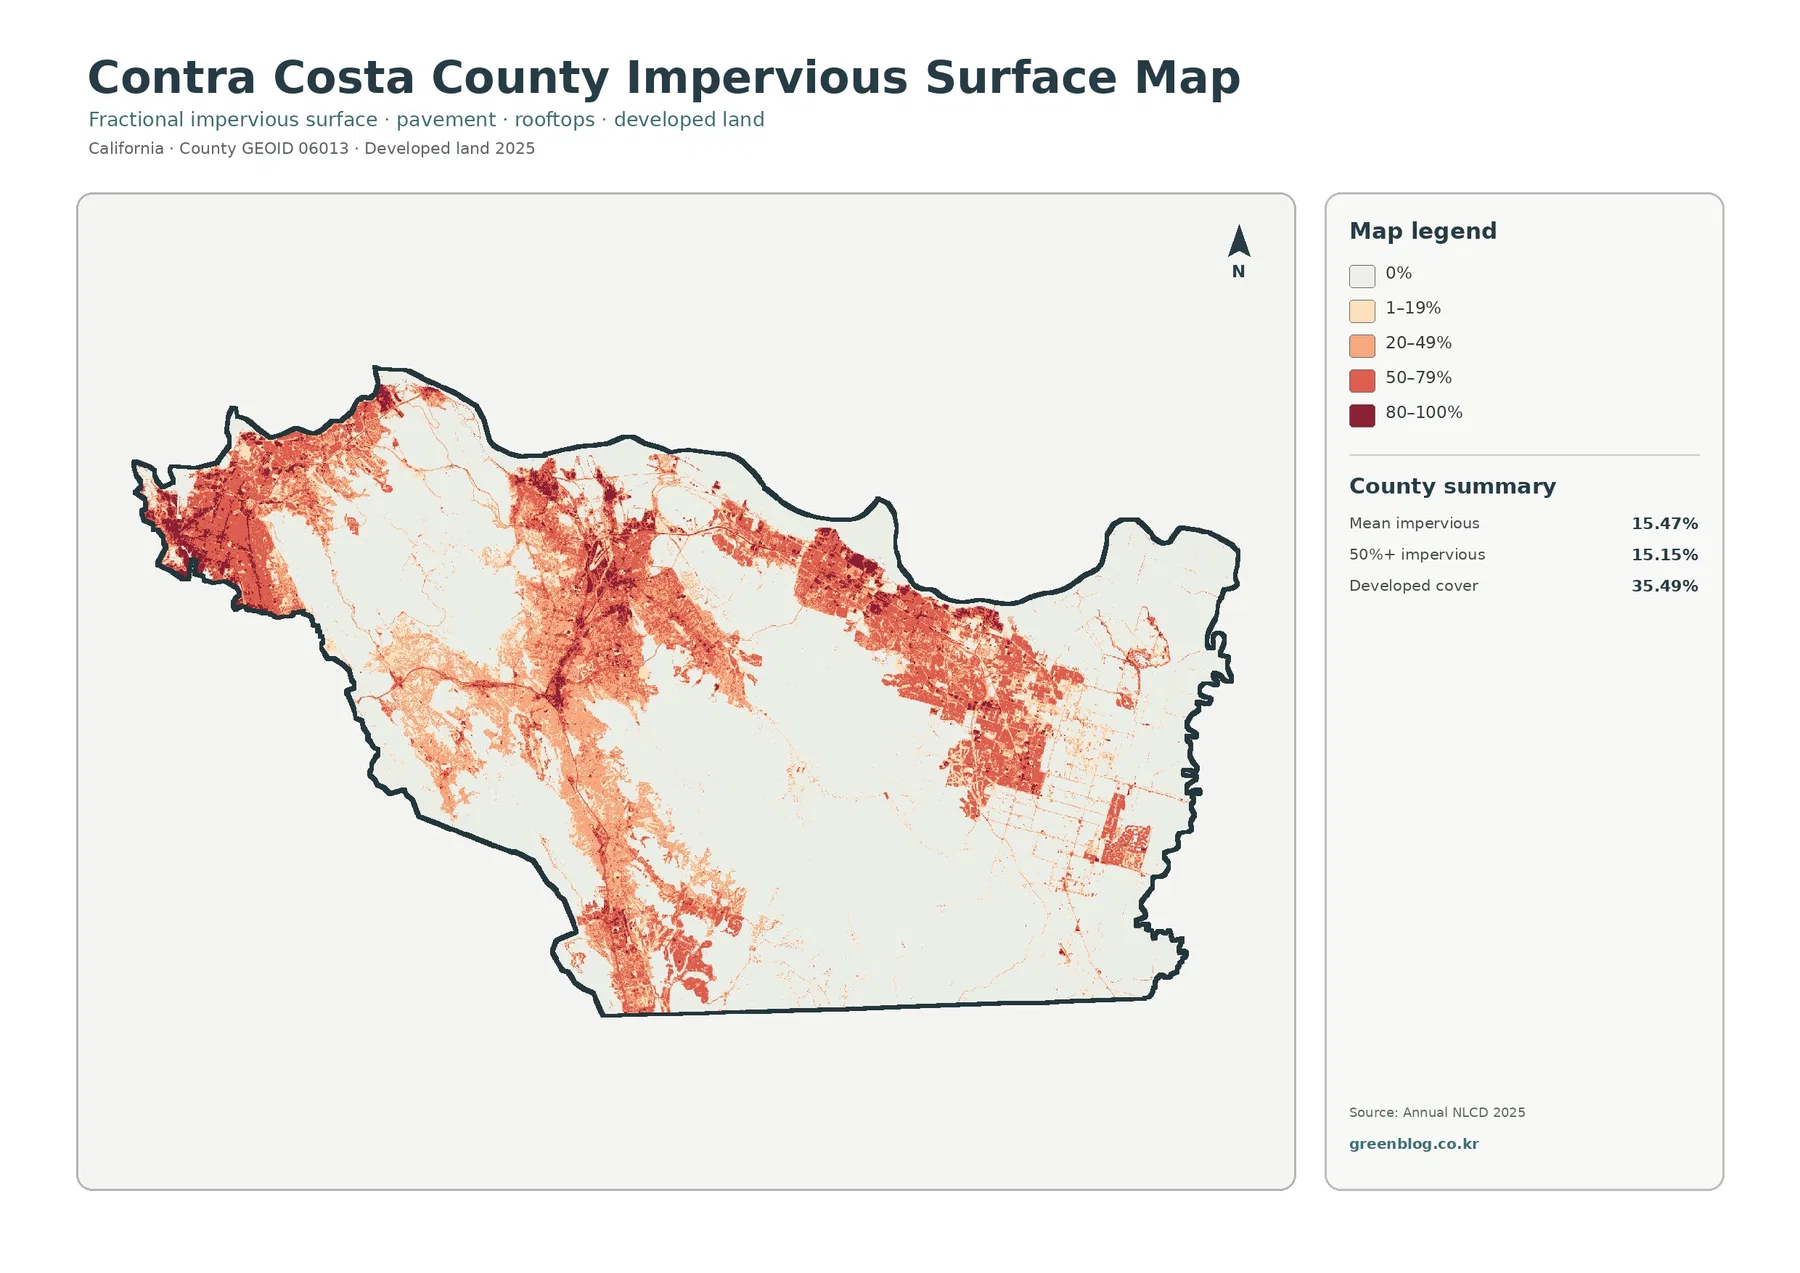
The map should be used to describe concentration rather than cause. A road, business district, or residential area may appear in the same corridor as high impervious values, but the map alone does not establish why development occurred there. Historical planning documents, transportation records, or project-level data are needed before making a causal claim about how a particular urban pattern formed.
For classroom work, environmental presentations, or county comparisons, the impervious sheet is especially helpful because it separates “developed” from “hard-surfaced.” It can support a discussion of stormwater or urban intensity, but it is not a flood-risk model. Runoff also depends on rainfall, soils, slope, drainage systems, channel conditions, and many other factors that are outside this map.
Eastern farmland stands out more clearly when vegetation classes are simplified
The forest-and-farmland map reduces some of the visual complexity of the full land-cover sheet. Agriculture, forest, shrub and grass, water, wetlands, and developed or other cover are easier to compare as broader groups. The eastern end becomes particularly clear: large yellow agricultural blocks sit beside water channels and developed areas, while the middle of the county is dominated by open grass and shrub cover.
Agriculture accounts for 9.85% of the county in the 2025 land-cover summary. Contra Costa County’s planning documents describe agricultural resources and working lands as an important part of East County, and the county maintains a separate Agricultural Land Use Policy. Those planning categories should not be confused with the NLCD agriculture class, which is based on the physical surface visible to remote sensing rather than legal zoning or economic activity.
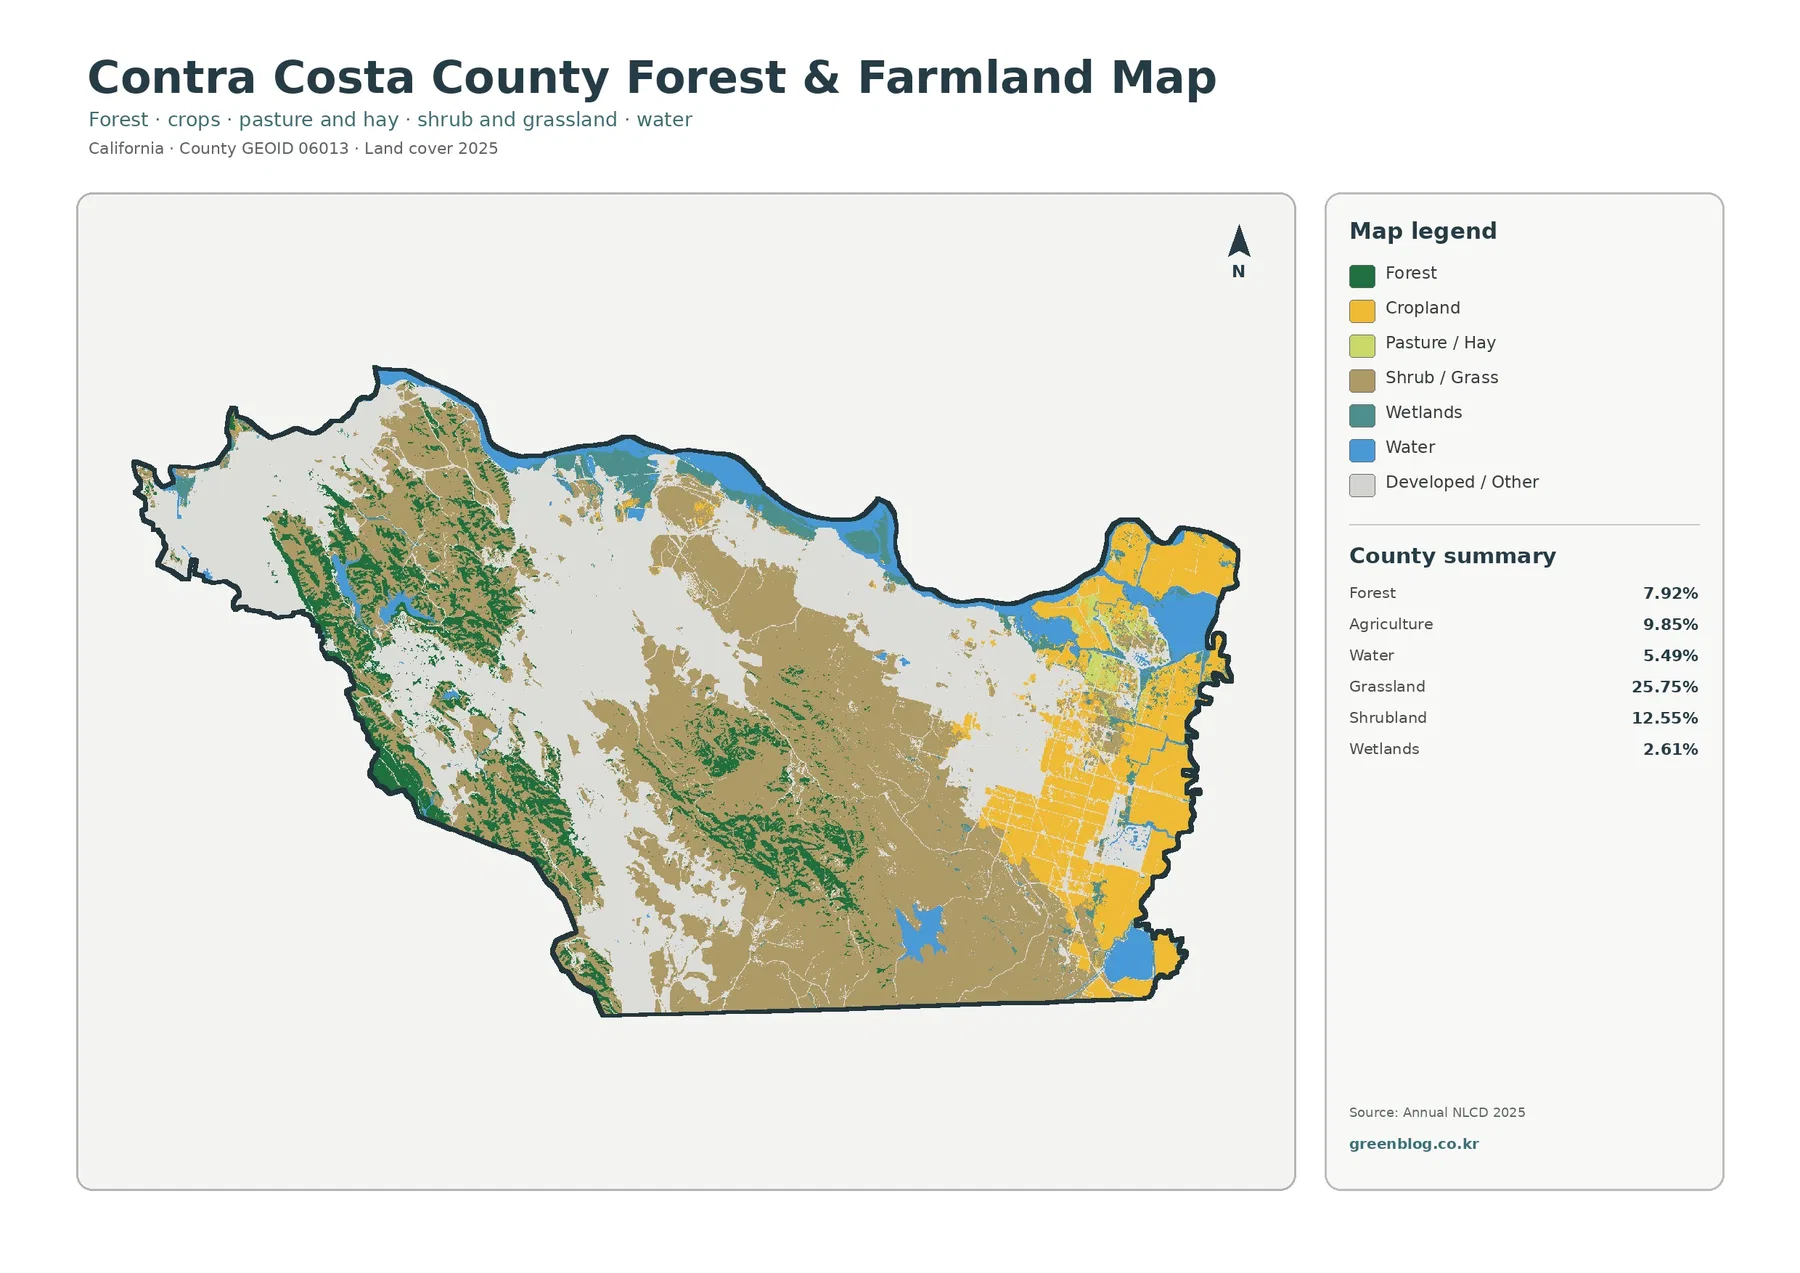
Grassland is the larger open-cover class at 25.75%, with shrubland adding another 12.55%. These classes cover much of the interior and southern hills, where they are mixed with forest rather than forming perfectly clean boundaries. Forest represents 7.92% and appears in concentrated patches across the western and central hills, including several areas where dark green vegetation is surrounded by grass or shrub cover.
This distinction is useful when discussing ranching or open-space landscapes. Land that is used for grazing can still be classified as grassland or shrubland because land cover describes what is physically on the ground, not the legal or economic use of the property. For that reason, the mapped 9.85% agriculture share should not be used as a substitute for a county agricultural acreage report or zoning inventory.
The 1985–2025 comparison highlights where classifications differ
The long-term comparison marks 21.56% of the county as having a different land-cover class between 1985 and 2025. The summary identifies 8.65% as “to developed,” 0.80% as forest loss, 1.15% as agricultural loss, and 10.70% as other class difference. Wetland difference is also shown in the legend, but the map summary does not provide a separate percentage for that category, so no additional number should be inferred.
Red “to developed” cells form some of the strongest patterns on the change map. Large groups are visible in central and eastern settlement areas, with additional patches in the west and south. When these locations are compared with the 2025 land-cover and impervious sheets, many align with places that now have extensive developed or hard-surface cover.
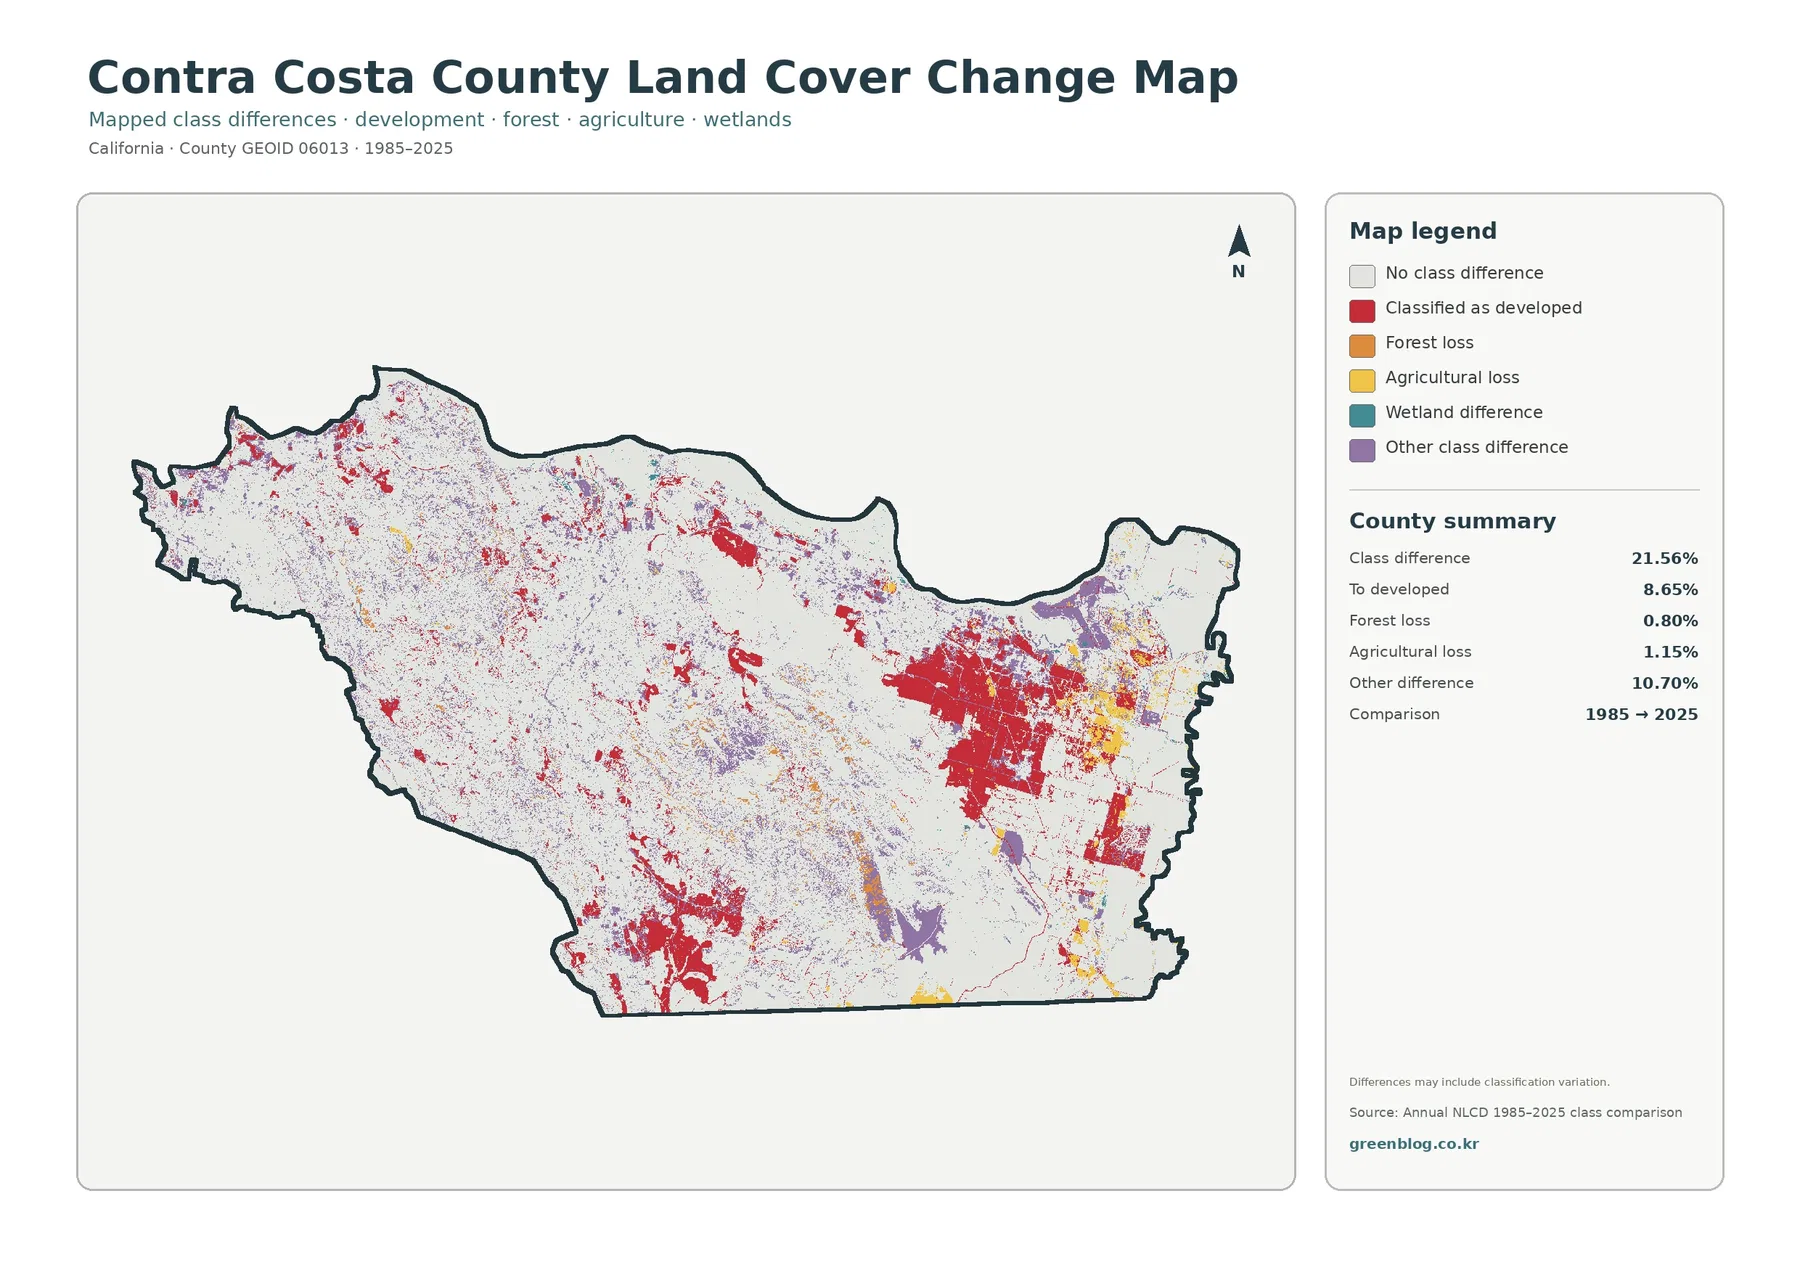
The purple “other class difference” category is widespread in smaller and larger patches across the interior and east. It is not a single land-change process, so it should not be described as one event such as urban growth, drought, or vegetation loss. The safest approach is to locate a purple area on the 2025 map and identify its current class before discussing what the difference might represent.
A long comparison also contains uncertainty. Real surface change may be present, but mixed pixels, seasonal vegetation, classification updates, and differences in source imagery can affect which class is assigned to a 30-meter cell. The 21.56% figure therefore means that the two mapped classifications differ over that share of the county; it does not prove that 21.56% changed legal land use or permanently changed ecological condition.
Choosing the most useful map for a project
Use the general land-cover map first when the project needs a complete county overview. It is the best single sheet for explaining why Contra Costa County looks so different from the bayfront to the Delta: developed land is widespread, interior open vegetation occupies a large share, agriculture is concentrated in the east, and water frames much of the north and east.
The forest-and-farmland view works better when vegetation and agriculture are the main topic. The impervious map is useful for discussing hard surfaces and settlement intensity, while the change sheet is best placed beside a 2025 map so that historical class differences can be interpreted against current cover. Using the maps together prevents a single color or percentage from carrying more meaning than the data support.
The on-page WebP versions are convenient for quick reading and comparison. The original JPG files are more useful for printing, slides, school assignments, reports, and offline reference. All four original JPG maps are packaged together below, making it easy to move between a general overview and more focused land-cover questions without downloading each file separately.
Limits to remember before using the maps as evidence
Annual NLCD is intended for consistent land-cover mapping over broad areas. It does not show parcel ownership, zoning, building permits, legal land-use designations, or survey boundaries. A pixel classified as developed or agricultural is describing the physical surface interpreted from remote-sensing data, not a county planning decision about how that parcel may be used.
Scale is another important limitation. The land-cover products use a 30-meter raster grid, so small buildings, narrow roads, complex shoreline edges, and fine transitions between grass, shrub, forest, and wetland can be generalized. A mixed cell may receive one dominant class even when several surface types are present inside it.
The current land-cover and impervious maps are labeled 2025, while the comparison spans 1985 to 2025. Conditions after those observation dates may differ. For property decisions, regulatory questions, detailed habitat work, engineering, or a claim about the exact cause of a historical change, use current county records and more specialized datasets in addition to these maps.
Frequently Asked Questions
What is the largest land-cover class in Contra Costa County in 2025?
Developed land is the largest class at 35.49%. Grassland follows at 25.75%, with shrubland at 12.55%, agriculture at 9.85%, and forest at 7.92%. Developed cover is especially widespread in the western and central parts of the county.
Why is developed cover 35.49% while mean impervious surface is 15.47%?
Developed land can include lawns, trees, bare soil, and other pervious surfaces within built areas. Impervious surface measures the share covered by hard materials such as rooftops and pavement, so the two percentages describe different characteristics.
Does the 21.56% class difference from 1985 to 2025 equal legal land-use change?
No. It means the mapped land-cover class differs between the two comparison years over 21.56% of the county. Real surface change may be involved, but mixed pixels, vegetation condition, imagery, and classification differences can also affect the result.
Map File Information
The ZIP contains four original JPG maps for Contra Costa County: 2025 land cover, forest and farmland, impervious surface and developed land, and 1985–2025 land-cover change. They are suitable for printing, presentations, classroom reference, and county-scale comparison.
- Included Files: Use only the versions confirmed in the article and supplied images
- File Type: Use the confirmed download contents
- Intended Use: Printing, education, presentations, and map-based projects
Related Maps
- Alameda County California Land Cover Map
- Alpine County California Land Cover Map
- Amador County California Land Cover Map
Sources and further reading
Land-cover and impervious-surface classes can be checked through the MRLC Annual NLCD Data portal and the USGS Annual NLCD Land Cover Classification documentation. County boundaries and geographic identifiers are available from the U.S. Census Bureau TIGER/Line Shapefiles.
For local context, see the official Contra Costa County 2045 General Plan, its Planning Context chapter, and the county’s Agricultural Land Use Policy. These sources describe urban growth, open space, and agricultural planning, which should remain conceptually separate from the physical land-cover classes shown by NLCD.
Green Map creates custom-edited map images using open geographic data sources such as geoBoundaries, Natural Earth, OpenStreetMap, and government open data.
These maps are edited visual materials, not raw data files, and are provided for education, documents, presentations, and graphic reference.