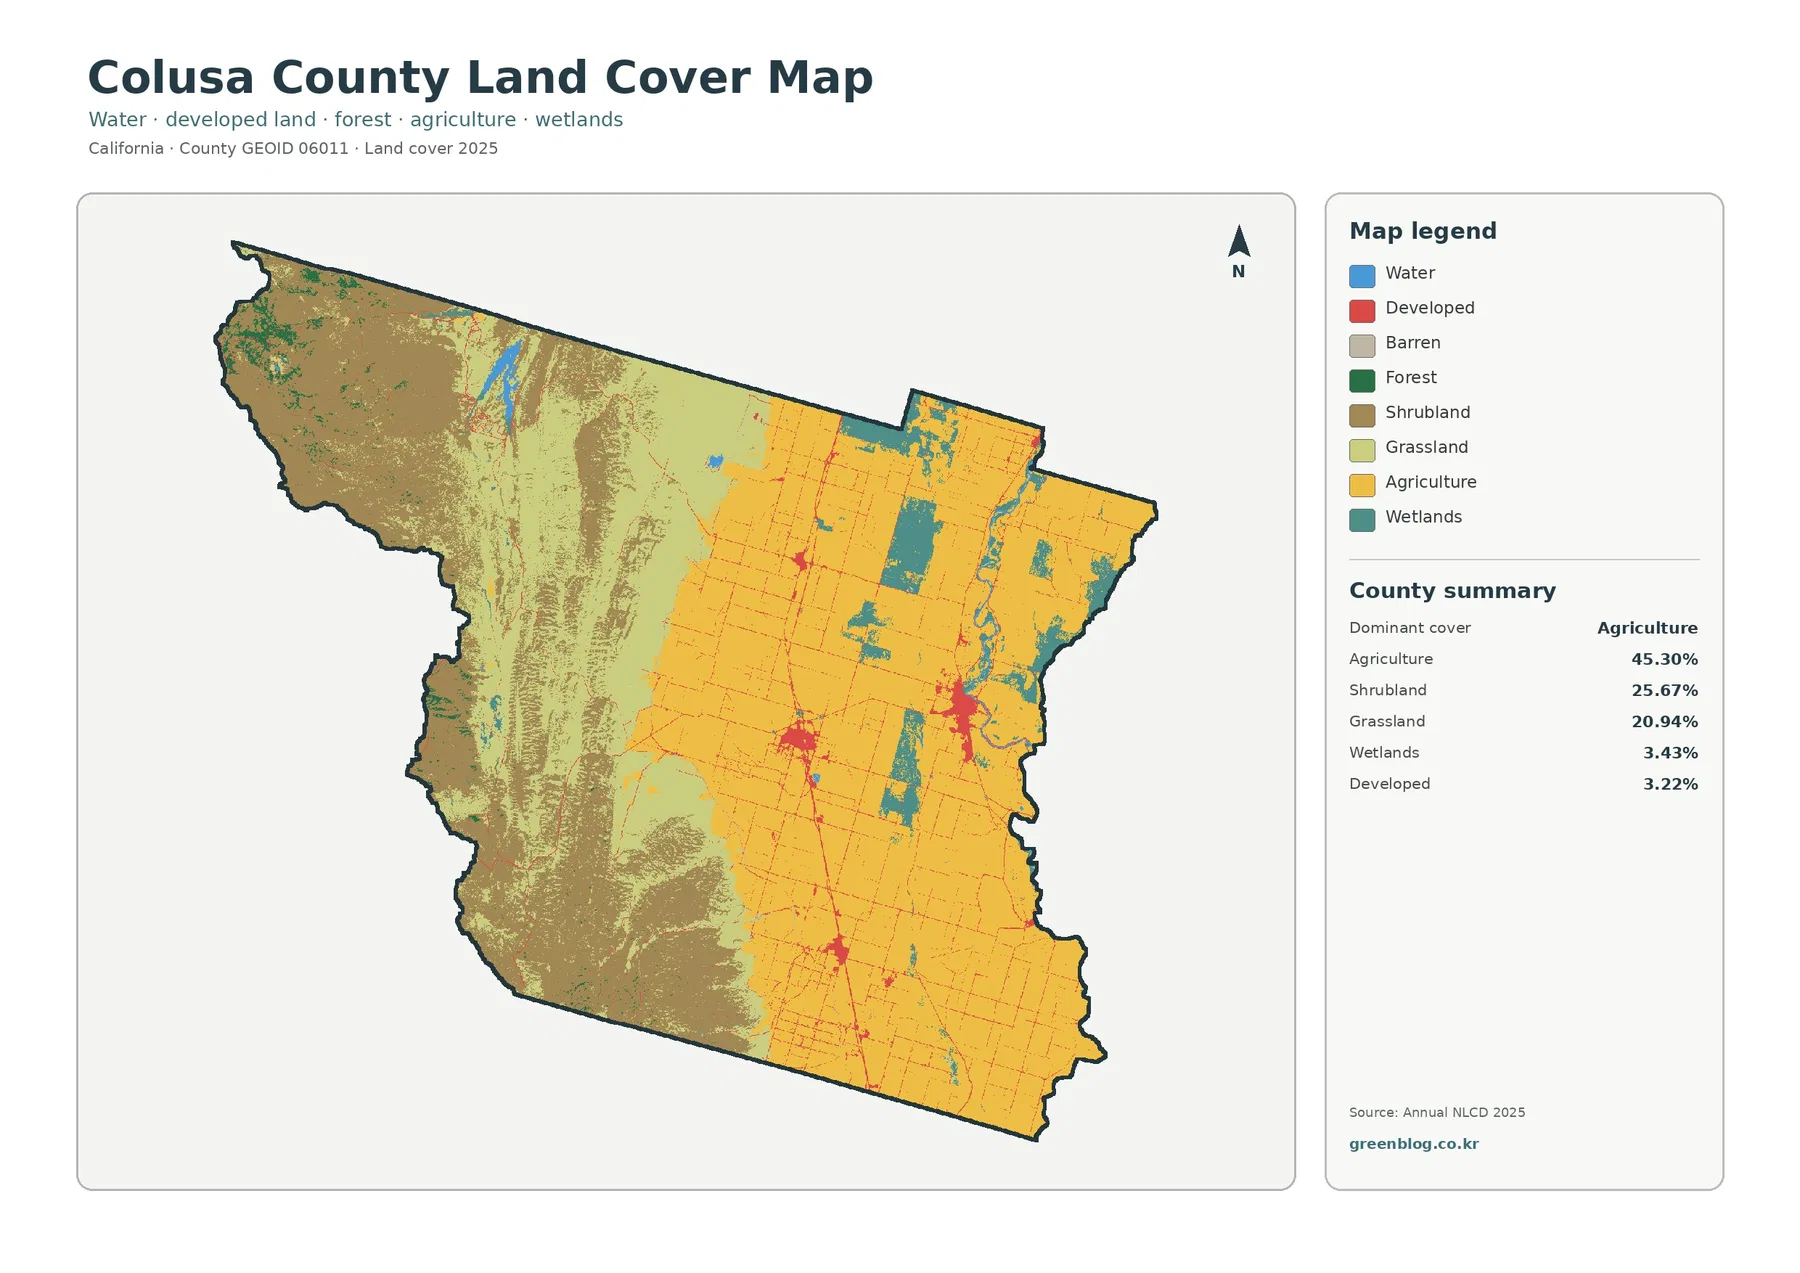
The Colusa County California Land Cover Map set shows a county divided between an intensively cultivated Sacramento Valley floor and much more open cover in the western hills. In the 2025 summary, agriculture is the dominant class at 45.30%. Shrubland accounts for 25.67% and grassland for 20.94%, while wetlands cover 3.43%, developed land 3.22%, forest 0.86%, and water 0.50%. Those numbers become much easier to understand when they are matched to the east–west pattern on the map.
Four views are provided on this page: general land cover, forest and farmland, impervious surface and developed land, and a 1985–2025 land-cover comparison. The WebP versions are convenient for on-page reading, and the four original JPG maps are available together in one download. The set is useful when you want to compare the agricultural plain, the open western uplands, wetland patches, small developed centers, and long-term classification differences without switching between unrelated map boundaries.
Table of Contents
A county split between cultivated valley floor and open western uplands
Colusa County lies on the western side of the lower Sacramento Valley, and the broad land-cover map makes that setting immediately visible. Large yellow agricultural blocks occupy much of the central and eastern half of the county. West of that belt, the colors shift to shrubland and grassland across more irregular terrain. UC Cooperative Extension describes the valley as productive cropland and the western part of the county as defined by the Coastal Mountain Range, a geographic contrast that matches the mapped pattern.
Agriculture at 45.30% is not simply the largest statistic in the legend; it forms the most continuous human-managed cover on the map. The cultivated half contains a fine grid of field and road patterns, with only scattered developed clusters interrupting the yellow surface. That texture is very different from the western third, where broad shrub and grass classes cross the county without the same regular field geometry.
The western uplands should not be mistaken for a heavily forested landscape. Forest represents only 0.86% of the 2025 county summary. Small green areas occur near the northwest and in a few other western locations, but the much larger western classes are shrubland and grassland. Together they account for 46.61% of the county, slightly more than the agriculture class by itself, and they give the western half its open appearance.
Wetlands break up the agricultural plain in a different way. Teal patches and elongated areas appear within or beside the cultivated belt, especially toward the central and eastern portions of the county. Developed land is also present there, but in smaller red clusters. The result is not a simple two-color county; it is a broad valley-to-upland transition with wetlands and settlements embedded within the agricultural side.
Local wetland context helps explain why those teal areas deserve attention. The U.S. Fish and Wildlife Service describes Colusa National Wildlife Refuge as a wetland-dominated refuge in the Colusa Basin, and Delevan National Wildlife Refuge as another primarily wetland site east of Maxwell. These references do not turn the NLCD sheet into a refuge-boundary map, but they confirm that managed and natural wetland environments are an important part of the county landscape.
Why agriculture reaches 45.30% while forest is only 0.86%
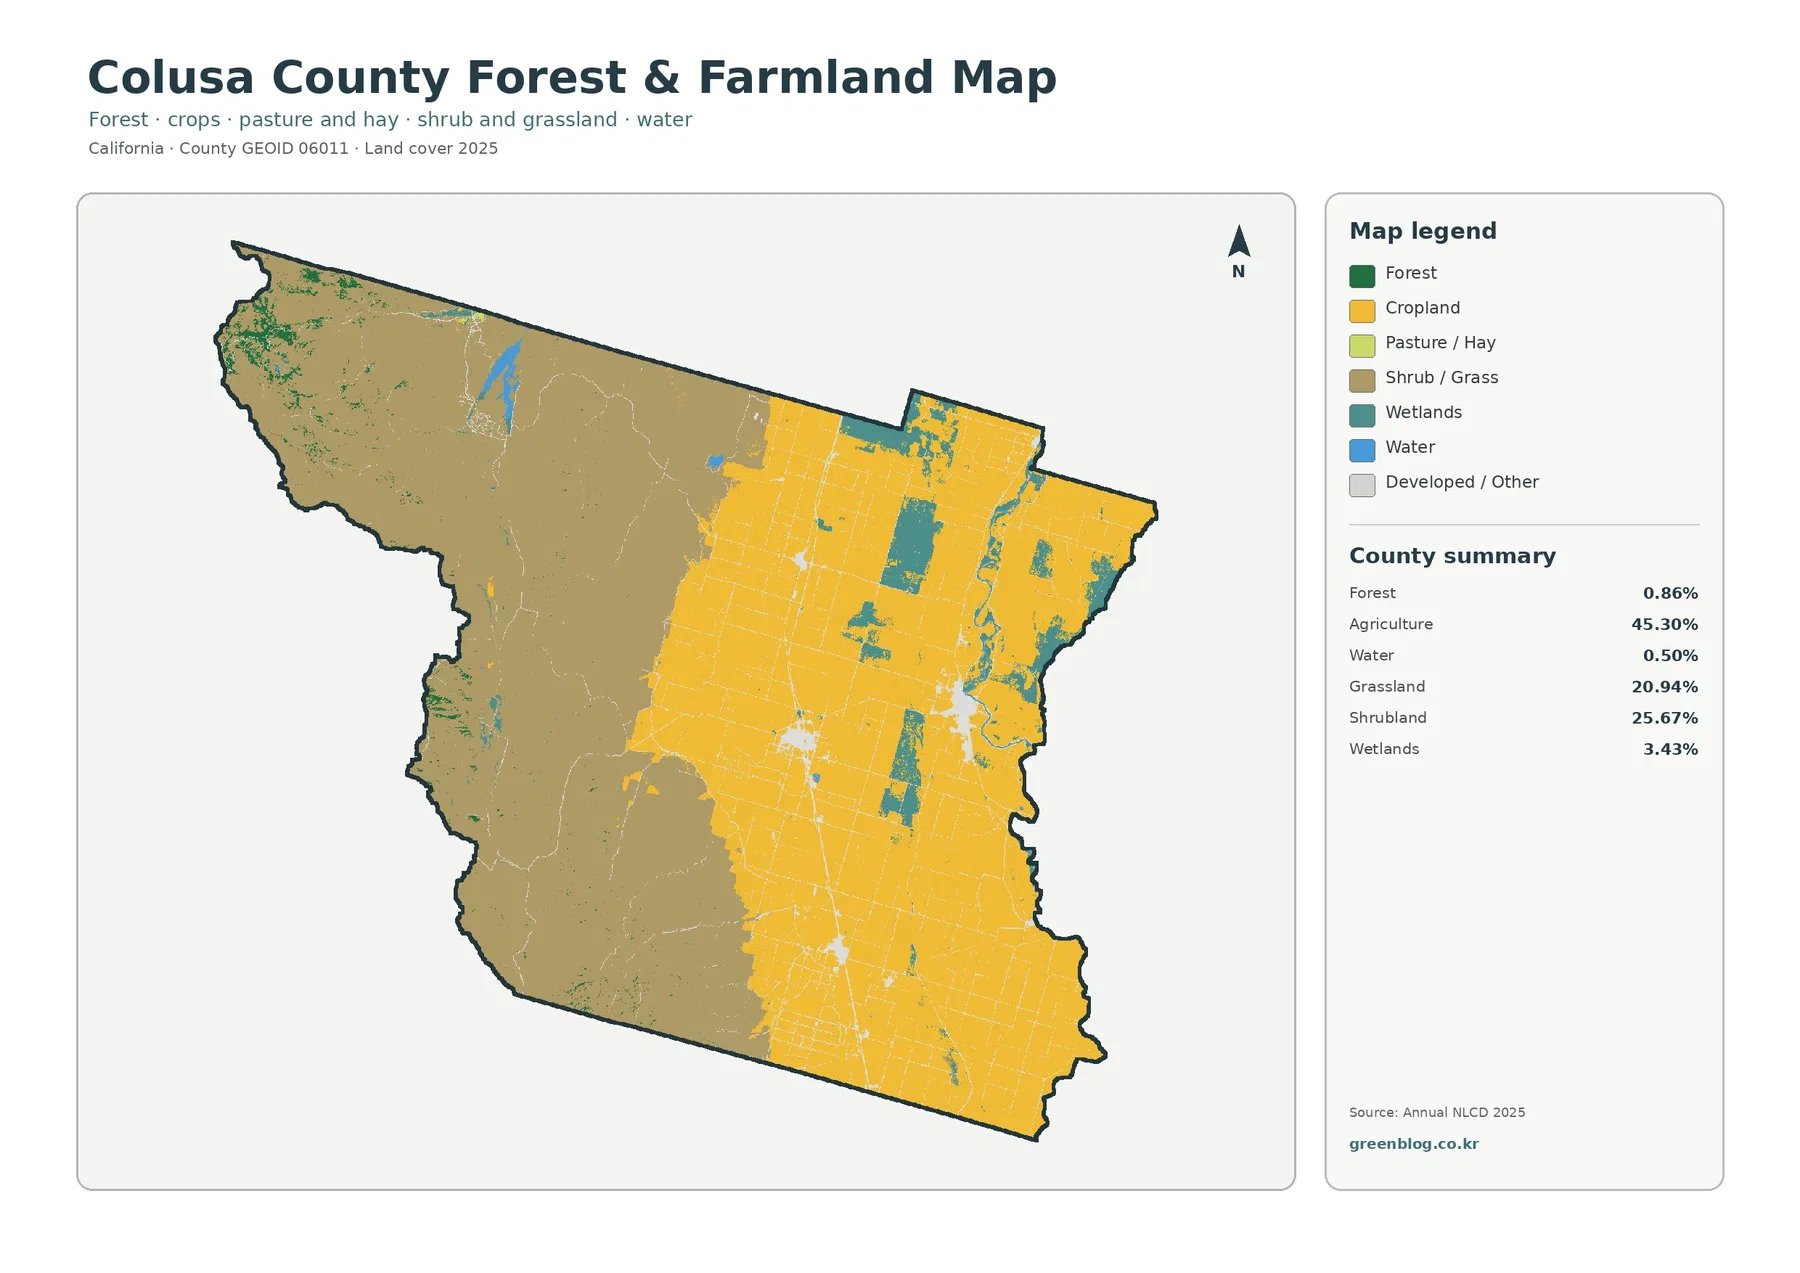
The forest-and-farmland view strips away some of the detail and makes the largest contrast easier to read. Cropland covers a broad eastern block, while shrub and grass cover expands across the west. Forest remains a minor class and appears as scattered patches rather than a continuous mountain forest. Water and wetlands remain visible, which is helpful for keeping the agricultural pattern tied to the county’s drainage and refuge landscape.
UC Cooperative Extension identifies rice, almonds, and processing tomatoes among important crops in Colusa County and describes much of the valley as good cropland. The map does not distinguish rice from orchard or row-crop fields, so it should not be used as a crop inventory. What it does show clearly is the scale of land classified as agricultural cover in 2025 and how sharply that concentration differs from the open western hills.
The transition is gradual along parts of the central county. Agricultural blocks extend westward toward the foothill edge, then become less continuous as shrub and grass cover increases. This makes the forest-and-farmland map useful for explaining the change from flat valley agriculture to rangeland-like cover without relying on parcel ownership or zoning. The categories describe what the surface looks like in the imagery, not how every acre is legally designated or economically used.
That distinction matters in the west. Land mapped as grassland or shrubland may still be used for grazing or other agricultural purposes, yet it remains grass or shrub in a land-cover classification because the physical surface is the thing being labeled. Likewise, an agricultural class does not tell you whether a parcel has an agricultural zoning designation, a conservation restriction, or a particular ownership status.
Wetland areas also complicate the idea of a single-purpose farm landscape. Several sizable wetland patches sit among the agricultural colors, and the county contains wildlife refuges where wetlands are actively managed. For education or regional comparison, this is a useful reminder that the Sacramento Valley floor in Colusa County includes cropland, wetland habitat, drainage features, towns, and roads within the same broad lowland setting.
Small towns and road corridors stand out on a very low impervious baseline
Impervious surface means pavement, rooftops, parking areas, and other hard surfaces that do not readily absorb rainfall. Colusa County has a mean impervious value of 0.95% in the 2025 summary, and only 0.49% of the county is shown at 50% or more impervious. Developed cover on the general land-cover map is higher at 3.22%, which is expected because developed land and impervious surface are related but not identical measurements.
Most of the impervious map is pale, reflecting the enormous area occupied by fields, grassland, shrubland, wetlands, and other permeable surfaces. Stronger orange and red values cluster in a few locations across the valley side of the county. Thin linear features connect some of these clusters and resemble the road network. The western uplands, by contrast, contain very little strong impervious color.
A low countywide average should not be read as a statement that every settlement has little pavement. The mean is diluted by the large agricultural and open-land area surrounding the developed centers. A town block, commercial site, or major road can have a much higher local value even when the county average remains below one percent. Reading the map location by location is therefore more informative than applying 0.95% to every place in the county.
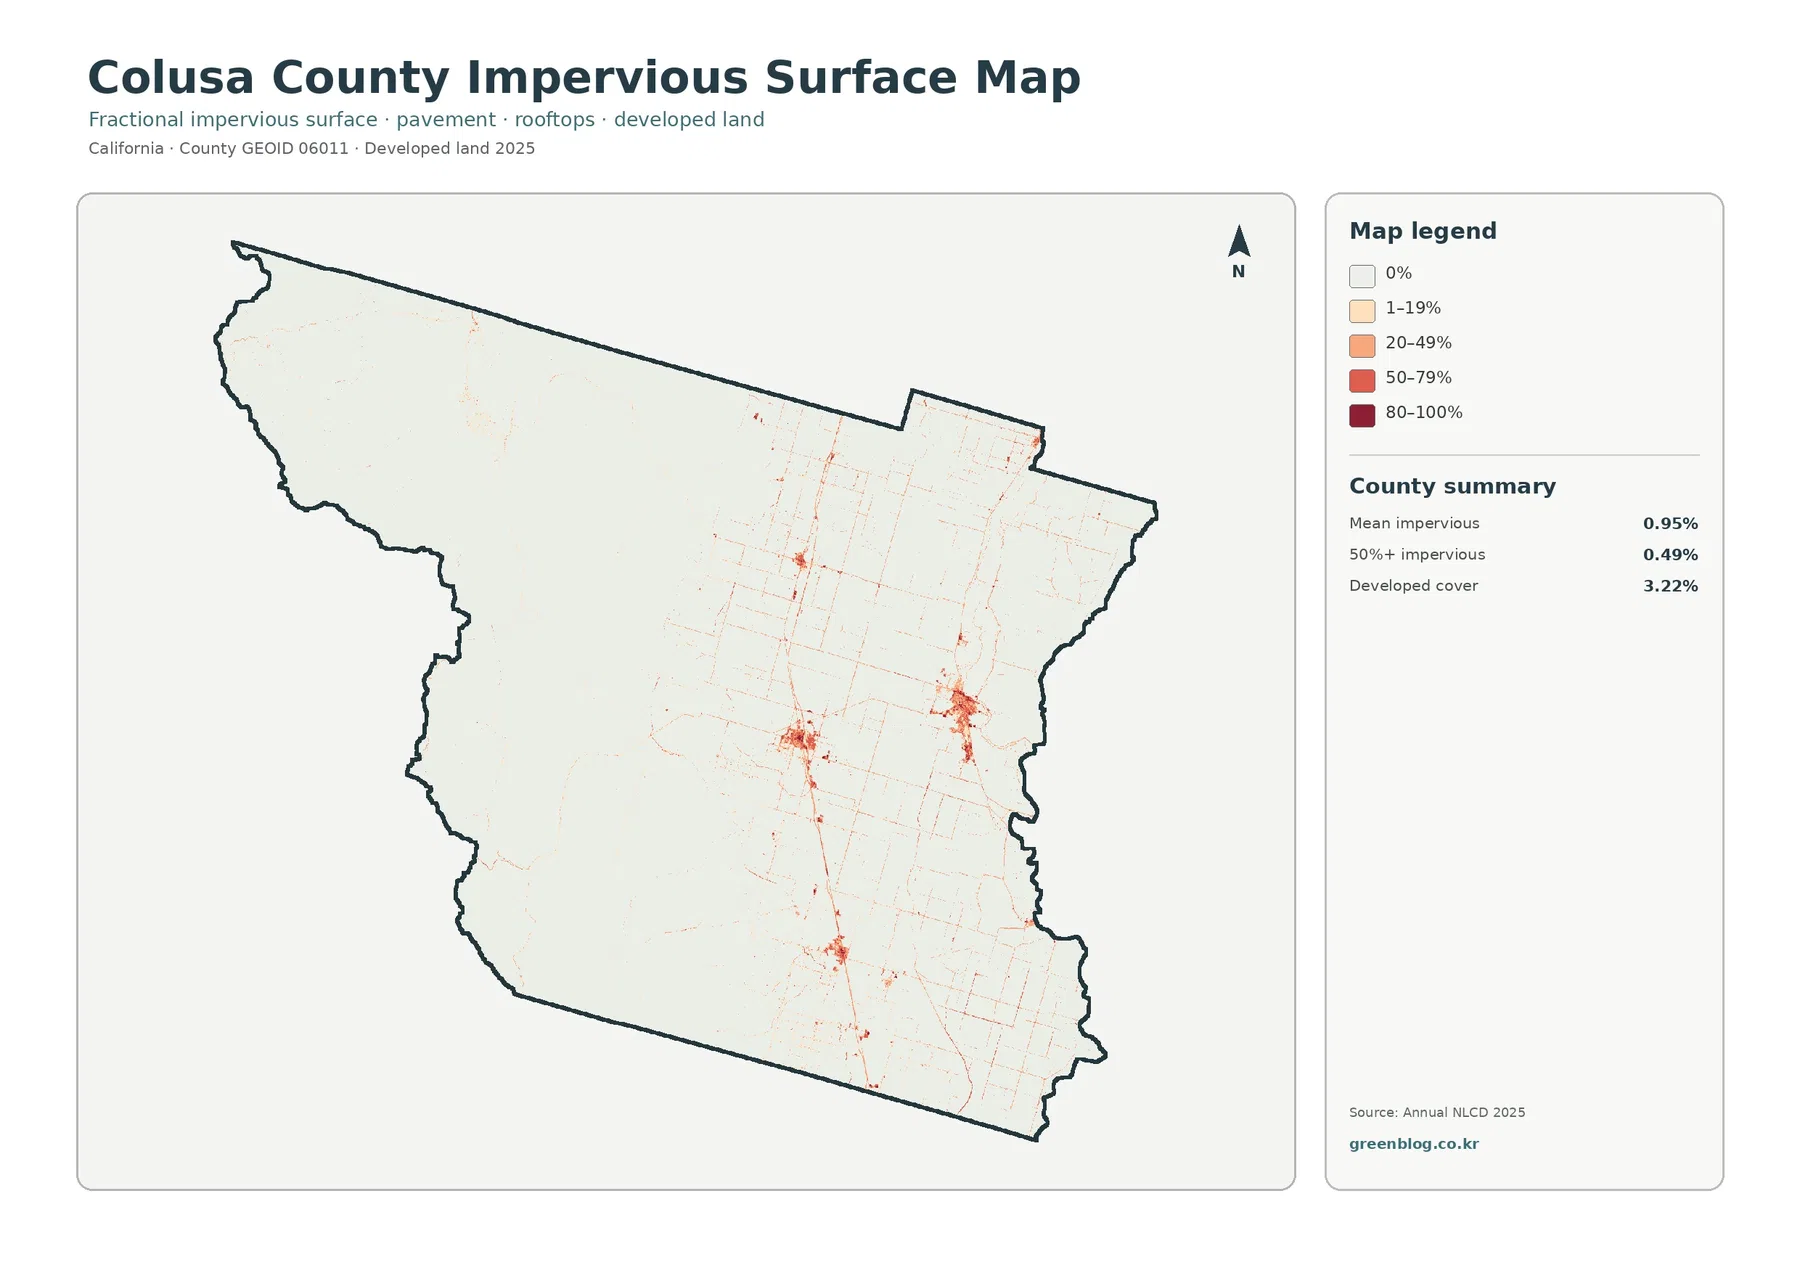
The difference between 3.22% developed cover and 0.95% mean impervious surface also helps explain low-density development. A developed land-cover cell can contain houses and roads mixed with trees, lawns, soil, or other surfaces that still absorb water. The impervious product estimates the hard-surface fraction more directly, so the entire developed cell should never be treated as pavement.
This sheet can support county-scale discussion of settlement concentration, runoff context, or the contrast between developed and agricultural areas. It cannot replace a drainage study, parcel survey, or engineering model. Runoff also depends on rainfall, soil, slope, channels, and infrastructure, none of which is fully described by an impervious percentage alone.
Wetland strips give the agricultural half more structure than the totals suggest
Wetlands cover 3.43% of Colusa County, a much smaller share than agriculture, shrubland, or grassland. On the map, however, they are visually important because they occur as distinct teal blocks and elongated shapes within the lowland agricultural zone. Their placement creates a recognizable pattern that can be followed from the general land-cover sheet to the forest-and-farmland sheet.
Colusa National Wildlife Refuge is located near the town of Colusa and consists primarily of wetlands, according to the U.S. Fish and Wildlife Service. Delevan National Wildlife Refuge, east of Maxwell, is also primarily wetland habitat. The refuge descriptions provide useful local context for interpreting why wetland cover is a meaningful county class even though it occupies only a few percent of the total area.
Water itself is only 0.50% in the county summary. Blue water cells are still useful as reference points because they remain easy to identify when moving between maps. Narrow streams, drainage channels, pond edges, and wetland-water transitions may be simplified by the 30-meter raster, so the mapped width should not be treated as a surveyed channel boundary or regulatory wetland line.
The proximity of agriculture and wetlands on the map should be described as a spatial relationship rather than a proven cause-and-effect relationship. Irrigation, drainage, basin topography, refuge management, and seasonal flooding can all matter in the real landscape. The maps establish where classes occur in the classification; they do not determine which process produced every wetland patch.
The 1985–2025 comparison marks class differences in 13.40% of the county
The change sheet compares the 1985 and 2025 classifications and reports a class difference across 13.40% of Colusa County. Within that total, 1.01% is categorized as a change to developed, 3.83% as forest loss, 0.77% as agricultural loss, and 7.33% as other class difference. Most of the county remains in the no-class-difference background, so the colored areas identify where the two snapshots disagree rather than covering the entire map.
Orange forest-loss pixels are most conspicuous in the western and northwestern portion of the county. Because forest makes up only 0.86% of the 2025 summary and the west is now dominated by shrub and grass classes, the pattern is consistent with locations that were classified as forest in the earlier data and another cover type in 2025. It does not, by itself, identify fire, logging, drought, grazing, or any other specific cause.
Purple other-difference areas form another large share of the mapped change. They appear in broad and narrow patches through the western transition zone and in scattered parts of the valley. This category combines changes that are not separated into the three headline groups, so it should be interpreted by checking the same location on the 2025 land-cover map rather than assigning one story to every purple pixel.
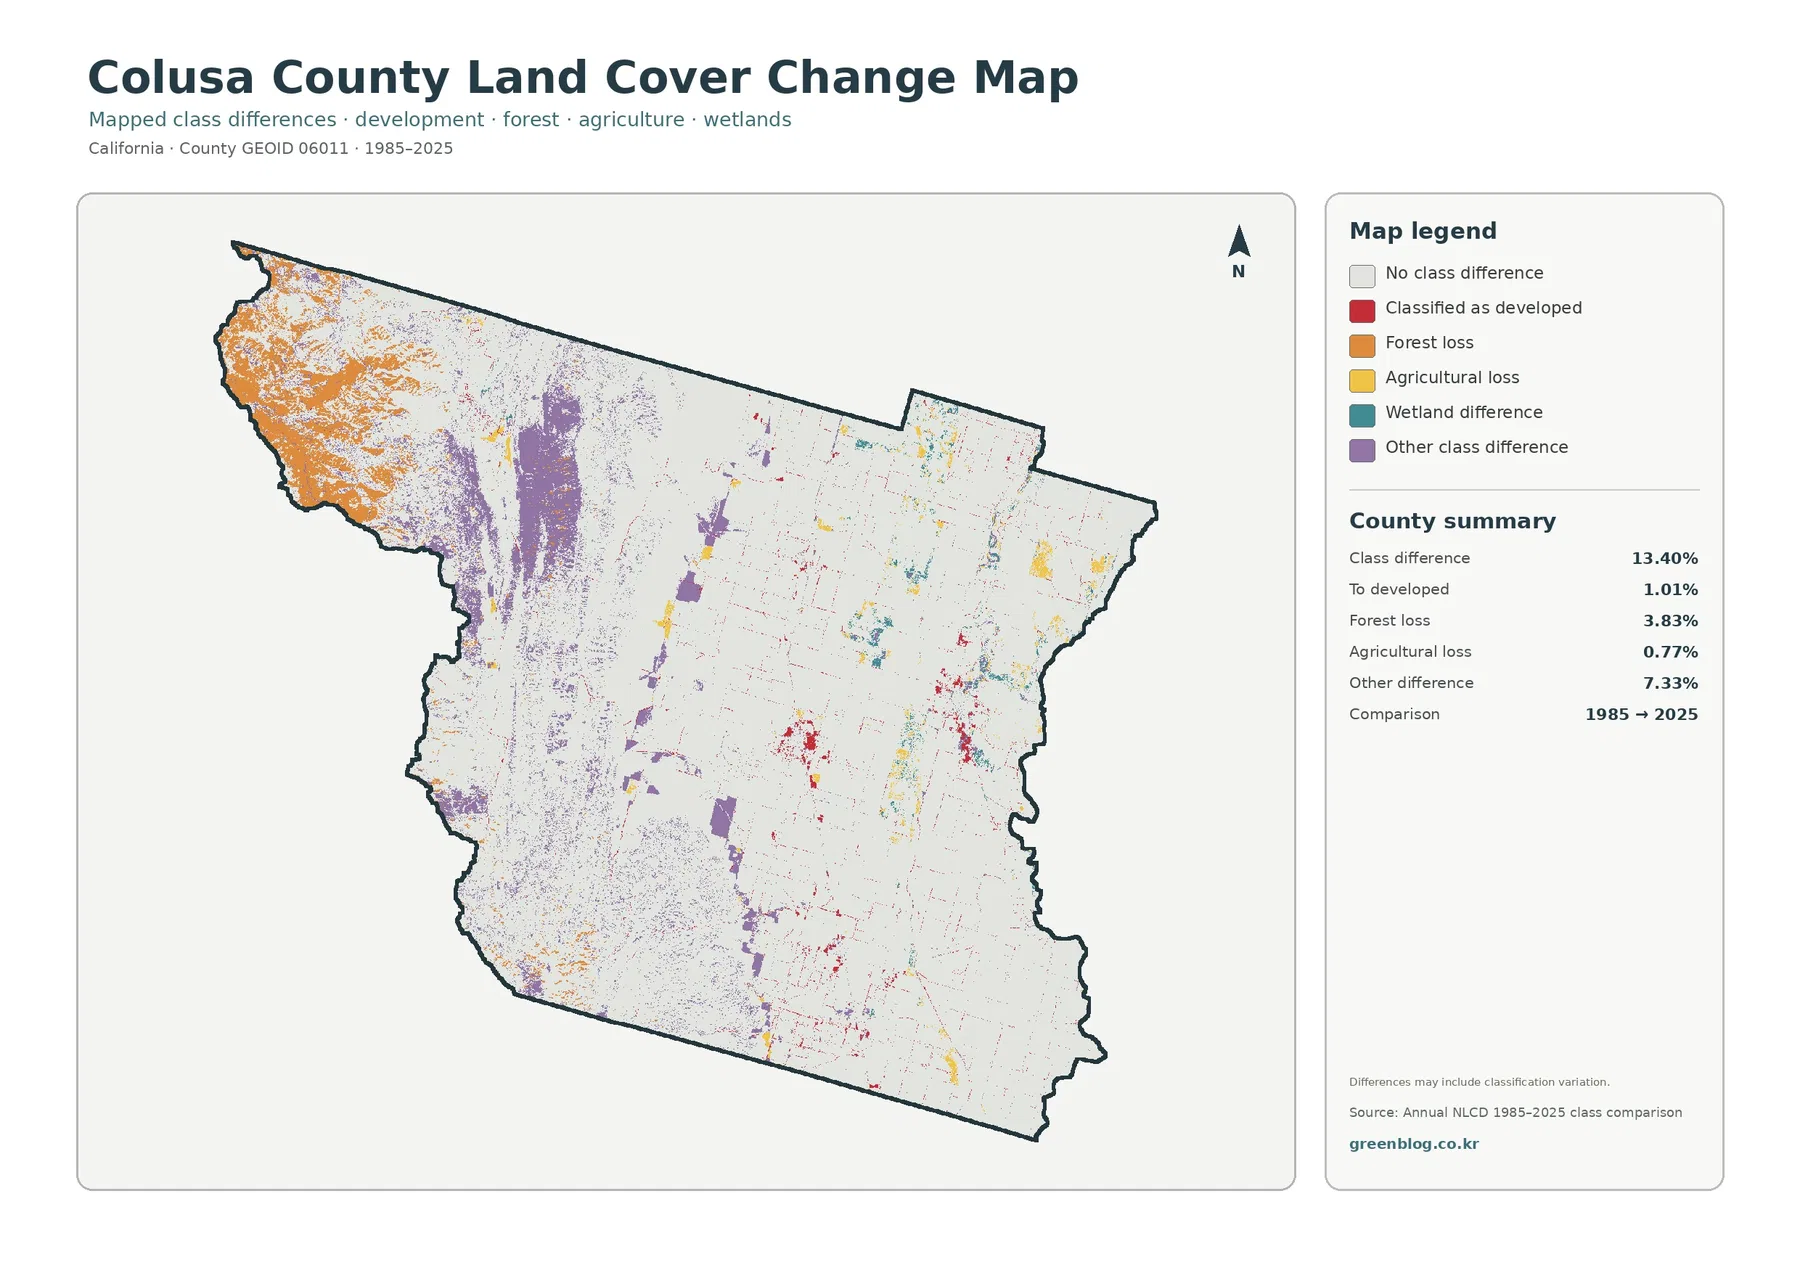
Red change-to-developed pixels are scattered in small clusters and lines across the valley side. Comparing them with the current impervious map can show whether historical classification differences occur near present-day developed centers or corridors. The comparison still cannot tell you the exact year a building was constructed or distinguish residential, commercial, and transportation projects at parcel scale.
Long time spans also introduce classification uncertainty. A 30-meter cell can contain several cover types, vegetation can look different between observation periods, and classification methods or imagery conditions can change. The map itself notes that differences may include classification variation. For that reason, 13.40% is best described as the area with a different mapped class between the two dates, not as proof that 13.40% of the county underwent permanent physical conversion.
How to use the four sheets together and download the JPG set
For a quick overview, begin with the full land-cover map and locate the broad agricultural plain, the open western uplands, wetland patches, and the developed clusters. Move next to the forest-and-farmland map when you want a cleaner comparison between cultivated cover and the shrub-and-grass west. Those two sheets establish the 2025 landscape before the more specialized maps are introduced.
Use the impervious map to separate the presence of developed land from the intensity of hard surface. Then place the 1985–2025 change map beside one of the current maps. That side-by-side approach is more informative than reading the change map alone because a colored historical difference can be tied to its current land-cover setting.
The WebP images on the page are optimized for convenient viewing, while the original JPG files are useful when you need standalone images for a presentation, classroom handout, print reference, or county comparison. The ZIP below contains all four original Colusa County JPG maps, so the complete set can be kept together for repeated use.
Scale, classification date, and what the maps do not tell you
Annual NLCD products are built for consistent regional land-cover comparison, not parcel-level surveying. The land-cover grid is generalized at 30 meters, so one cell can contain crops, a road, trees, bare soil, and water at the same time while still receiving one representative class. Boundaries between classes should therefore be read as mapped transitions, not surveyed lines with legal precision.
Land cover is also different from land use, zoning, and ownership. A grassland cell may be part of a ranch, a protected area, or another use; the grassland label only describes the surface class. An agricultural cell does not tell you the crop, zoning district, irrigation right, or ownership. Development decisions and property questions require current county planning, parcel, and regulatory records.
The current maps are labeled 2025 and the change product compares 1985 with 2025. Conditions after those observation dates may differ because of cropping changes, flooding, fire, construction, restoration, or normal vegetation cycles. When current conditions matter, pair these maps with recent aerial imagery or field information and state the map year in any presentation or report.
Within those limits, the four-sheet set is a strong county-scale reference. It captures a pattern that is unusually clear in Colusa County: a heavily cultivated valley floor on one side, open shrub and grass uplands on the other, wetland pockets within the lowlands, and only small concentrations of developed and impervious surfaces. Looking at the same location on all four maps is the best way to move from a broad description to a more careful interpretation.
Frequently Asked Questions
Where is agricultural land cover most concentrated in Colusa County?
The 2025 map shows the broadest agricultural cover across the central and eastern Sacramento Valley portion of the county. Agriculture becomes less continuous toward the western foothills, where shrubland and grassland dominate.
Why does forest cover only 0.86% when western Colusa County is mountainous?
Mountainous terrain does not automatically mean forest cover. In the 2025 classification, most of the western county is mapped as shrubland or grassland, with forest limited to small patches. Land cover describes the surface class rather than elevation alone.
Does the 13.40% change value mean that 13.40% of the county was permanently converted?
No. It means that 13.40% of the area received a different mapped land-cover class in the 1985 and 2025 comparison. Real change can be part of that result, but mixed pixels, imagery differences, and classification variation can also contribute.
Map File Information
The ZIP contains four original JPG maps for Colusa County: 2025 land cover, forest and farmland, impervious surface and developed land, and 1985–2025 land cover change. They are suitable for printing, classroom reference, presentations, and county-scale comparisons.
- Included Files: Use only the versions confirmed in the article and supplied images
- File Type: Use the confirmed download contents
- Intended Use: Printing, education, presentations, and map-based projects
Related Maps
- Alameda County California Land Cover Map
- Alpine County California Land Cover Map
- Amador County California Land Cover Map
Sources and further reading
Land-cover and impervious-surface classes can be reviewed through the MRLC Annual NLCD Data portal and the USGS Annual NLCD Land Cover Classification documentation. County boundaries and geographic identifiers are available from the U.S. Census Bureau TIGER/Line Shapefiles.
For local context, the UC Cooperative Extension Colusa County page describes the county’s Sacramento Valley cropland, western Coastal Mountain Range, and major agricultural activity. The U.S. Fish and Wildlife Service pages for Colusa National Wildlife Refuge and Delevan National Wildlife Refuge provide wetland and refuge context. These land-management descriptions should remain separate from the NLCD land-cover classes.
Green Map creates custom-edited map images using open geographic data sources such as geoBoundaries, Natural Earth, OpenStreetMap, and government open data.
These maps are edited visual materials, not raw data files, and are provided for education, documents, presentations, and graphic reference.