Fulton County stretches through the heart of metropolitan Atlanta in an unusually long shape, widening around the northern suburbs, narrowing near Sandy Springs, expanding through Atlanta, and then extending southwest toward South Fulton, Fairburn, Palmetto, and Chattahoochee Hills. The maps on this page are designed to make that shape easier to understand by separating settlement and road context from water and terrain. They show Atlanta and the northern cities, the ranked distribution of six major cities, named streams and lakes, and an elevation range of roughly 151 to 391 meters. After reviewing the previews, you can download four high-resolution A3 JPG maps in a single ZIP for printing, classroom work, presentations, or local research.
Atlanta is the simplest anchor for reading the county. North of the city, Sandy Springs leads into a broad cluster containing Roswell, Alpharetta, Johns Creek, and Milton. South of Atlanta, East Point and College Park appear close to the urban core, while South Fulton occupies a much larger area farther southwest. Union City, Fairburn, Palmetto, and Chattahoochee Hills continue toward the county’s southern end. The city map strips that long list down to six major places, while the water and elevation views reveal the creek valleys and rolling ground that the road-focused map cannot show clearly.
Table of Contents
A Long County from Milton to Chattahoochee Hills
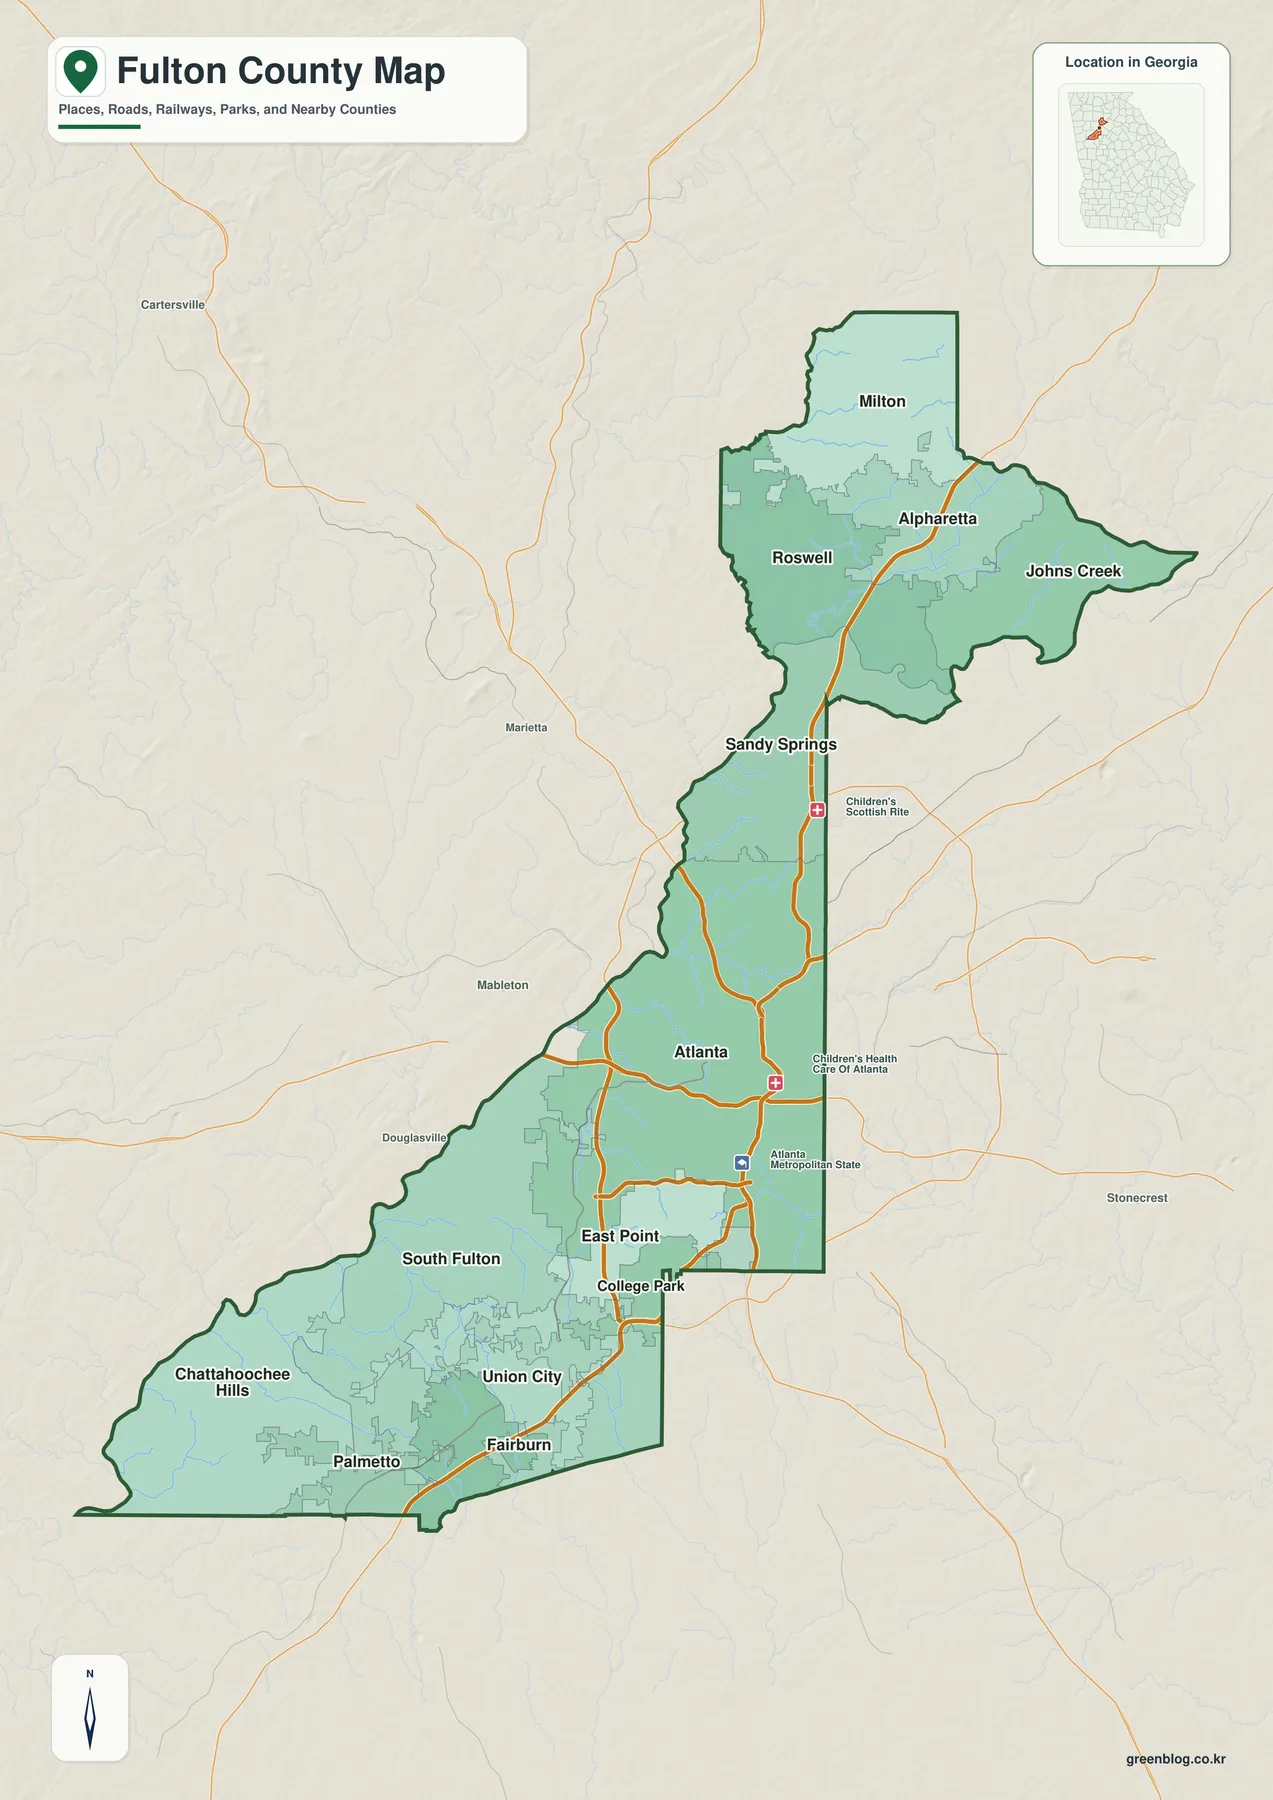
The general county map makes Fulton County’s shape the first major geographic lesson. Milton occupies the broad northern end, with Alpharetta, Roswell, and Johns Creek filling much of the area below it. The boundary narrows near Sandy Springs before opening into Atlanta. South of the central city, the county continues through East Point and College Park and then widens again across South Fulton. Union City, Fairburn, Palmetto, and Chattahoochee Hills carry the map much farther southwest. Seeing those places inside one boundary explains why a simple phrase such as “Atlanta’s county” does not capture the full north-to-south extent.
Major roads are emphasized in orange and are densest around Atlanta. Several continue north through Sandy Springs toward the Roswell–Alpharetta area, while others extend south through East Point and College Park toward Union City and Fairburn. The purpose of the map is not to provide exit numbers or local street navigation. Instead, the road pattern shows how the major urban centers connect across a county whose shape forces many trips to follow the same broad north-south direction before branching east or west.
A few institutional labels provide extra orientation. Children’s healthcare sites are marked around the Atlanta–Sandy Springs corridor, and Atlanta Metropolitan State is labeled south of central Atlanta. These labels are not intended as a complete facility directory; they simply help place the urban core within the larger county. Farther south, the map becomes less crowded with landmark labels and more open around South Fulton, Fairburn, Palmetto, and Chattahoochee Hills, reinforcing the visual difference between the dense center and the broader southern section.
Six Major Cities on the Ranked Distribution Map
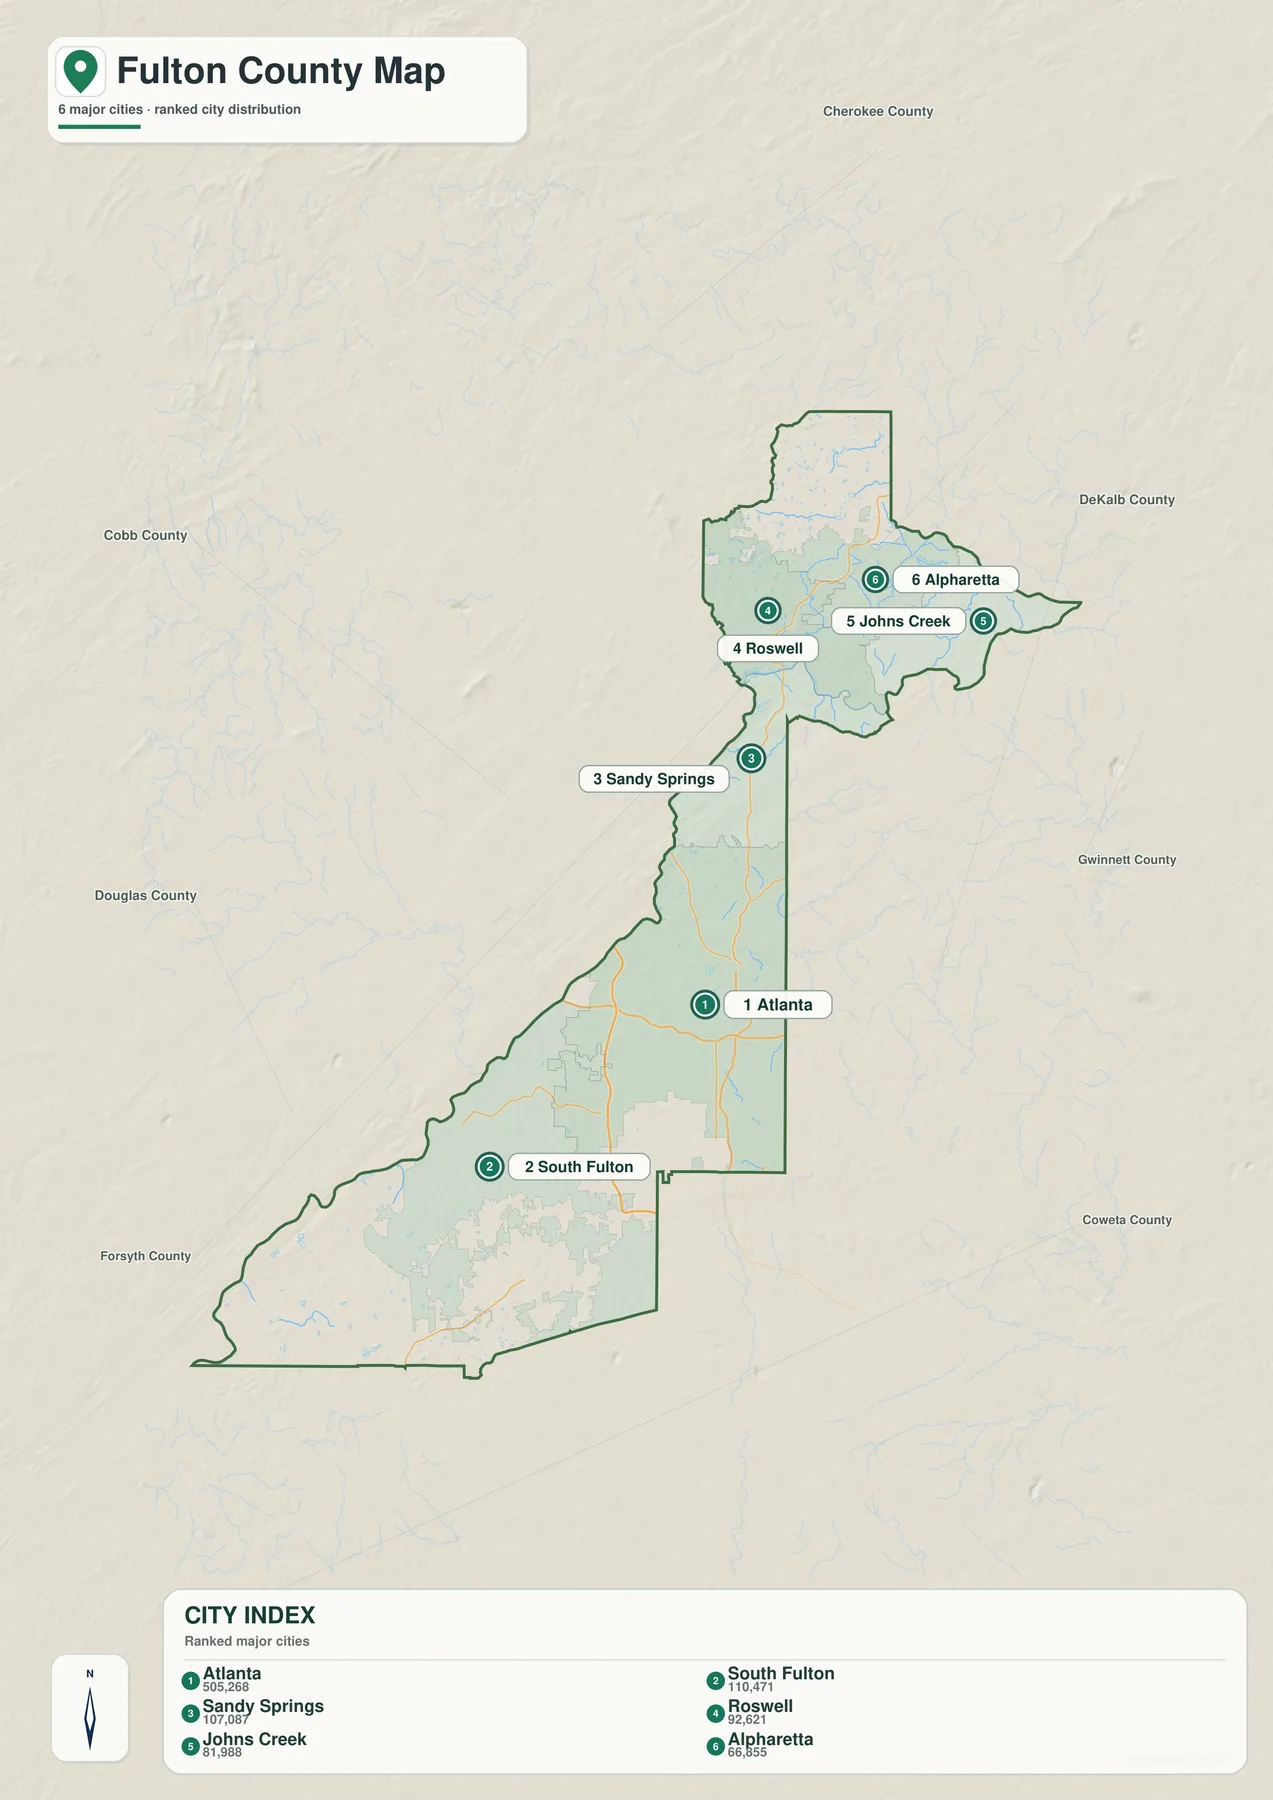
The city map removes most road and landmark detail and highlights six places: Atlanta, South Fulton, Sandy Springs, Roswell, Johns Creek, and Alpharetta. Its CITY INDEX displays Atlanta at 505,268, South Fulton at 110,471, Sandy Springs at 107,087, Roswell at 92,621, Johns Creek at 81,988, and Alpharetta at 66,855. These are the values printed on the supplied map and are reproduced here to explain its ranking. They should not be treated as newly verified population estimates; readers who need current official figures can use the Census source listed below.
The geographic arrangement is more useful than the ranking alone. Atlanta sits well south of the county’s midpoint. South Fulton occupies the large southwestern section below Atlanta, while Sandy Springs marks the narrow connection between the central city and the broad northern group. Roswell, Alpharetta, and Johns Creek are clustered across the north, with Milton visible on the general map farther above them. This pattern makes Fulton County look less like one compact metropolitan block and more like several large urban areas linked along an elongated boundary.
Several important place names are absent from the six-city ranking even though they appear on the county map. East Point, College Park, Union City, Fairburn, Palmetto, and Chattahoochee Hills are useful examples. The city view is therefore best used for a quick comparison of the largest labeled cities rather than as a complete municipal inventory. When the southern communities or the full county extent matter, the general map provides the better reference.
| Map rank | City | Displayed value | General position |
|---|---|---|---|
| 1 | Atlanta | 505,268 | central-southern urban core |
| 2 | South Fulton | 110,471 | broad southwest section |
| 3 | Sandy Springs | 107,087 | narrow connection north of Atlanta |
| 4 | Roswell | 92,621 | northwestern urban cluster |
| 5 | Johns Creek | 81,988 | northeastern side |
| 6 | Alpharetta | 66,855 | north-central urban cluster |
South River, Utoy Creek, Camp Creek, and Named Lakes
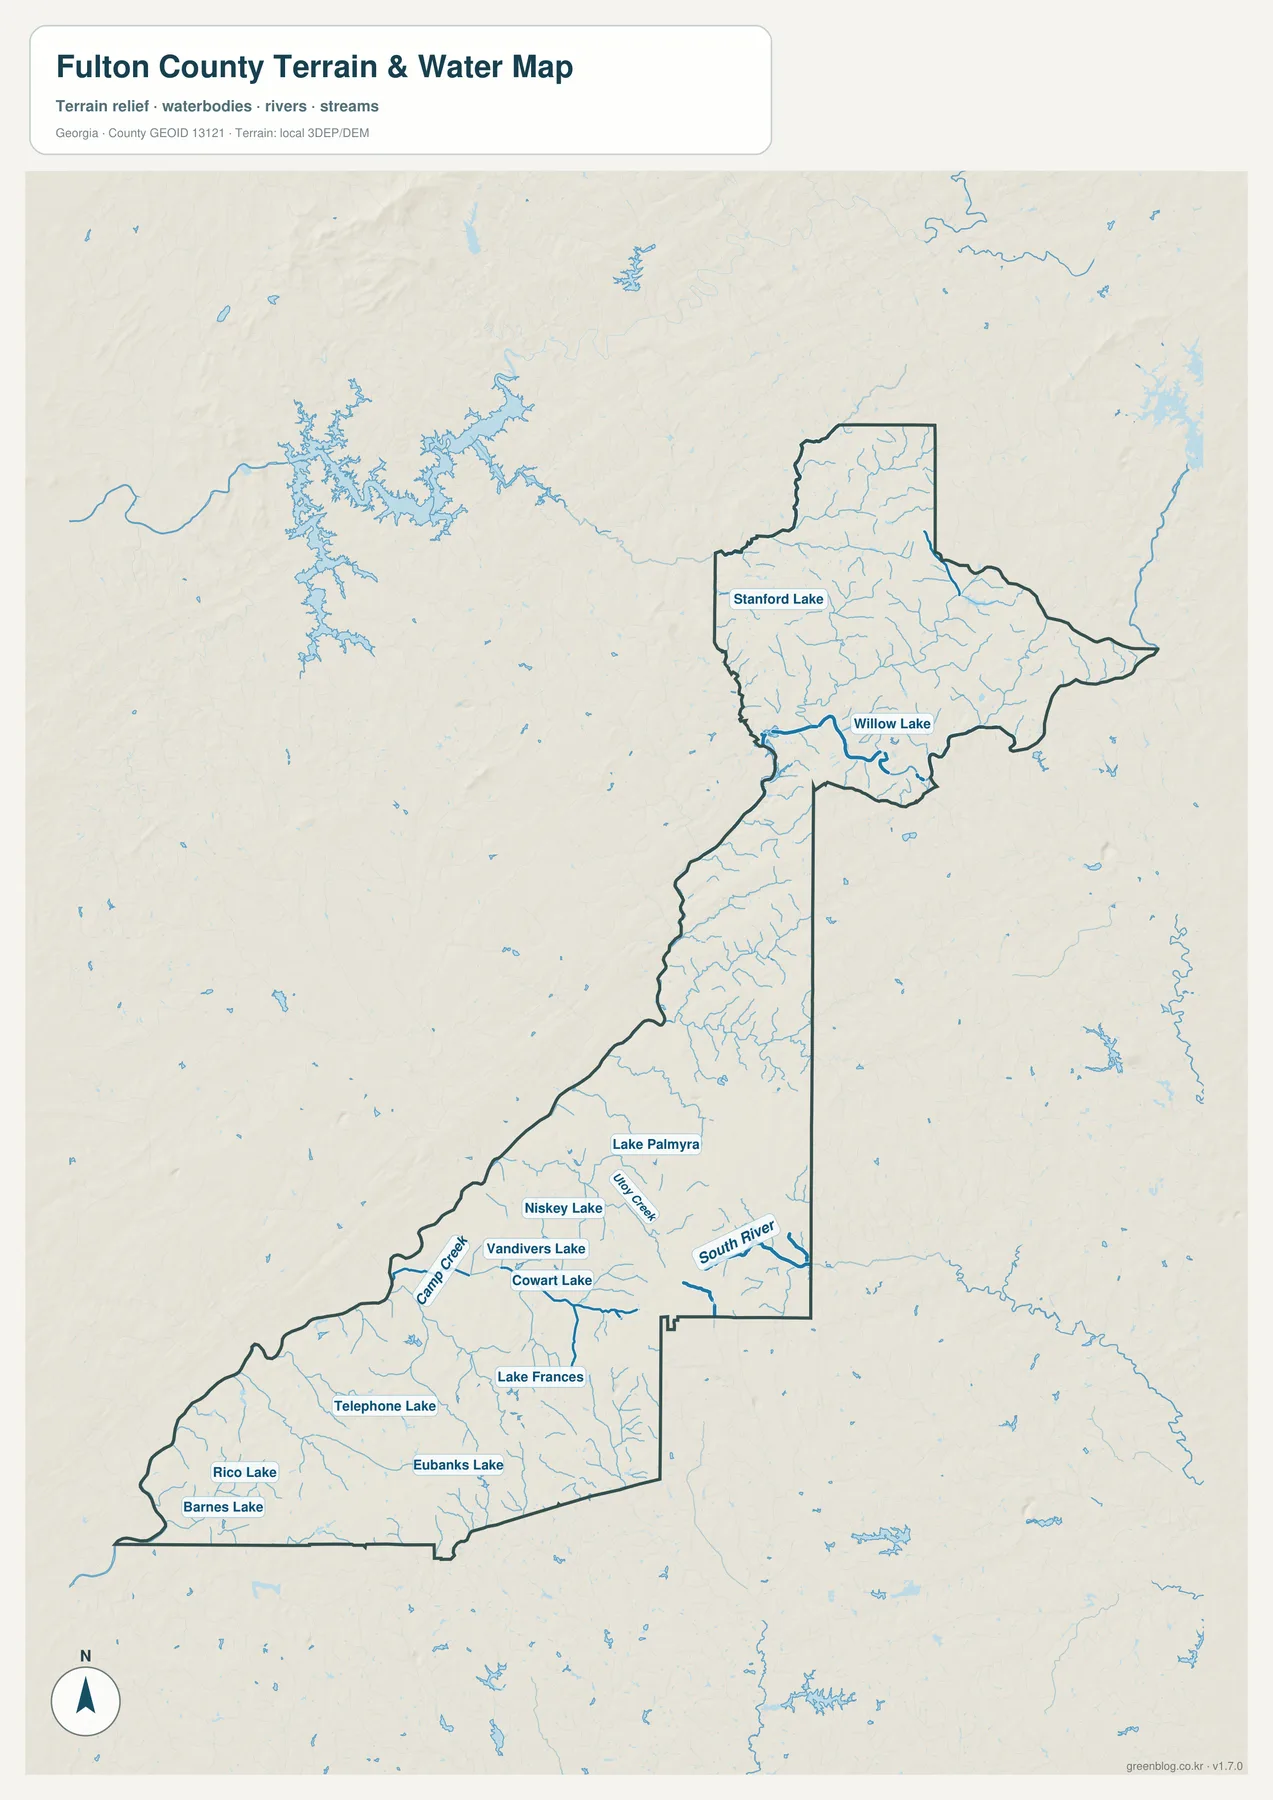
The water map changes the way the southern half of the county reads. South River is labeled near the southeastern side below Atlanta, Utoy Creek runs through the south-central portion, and Camp Creek provides another named reference farther west. Numerous smaller tributaries branch around those streams and through South Fulton. On the general map, roads and community names dominate this area; the water view shows that the same landscape is divided by many small drainage valleys.
Named lakes appear from north to south. Stanford Lake and Willow Lake are labeled in the northern section. Closer to the Atlanta–South Fulton area are Lake Palmyra and Niskey Lake, with Vandivers Lake and Cowart Lake nearby. Farther southwest, the map identifies Lake Frances, Telephone Lake, Eubanks Lake, Rico Lake, and Barnes Lake. The names are useful geographic reference points on the supplied map, not a claim that the water bodies are equal in size, access, or use.
The contrast between the northern and southern water patterns is helpful. The northern cities sit among rolling terrain with smaller streams and a few named lakes, while the large South Fulton section contains a dense web of tributaries and multiple labeled lakes. South River, Utoy Creek, and Camp Creek give the southern map clearer named anchors. When these water features are compared with the elevation map, many of their corridors correspond with lower green terrain between higher ridges.
This view is intended for county-scale orientation rather than flood-insurance decisions, property boundaries, stream depth, or legal water access. Those questions require specialized current sources. For ordinary map reading, however, the water map is useful for locating named streams, understanding why the southern landscape is broken into many valleys, and comparing the creek network with the urban pattern shown on the other maps.
Elevation from About 151 to 391 Meters
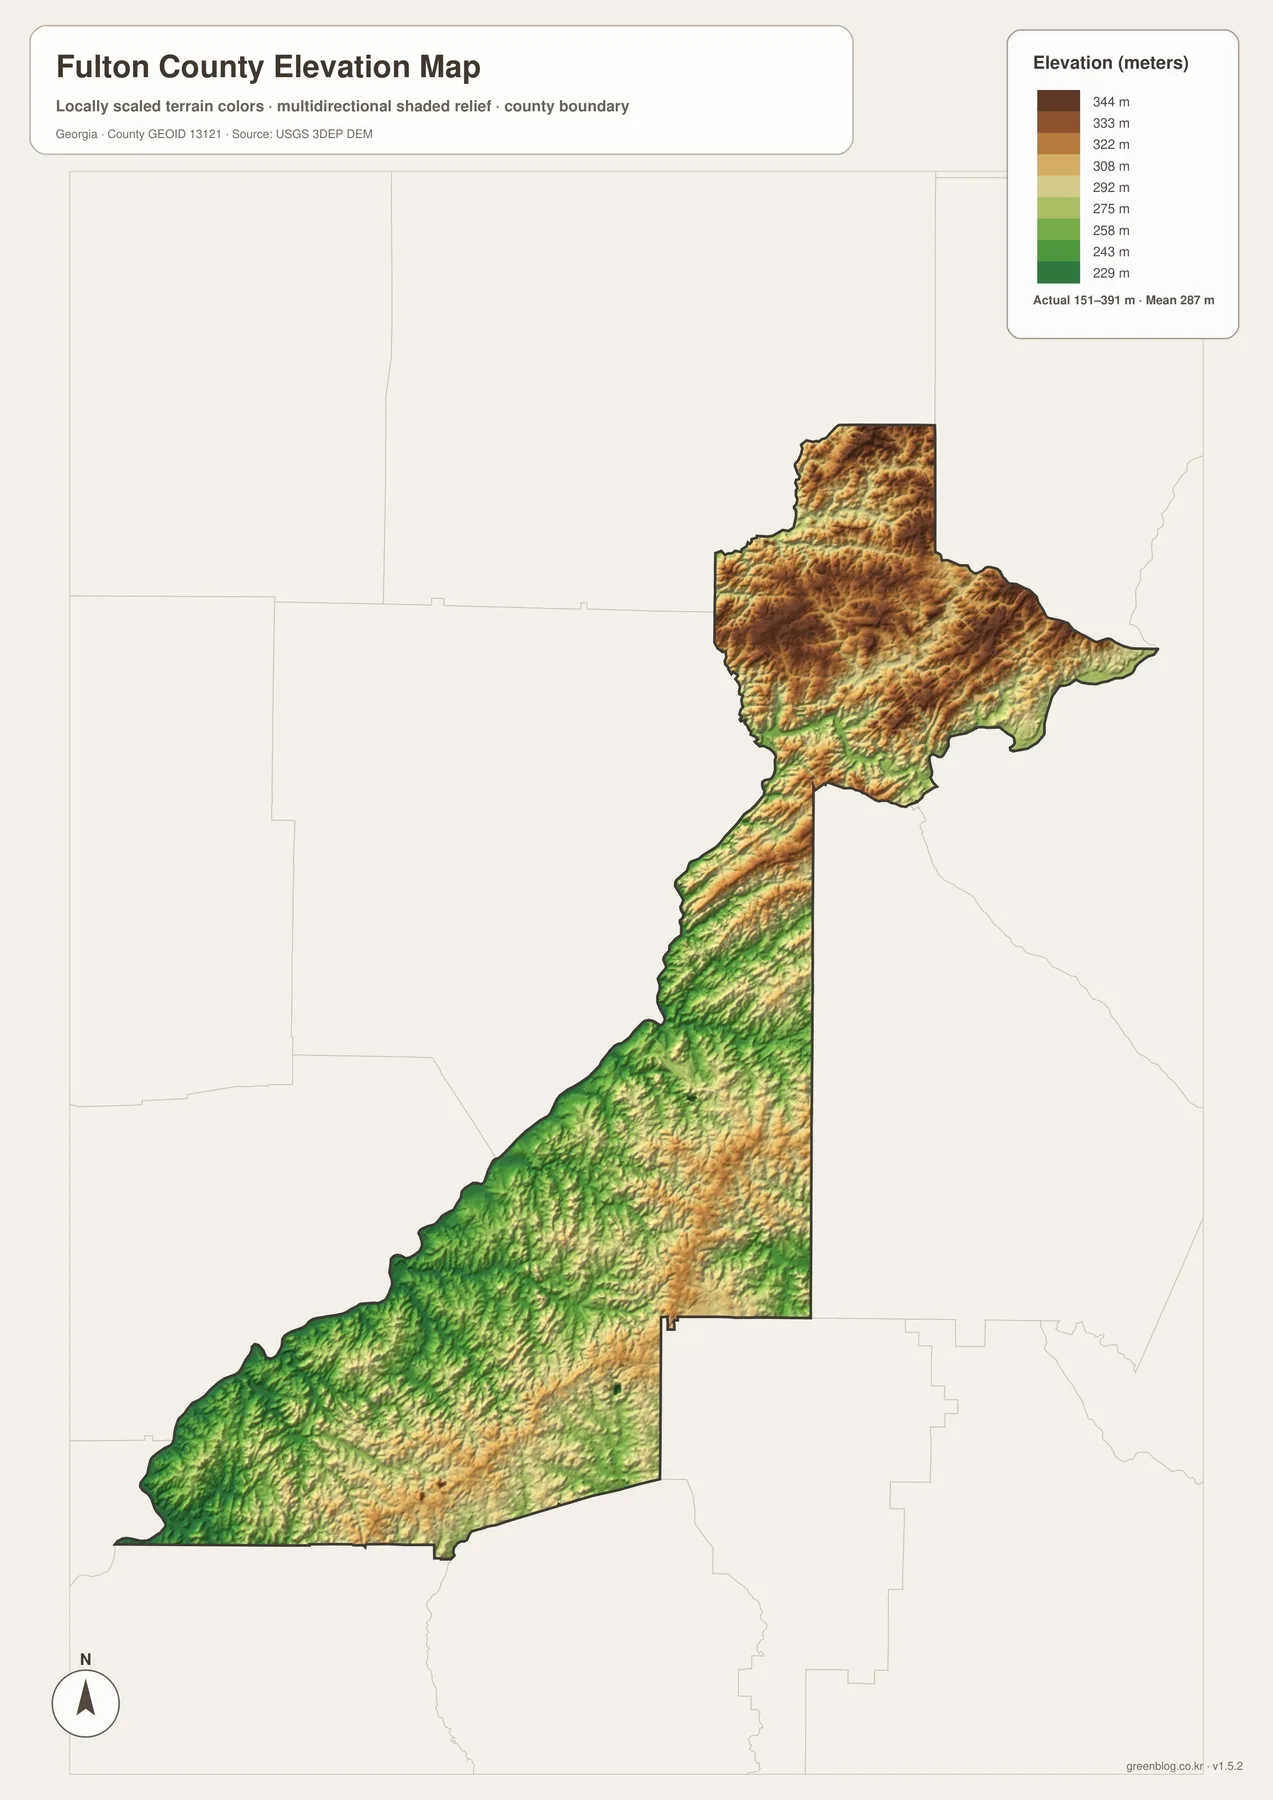
The elevation legend reports an actual range of roughly 151 to 391 meters, with a mean of 287 meters. The broad northern section is dominated by tan and brown relief, indicating generally higher rolling ground around Milton, Alpharetta, Roswell, and Johns Creek. Narrow green valleys cut through those hills, so the north is not one uniform plateau. Moving toward Sandy Springs and Atlanta, lower terrain becomes more common, and the long southern half contains broader green areas.
The southwest is lower overall than the northern end, but it is not flat. Long tan ridges run diagonally through South Fulton and toward Chattahoochee Hills, separated by darker green valleys. Those valleys match the dense stream network visible on the water map. The result is a rolling landscape in which low drainage corridors are interrupted by repeated higher ridges rather than a simple downhill slope from north to south.
The city pattern gains useful context from this terrain. Sandy Springs, Roswell, Alpharetta, and Johns Creek occupy a generally higher northern landscape. Atlanta sits closer to the transition into lower ground, and the large South Fulton section contains broader low valleys along with several elevated ridges. That does not mean every northern neighborhood is higher than every southern one; the map instead shows a county-wide tendency with many local variations.
The color bands and hillshade are intended for broad comparison, not for surveying a building site, engineering a road, or designing drainage. Exact site elevation requires more detailed data and, where appropriate, field measurement. For a classroom, county profile, or presentation, the 151–391 meter range provides a clear way to explain why the north looks more strongly ridged and why so many southern streams occupy lower valleys.
Connecting the Northern Suburbs, Atlanta, and South Fulton
Fulton County is easier to understand when the map views are read together. The general map establishes the county’s long boundary and the sequence from Milton through Atlanta to Chattahoochee Hills. The city map then emphasizes where the six largest labeled cities sit within that shape. The water view shifts attention to South River, Utoy Creek, Camp Creek, and the many small lakes in the southern section, while the elevation map explains why those waterways follow lower valleys between ridges.
For a simple county-location slide, the general map is the clearest choice because it includes the widest range of place names. The city map is cleaner when the question is how Atlanta, South Fulton, Sandy Springs, Roswell, Johns Creek, and Alpharetta compare spatially. A project about local waterways benefits from the water map, and a discussion of rolling terrain is better served by the elevation view. Because all four use the same county boundary, they can also be placed side by side without forcing every label into a single crowded image.
The supplied source article identifies Atlanta as the county seat and states that Fulton County was established in 1853. It also describes the county through state government, corporate headquarters, transit, universities, the airport, and dense urban development. The new map set adds a physical-geography layer to that urban description. It shows that the county extends far beyond central Atlanta and includes high northern hills, a long southern section, many creek valleys, and a very uneven distribution of major cities.
When a larger image is needed for printing or presentation work, the downloadable ZIP is more useful than enlarging the webpage previews. The files keep roads and cities, ranked settlements, water, and elevation in separate views so each remains readable. This makes it easier to choose a map that matches the question rather than relying on one overloaded county graphic.
Frequently Asked Questions
Which cities are emphasized on the ranked city map?
The city map highlights Atlanta, South Fulton, Sandy Springs, Roswell, Johns Creek, and Alpharetta. The general county map adds other place names including Milton, East Point, College Park, Union City, Fairburn, Palmetto, and Chattahoochee Hills.
Which named waterways are easiest to find?
South River, Utoy Creek, and Camp Creek are the clearest named stream references in the supplied water map. Stanford Lake, Willow Lake, Lake Palmyra, Niskey Lake, Vandivers Lake, Cowart Lake, and several smaller southern lakes are also labeled.
What elevation range is shown for Fulton County?
The elevation map states an actual range of about 151 to 391 meters and a mean of 287 meters. The northern section is generally higher, while the southern half contains broader low valleys along with several long higher ridges.
What is included in the downloadable ZIP?
The archive contains four high-resolution A3 JPG files: a general Fulton County map, a ranked city map, a water map, and an elevation map. Each file emphasizes a different part of the same county boundary.
Map File Information
Fulton County A3 Map Files
- Included Files: General Fulton County map, ranked city map, water map, and elevation map
- File Type: Four high-resolution A3 JPG files in one ZIP archive
- Intended Use: Printing, education, presentations, and map-based projects
Related Maps
Sources and Reference Material
- Fulton County official profile – county background and local information
- U.S. Census Bureau QuickFacts: Fulton County – current official statistics
- New Georgia Encyclopedia: Fulton County – county history and regional background
- U.S. Census Bureau TIGER/Line Shapefiles – county boundary and geographic reference data
- USGS National Hydrography – river, stream, and water-feature data
- USGS 3D Elevation Program – elevation data
Green Map creates custom-edited map images using open geographic data sources such as geoBoundaries, Natural Earth, OpenStreetMap, and government open data. These maps are edited visual materials, not raw data files, and are provided for education, documents, presentations, and graphic reference.