Nevada County in southwestern Arkansas has a mixed landscape rather than one uninterrupted land-cover type. Forest is the largest 2025 class at 52.21%, but wetlands account for 16.06% and agriculture for 13.39%. Shrubland and grassland add more open ground, while the strongest developed footprint is concentrated around Prescott. The four maps on this page separate those patterns so they are easier to compare.
The original JPG versions of all four maps are available together in the download section below. Use the general map for a countywide overview, the forest-and-farmland view for open-land contrasts, the impervious map for built surfaces, and the 1985–2025 comparison when the question involves mapped change.
Table of Contents
A 2025 landscape divided among forest, wetlands, and open land
Forest gives Nevada County its dominant color, but it does not form a single solid block. The southern and eastern portions contain broad wooded areas, while the northwest has much larger openings of agricultural and grass-covered land. Teal wetland areas interrupt the forest across the middle and east, creating a patchwork that is noticeably different from a county where one cover class occupies most of the map.
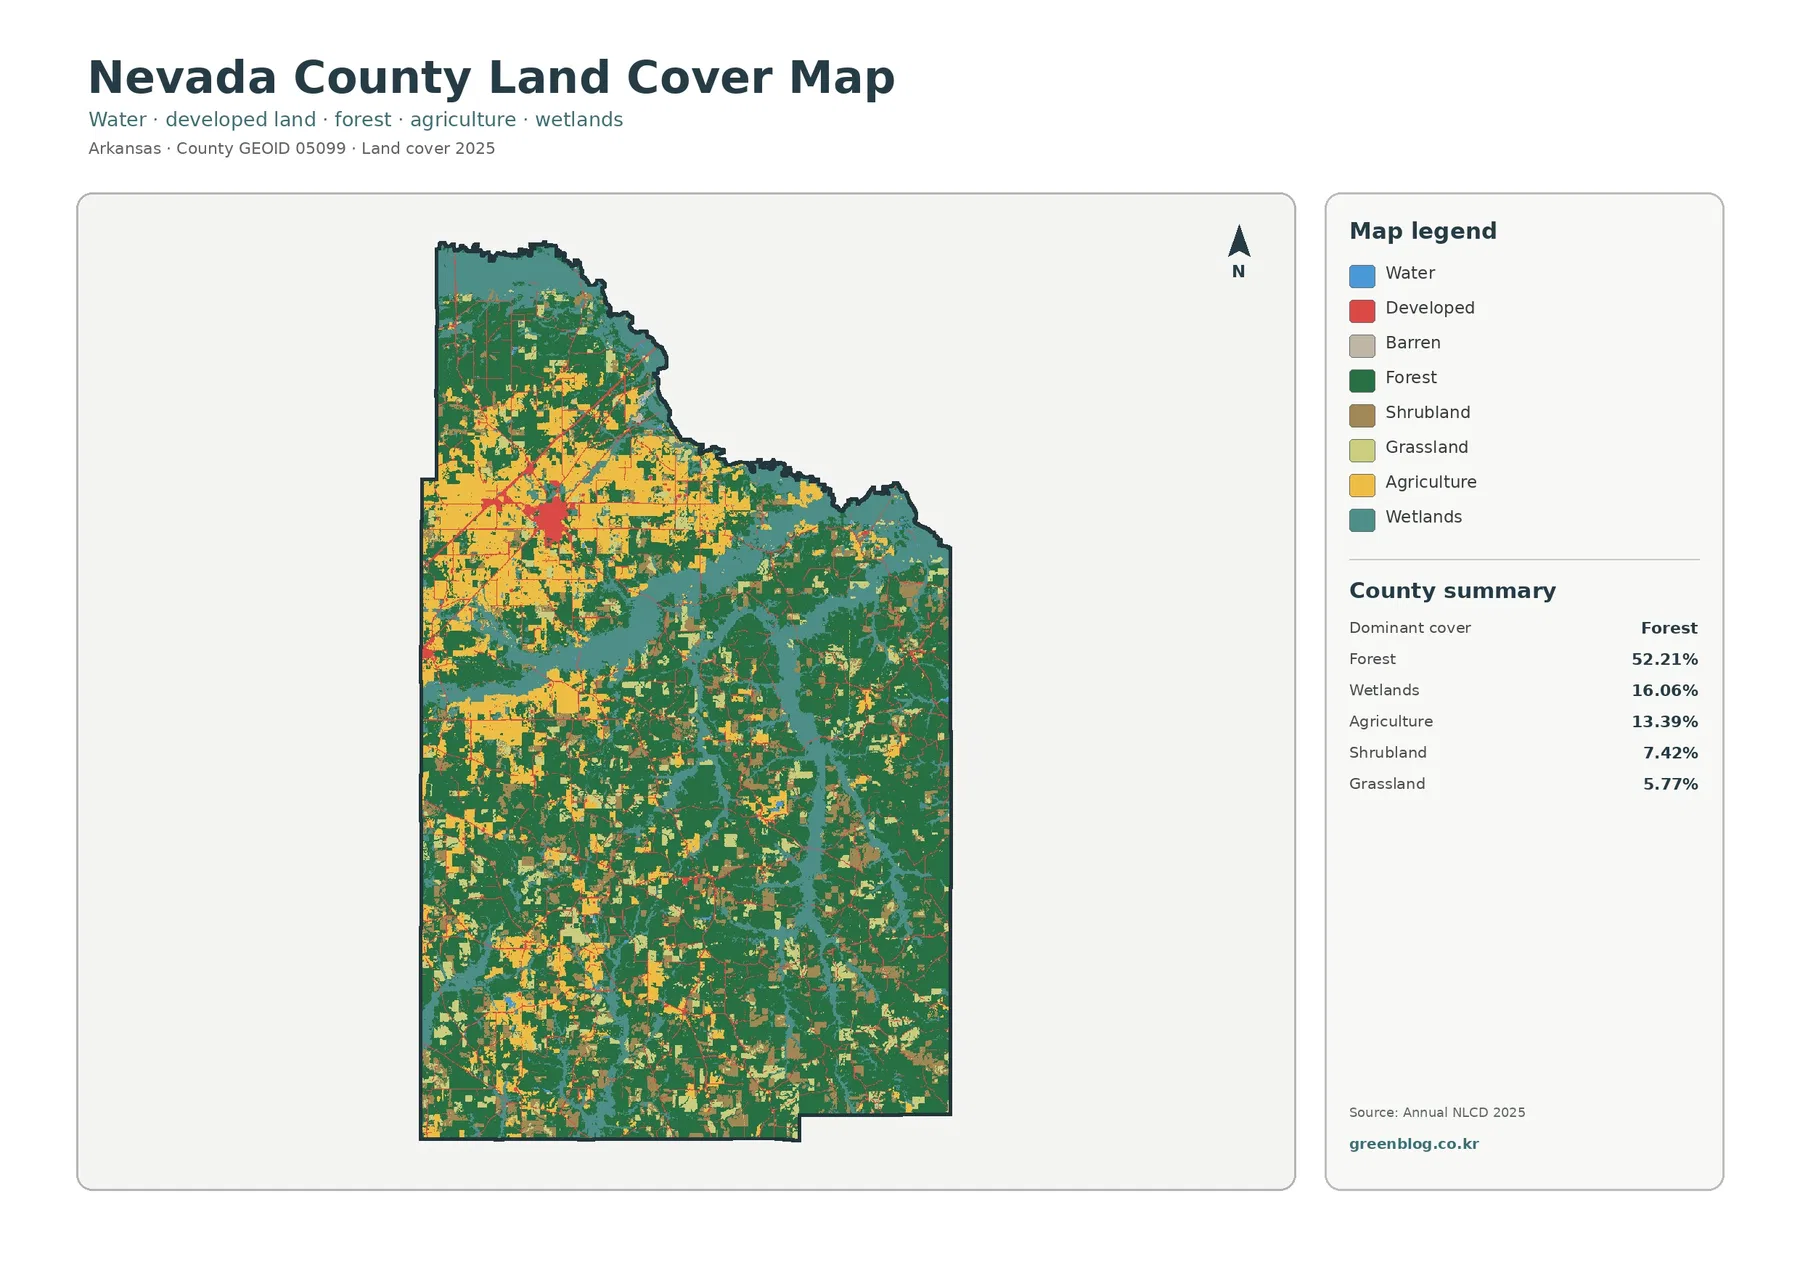
The county summary helps put the colors in proportion. Forest covers 52.21%, wetlands 16.06%, agriculture 13.39%, shrubland 7.42%, and grassland 5.77%. Water itself accounts for only 0.33%, so the substantial wetland share should not be confused with open lakes or ponds. Developed cover is a relatively small part of the county and becomes easier to understand on the separate impervious-surface map.
The legend is also a reminder that land cover describes the surface, not a property’s legal use. A pixel classified as agriculture, forest, or developed land does not identify ownership, zoning, parcel boundaries, building rights, or conservation restrictions. Those questions require parcel records, surveys, and the appropriate local or state documents.
Prescott stands out when pavement and rooftops are isolated
The impervious-surface view strips away much of the visual detail in the general map and highlights surfaces such as pavement, parking areas, and rooftops. Nevada County has a mean impervious value of 0.83%, while only 0.19% of the county is mapped at 50% or greater imperviousness. Developed cover is listed at 4.70%, a useful contrast because land can be classified as developed without being mostly pavement or buildings.
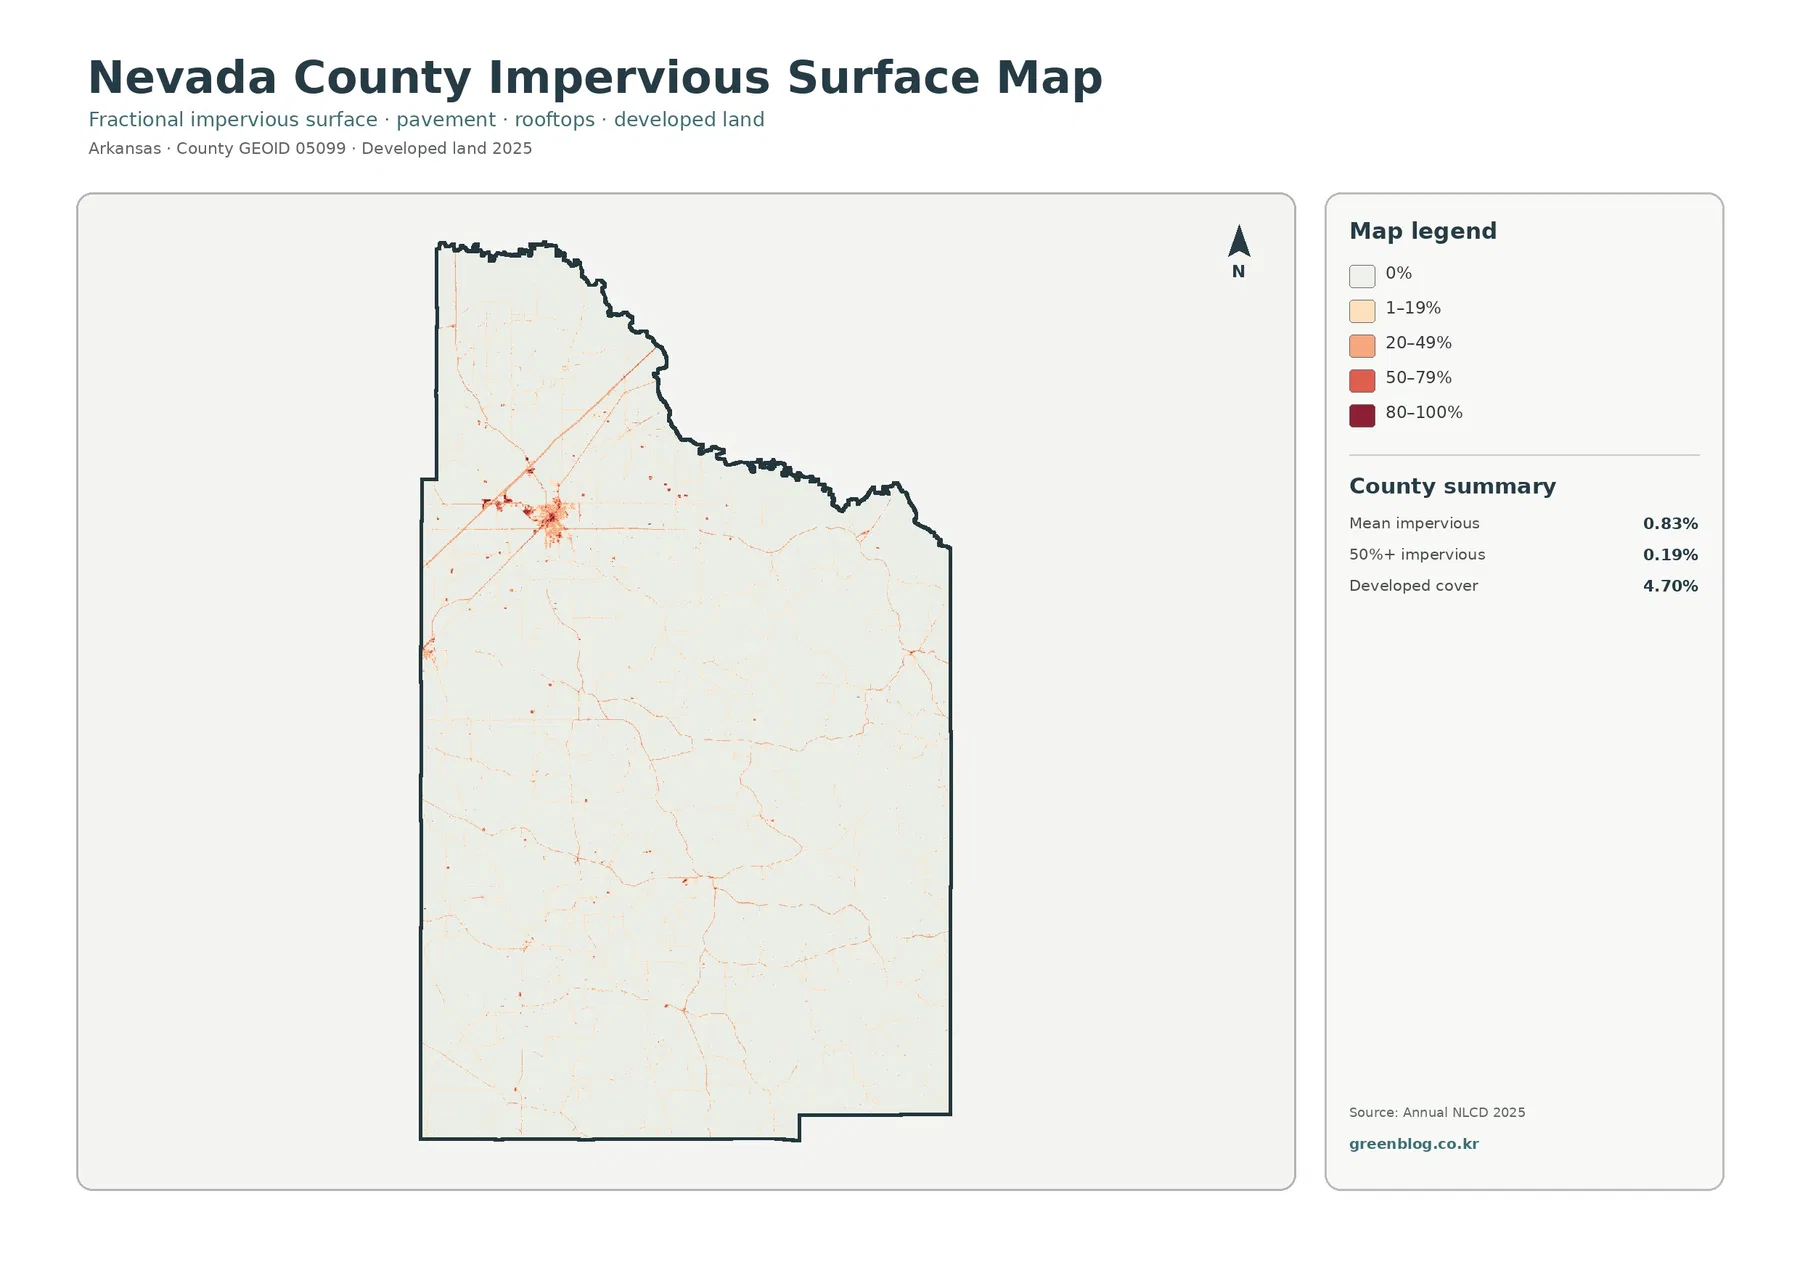
The most obvious cluster appears around Prescott in the northwestern part of the county. From that concentration, narrow built-surface lines extend along transportation routes, while smaller points and short corridors are scattered farther south and east. Large forested and wetland sections remain pale on this layer, making the contrast between the county’s main city and its rural surroundings especially clear.
Prescott is the Nevada County seat and the county’s largest city, which provides useful context for that concentration. The map, however, should not be used to measure individual streets or lots. A low-density neighborhood may contain houses, lawns, trees, driveways, and roads within the same raster cells, so its developed classification can be broader than the area that is actually sealed by pavement or rooftops.
For watershed or stormwater discussions, this layer can identify where built surfaces are concentrated, but it does not calculate runoff or flood risk. Soil, slope, rainfall, drainage infrastructure, and stream conditions also affect how water moves. Treat the impervious map as a countywide reference layer rather than an engineering assessment.
The northwest has the clearest farm-and-open-land concentration
The forest-and-farmland map makes the county’s northwest-to-southeast contrast easier to see. Large light-colored agricultural and pasture areas occupy much of the northwest, broken by forest patches and developed or other land. Farther south and east, forest becomes more continuous, although smaller agricultural openings still appear throughout the county rather than disappearing entirely.
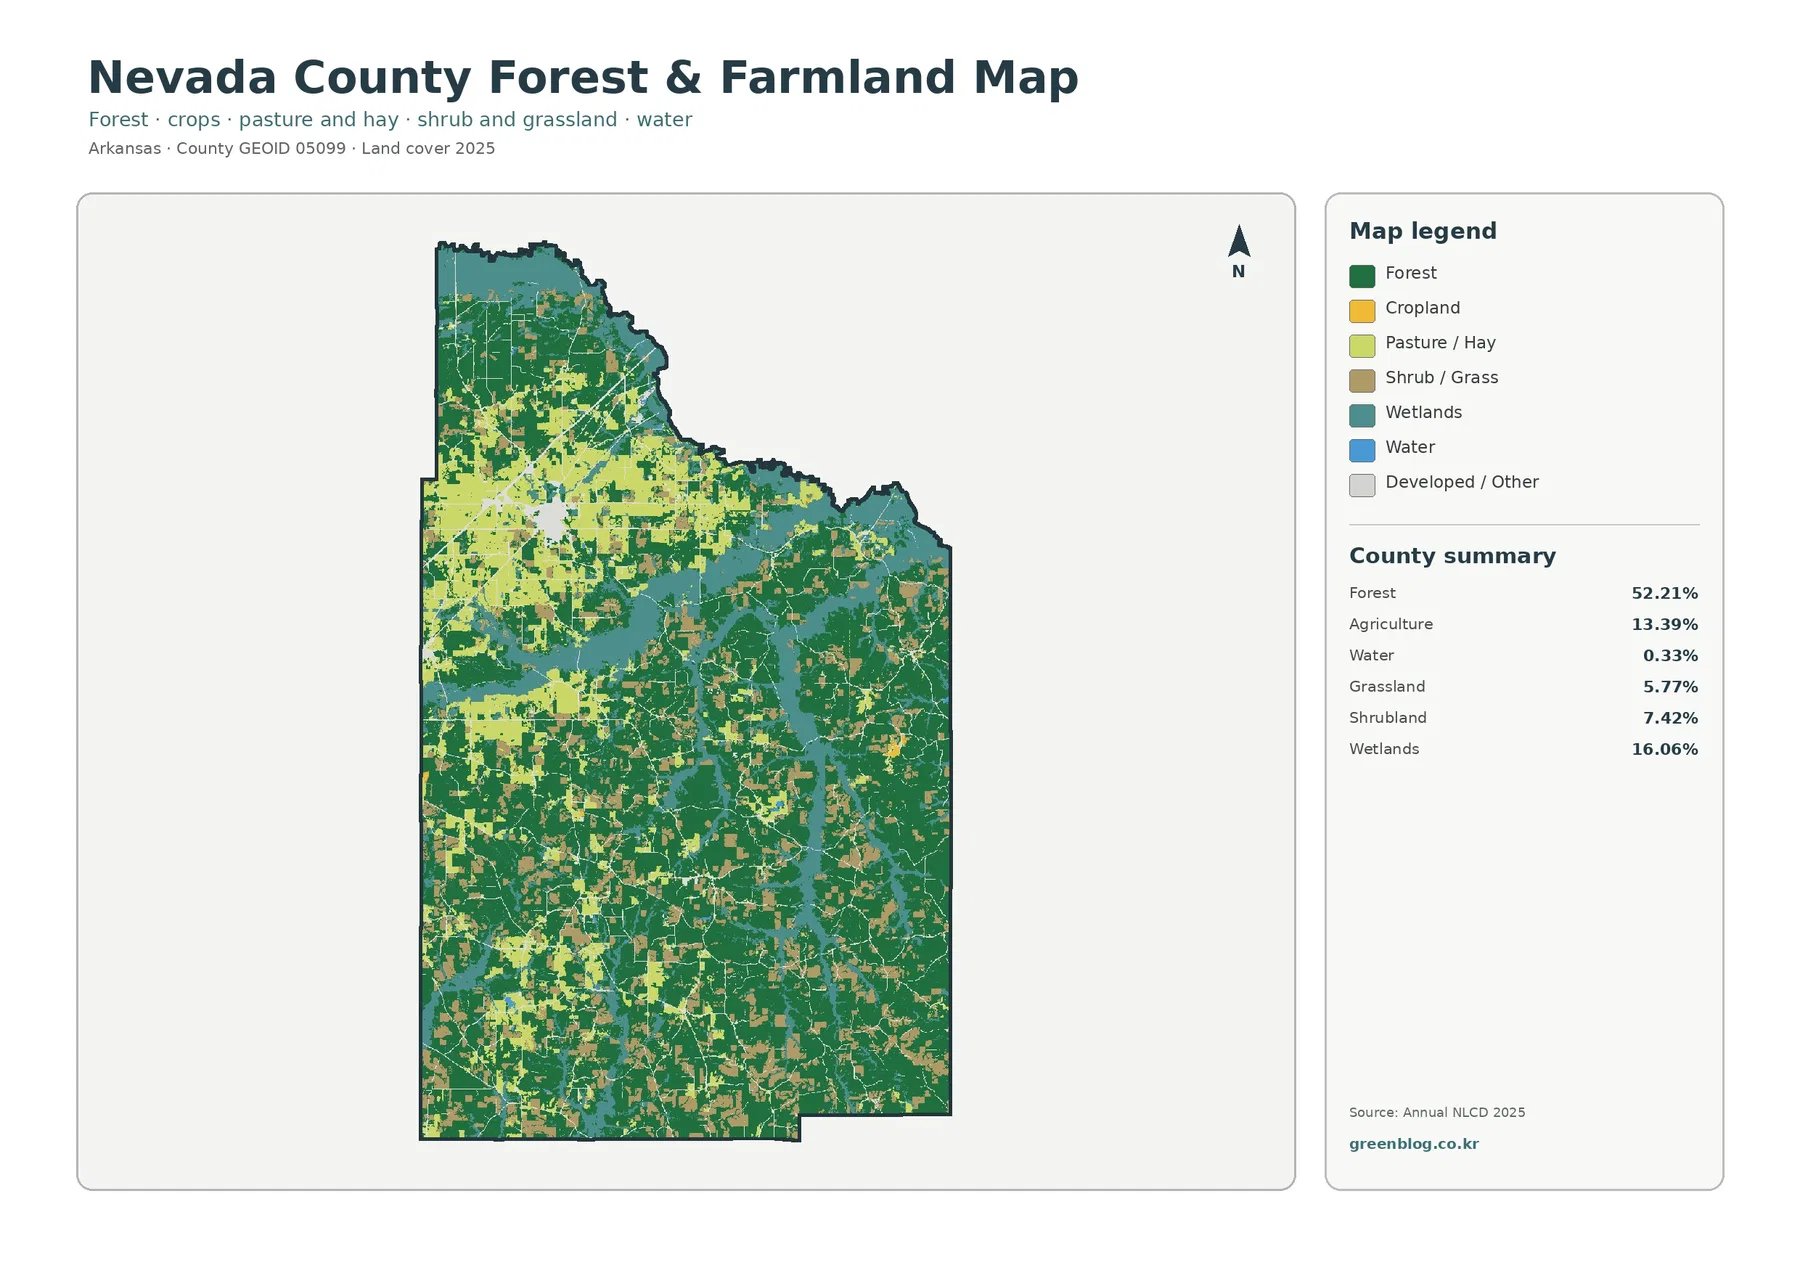
The 13.39% agriculture figure is a countywide summary, not a count of one crop or farm type. The simplified map separates cropland and pasture or hay from forest, shrub or grass, wetlands, water, and developed or other cover. Some open areas form broad connected patches, while others are small fields surrounded by trees. Reading those categories separately avoids treating every pale agricultural color as the same kind of farm operation.
Local background supports the importance of both forest and agriculture without changing what the map actually measures. The Association of Arkansas Counties describes Nevada County as a rolling, largely forested landscape and identifies timber as an important part of the local economy. The University of Arkansas Cooperative Extension maintains a Nevada County office in Prescott and provides research-based agricultural and community education. These references add context, but they do not assign ownership or production to any individual mapped patch.
Wetlands cover 16.06%, far more than the open-water class
Wetlands are one of the most important features to notice in Nevada County because their countywide share is larger than the agriculture share. They appear through the middle and eastern portions of the map in branching bands and broader patches, with additional wetland areas extending into the south. In several places they separate forest blocks or border agricultural openings, so they strongly influence the visual pattern even though open water is limited.
Open water and wetlands describe different surfaces. The 0.33% water class represents mapped open water, while the wetland class includes areas whose soils and vegetation are associated with wet conditions and may not look like a lake. That distinction explains why blue water occupies little of the map while teal wetland cover is widespread.
A land-cover wetland classification is not a legal wetland determination. Narrow channels, wet forest, field edges, and small water features can also be generalized by the raster grid. Anyone making a permitting, drainage, construction, or property decision should use the relevant agency records and site-specific work rather than this countywide map alone.
What the 1985–2025 change colors do and do not mean
The change layer compares the mapped classes for 1985 and 2025. It reports 27.04% class difference across Nevada County, including 1.01% classified as a change to developed, 13.77% forest loss, 2.01% agricultural loss, and 8.68% other class difference. Orange forest-loss patches are spread widely across the county, while developed change is much more limited and other categories form smaller scattered areas.
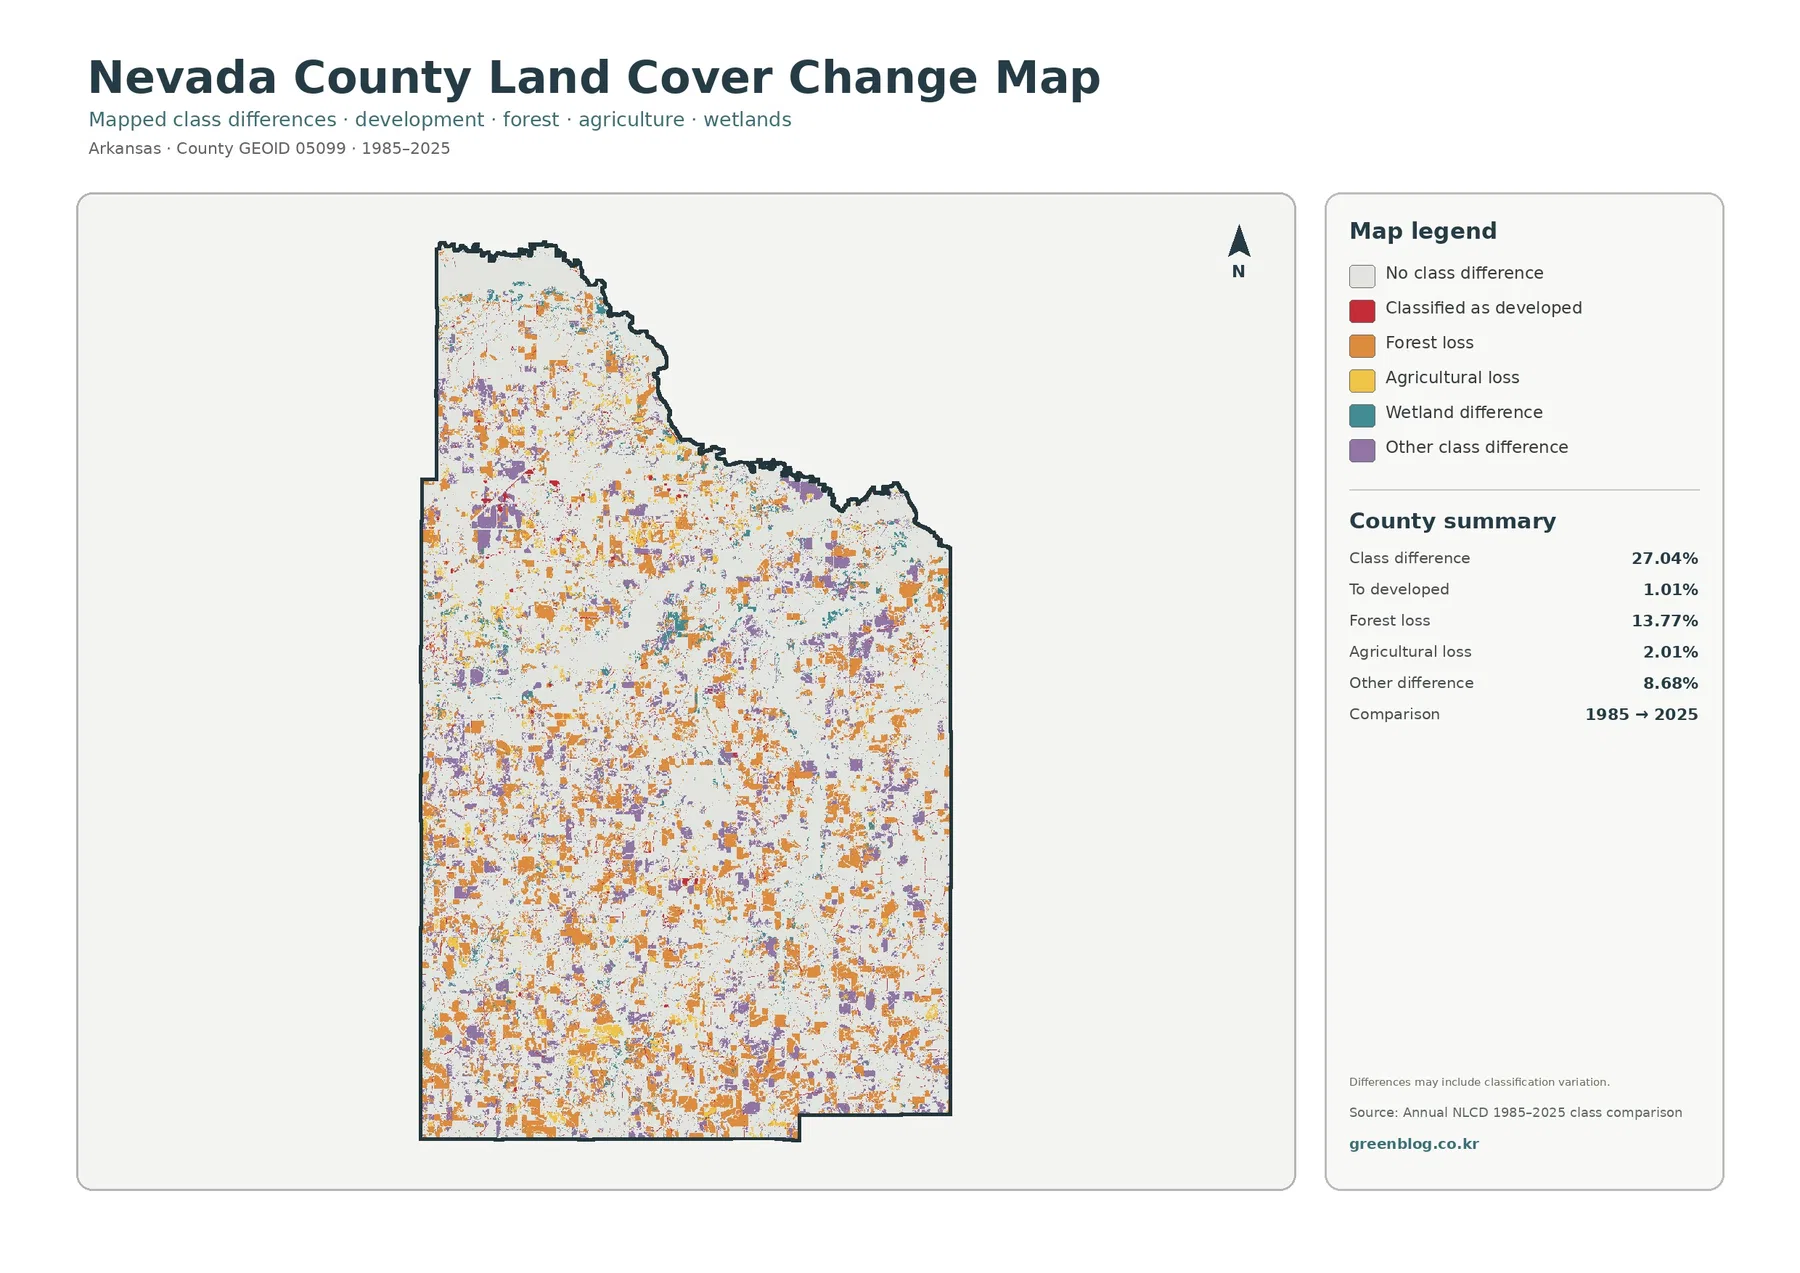
The 27.04% figure is not the percentage of Nevada County that was physically transformed by development. The map itself notes that the differences may include classification variation. Likewise, the 13.77% forest-loss category should not automatically be described as net forest decline over forty years. It identifies cells that were classified differently in the two comparison years, which is a different question from calculating all gains and losses through the entire time series.
A more careful workflow starts with a change patch and then checks what covers that location in 2025. If an orange patch is now agriculture, shrubland, or another open class, the annual sequence can help determine whether the change was temporary or persistent. If red developed-change cells appear near an existing settlement or road, historical aerial imagery can provide additional evidence. The two-year map is useful for finding places to investigate; it does not explain the cause by itself.
Choosing the right Nevada County map for a specific task
For a general county profile, start with the 2025 land-cover map because it keeps forest, wetlands, agriculture, grass or shrub cover, water, and developed land in one view. It works well when a report needs to explain why the northwest looks more open while much of the south and east remains wooded. The same map also provides the best first look at how wetlands sit between those major land-cover groups.
The forest-and-farmland view is better when the main question is rural land cover. Removing much of the general-map complexity makes agricultural openings easier to compare with forest blocks and wetland corridors. A classroom exercise, for example, can ask students to identify where agriculture forms larger connected areas and where it breaks into smaller patches surrounded by forest.
Use the impervious layer when the subject is settlement, transportation, or built surfaces. Its strong Prescott cluster and thin road-like lines communicate the county’s developed footprint more directly than the general map. The change view serves a different purpose: it is a screening tool for finding locations where classifications differ between 1985 and 2025 and should usually be interpreted alongside one of the current-condition maps.
For presentations, placing two maps side by side can be more informative than showing all four at once. The land-cover and impervious maps make a clear pair for discussing settlement within a largely rural county. The land-cover and forest-farmland maps are better for comparing forest, wetland, and agricultural patterns. The change map works best when the audience already understands the current 2025 distribution.
Raster scale and classification limits matter at local zoom levels
Annual NLCD products are designed for consistent regional comparison, not parcel surveying. Land cover is stored in raster cells, commonly about 30 meters across. A single cell can contain trees, a road, a yard, and part of a building, yet the dataset must still represent that area with a class or fractional value. This mixed-pixel effect becomes important near field edges, narrow streams, small ponds, and low-density development.
Nevada County’s frequent boundaries among forest, wetlands, pasture, and other open cover make that limitation especially relevant. A small wet area may disappear into a neighboring class, and a narrow road may be wider or less distinct than it is on the ground. The maps are most reliable for county-scale patterns and broad comparisons rather than exact measurements of small features.
The observation year matters too. A 2025 classification cannot show changes that happened after the imagery and data used for that product. Recent timber harvest, construction, storm damage, agricultural conversion, or restoration may not be reflected. When present-day site conditions are critical, combine the map with newer aerial imagery, local records, and field verification.
Download the Nevada County land-cover map set
The ZIP below contains the four original JPG maps discussed on this page: general 2025 land cover, forest and farmland, impervious/developed surfaces, and the 1985–2025 land-cover class comparison. Each image is 2480×1754 pixels. They can be inserted into reports, lessons, presentation slides, and countywide landscape references, provided the scale and classification limits described above are kept in mind.
Frequently Asked Questions
Why do wetlands look so prominent when water is only 0.33%?
Open water and wetlands are separate land-cover classes. Nevada County’s 2025 summary lists wetlands at 16.06% but open water at 0.33%. Wetland areas can have wet soils and wetland vegetation without appearing as a continuous blue water surface, so they occupy much more of the map than lakes and ponds.
Does the 13.77% forest-loss value mean Nevada County lost that much forest permanently?
No. The change map compares classifications in 1985 and 2025 and warns that differences may include classification variation. The forest-loss category identifies cells that changed from a forest classification in the comparison, but it is not automatically a net, permanent forest-loss rate for the full forty-year period. Annual data or historical imagery is needed for that kind of conclusion.
Sources and Reference Data
- MRLC Annual NLCD Data – land-cover and annual classification data
- USGS Annual NLCD Land Cover Classification – class definitions and interpretation guidance
- U.S. Census Bureau TIGER/Line Shapefiles – county boundary reference
- University of Arkansas Cooperative Extension, Nevada County – local agriculture and community education information
- Association of Arkansas Counties – Nevada County – county seat, landscape, and local economic context
Map File Information
The download contains four original Nevada County JPG maps covering 2025 land cover, forest and farmland, impervious/developed surfaces, and mapped class differences from 1985 to 2025.
- Printable Size: 2480×1754 pixels each
- File Type: ZIP containing four JPG files
Related Maps
- A Craighead County Arkansas Land Cover Map
- Arkansas County Arkansas Land Cover Map
- Ashley County Arkansas Land Cover Map
Green Map creates custom-edited map images using open geographic data sources such as geoBoundaries, Natural Earth, OpenStreetMap, and government open data.
These maps are edited visual materials, not raw data files, and are provided for education, documents, presentations, and graphic reference.