Newton County is one of the most forest-dominated county maps in this Arkansas series. The 2025 summary assigns 85.64% of the county to forest, while agriculture accounts for 10.31% and developed land for 3.03%. The four maps on this page separate that broad pattern into general land cover, forest and farmland, impervious/developed surfaces, and mapped class differences between 1985 and 2025.
The four original JPG maps used for this article are available together in the download section below. Use the general map for a countywide view, the forest/farmland version to isolate open agricultural areas, the impervious map to examine the small developed footprint, and the change map when you need to locate cells whose classification differs between the two comparison years.
Table of Contents
A county that remains overwhelmingly green on the 2025 map
The general land-cover map is dominated by one visual fact: forest extends across nearly the entire county. Large continuous green areas cover the south, west, and much of the interior, and forest also surrounds the agricultural openings in the north and east. Yellow agricultural patches interrupt the green in scattered groups, while red developed classes are small enough that they rarely become broad areas on the countywide view.
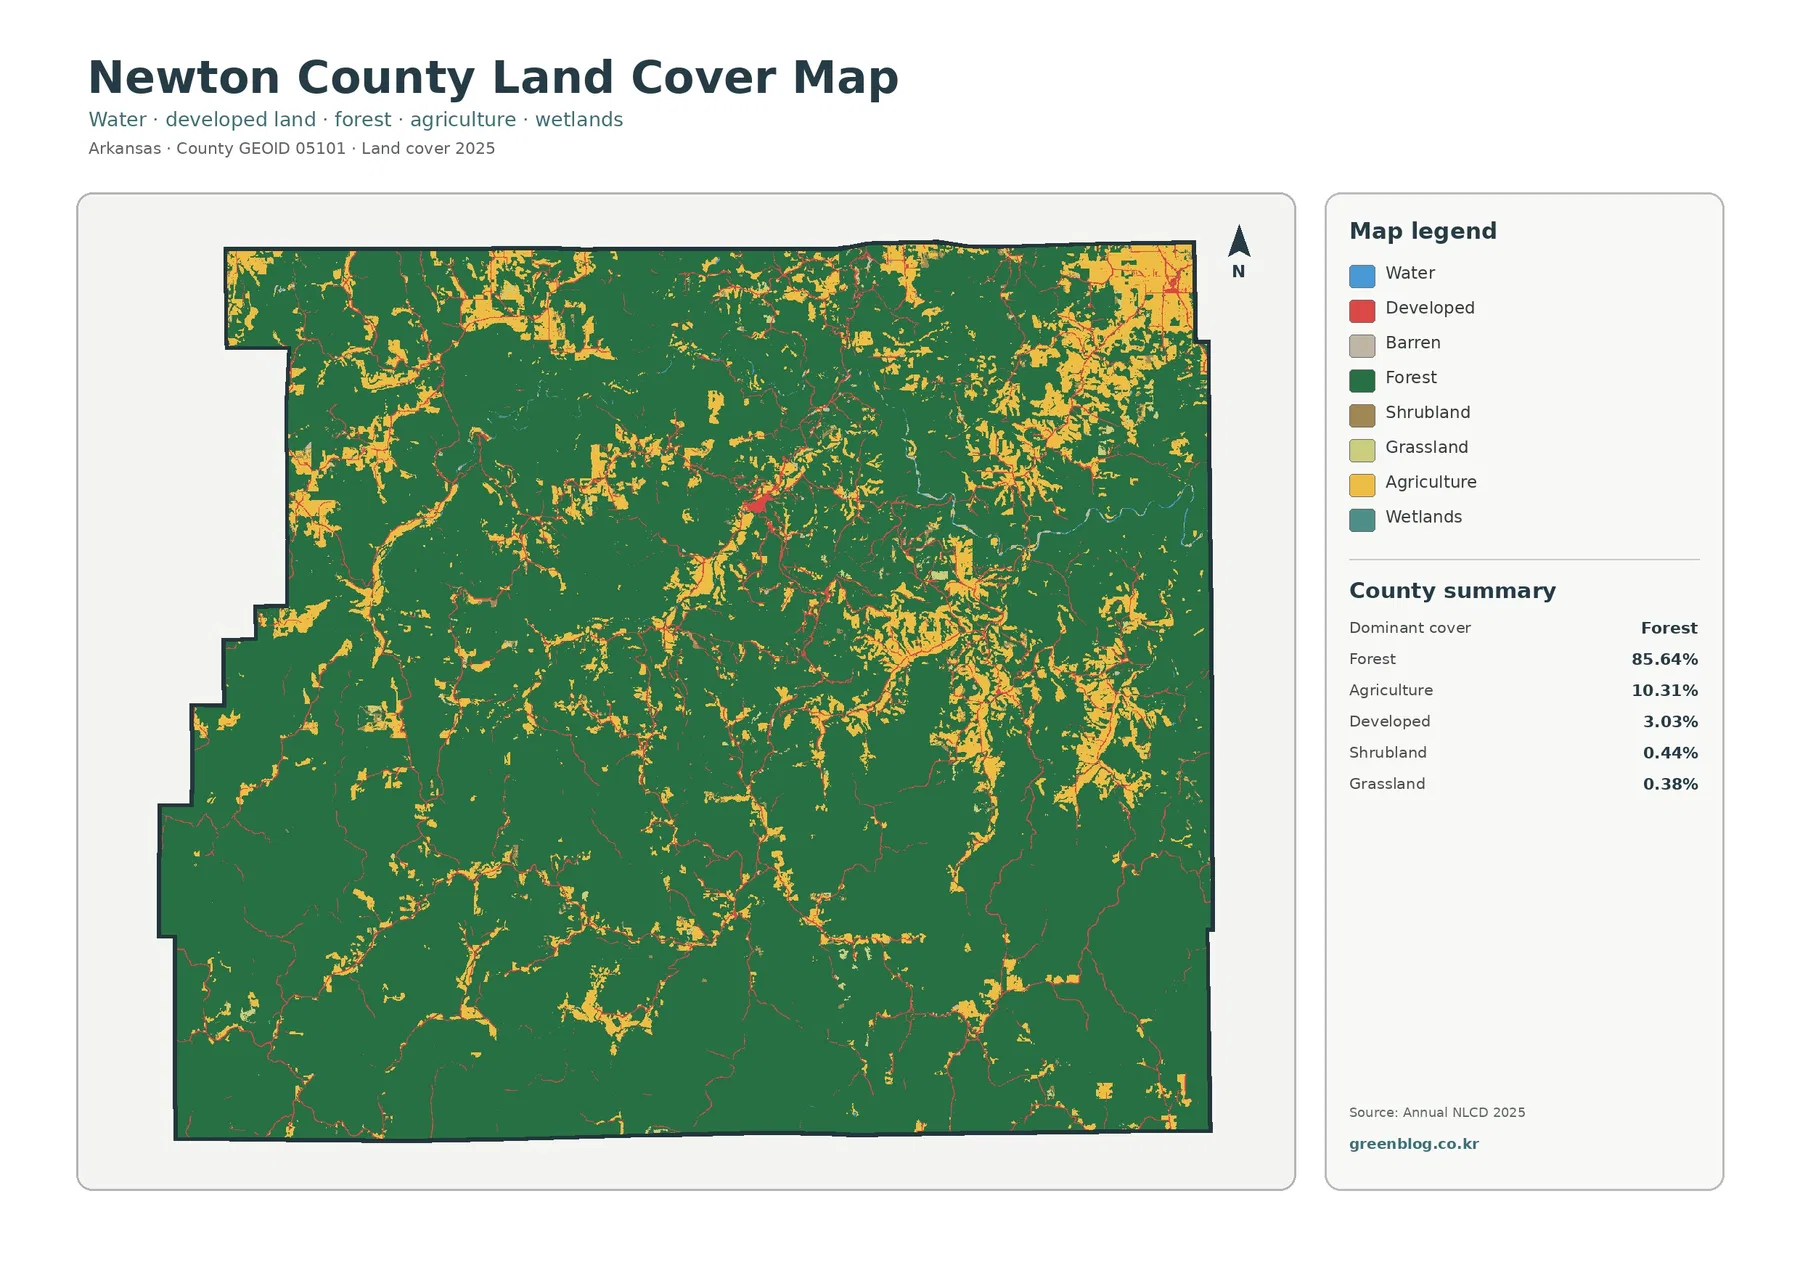
The summary values help put the colors into proportion. Forest is 85.64%, agriculture 10.31%, developed land 3.03%, shrubland 0.44%, and grassland 0.38%. Open water is only 0.06% and wetlands are 0.03%. Those small water percentages do not mean streams are absent; they mean open-water and wetland raster classes occupy only a small share of the county’s total mapped area at this resolution.
Land cover should not be read as a property or zoning map. A forest-classified cell can be on public or private land, and an agricultural cell does not identify a crop, owner, parcel, or legal land use. The classification describes the surface observed by the dataset. When ownership, parcel boundaries, development rights, or permitting matter, those questions require separate cadastral or local-government records.
Newton County’s countywide pattern also differs from a place where farms or city blocks form one large continuous zone. Here, the nonforest classes are dispersed inside a much larger forest matrix. That distinction matters when using the map in a report or lesson: the useful story is not simply that forest ranks first, but that small agricultural and developed areas are embedded within a very extensive wooded landscape.
Farm and pasture openings are easiest to see in the north and east
The forest-and-farmland map simplifies the palette and makes the agricultural openings much easier to trace. Larger groups of bright agricultural colors appear along the northern edge and especially toward the northeast. Smaller patches continue through central and eastern portions of the county, while the southwest and much of the south remain strongly forested. The result is an uneven pattern rather than a uniform agricultural belt.
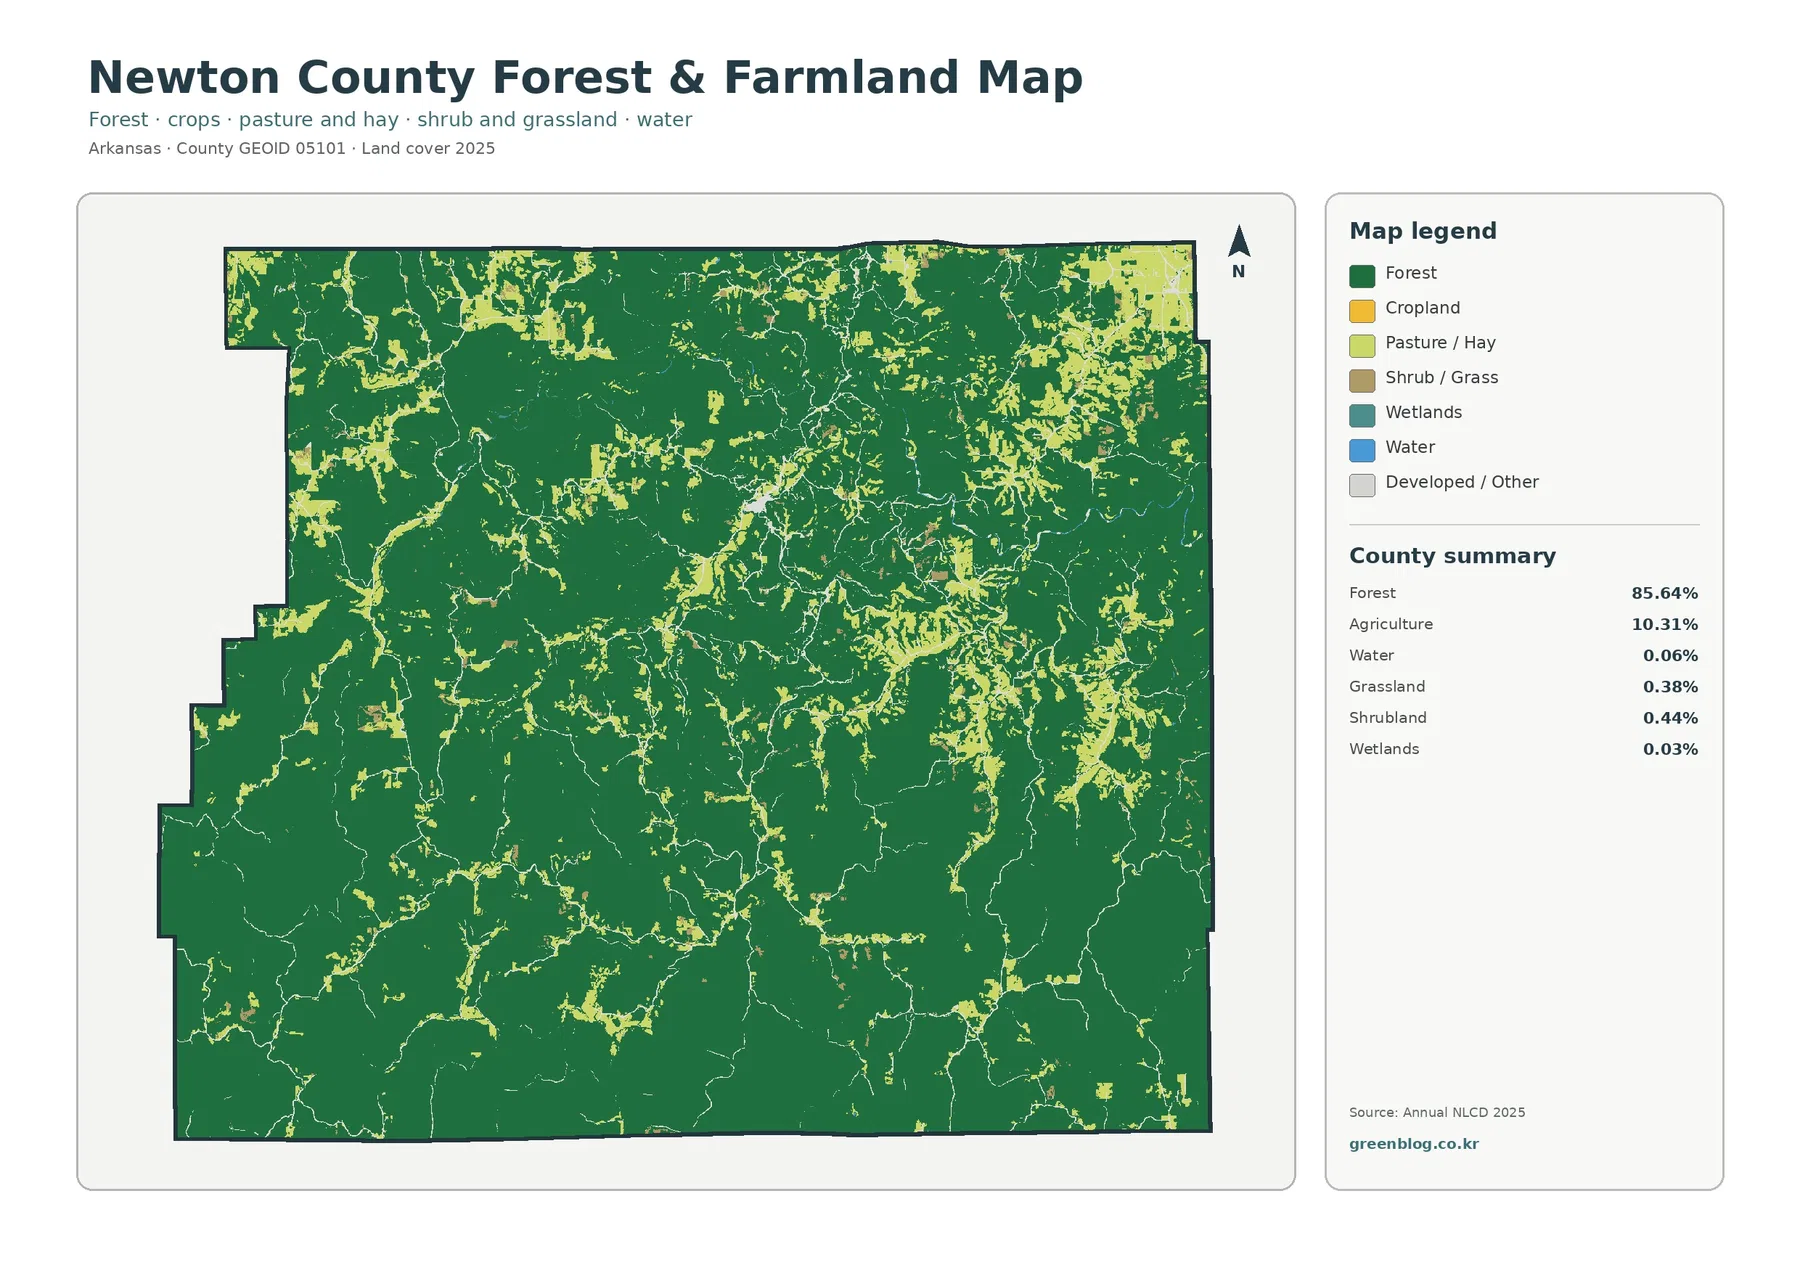
The legend distinguishes cropland from pasture or hay, and it also separates shrub/grass from developed or other cover. That distinction is useful in a heavily forested county because every pale opening is not the same type of land. A field, a pasture, a grassy clearing, and a low-density developed area can sit close together but represent different land-cover classes. Reading the legend prevents those light colors from being collapsed into one generic ‘farmland’ category.
The local landscape helps explain why these openings deserve attention even though agriculture is only 10.31% of the county total. The Association of Arkansas Counties describes Newton County as rugged, mountainous Ozark country, with elevations ranging from about 700 to 2,561 feet. That source also identifies the Ozark National Forest and Buffalo National River as major parts of the county’s setting. The land-cover map does not measure slope, but the official description establishes that the county is not a broad flat agricultural plain.
The University of Arkansas Cooperative Extension office in Jasper serves Newton County communities including Jasper, Mount Judea, and Western Grove and provides services related to agriculture, soils, livestock, forages, and community development. That is useful local context for the agricultural classes visible on the map. It should not be used to infer production from the 10.31% land-cover value, however. Land-cover area and agricultural production statistics answer different questions and come from different data systems.
A very small impervious footprint separates settlement corridors from the forest
The impervious-surface map strips away most of the land-cover colors and focuses on pavement, rooftops, and other surfaces that shed water rather than letting it soak into the ground. Newton County’s mean impervious value is only 0.30%, and just 0.04% of the county is mapped at 50% or greater imperviousness. Developed cover is 3.03%, so the county’s built footprint is small by both measures.
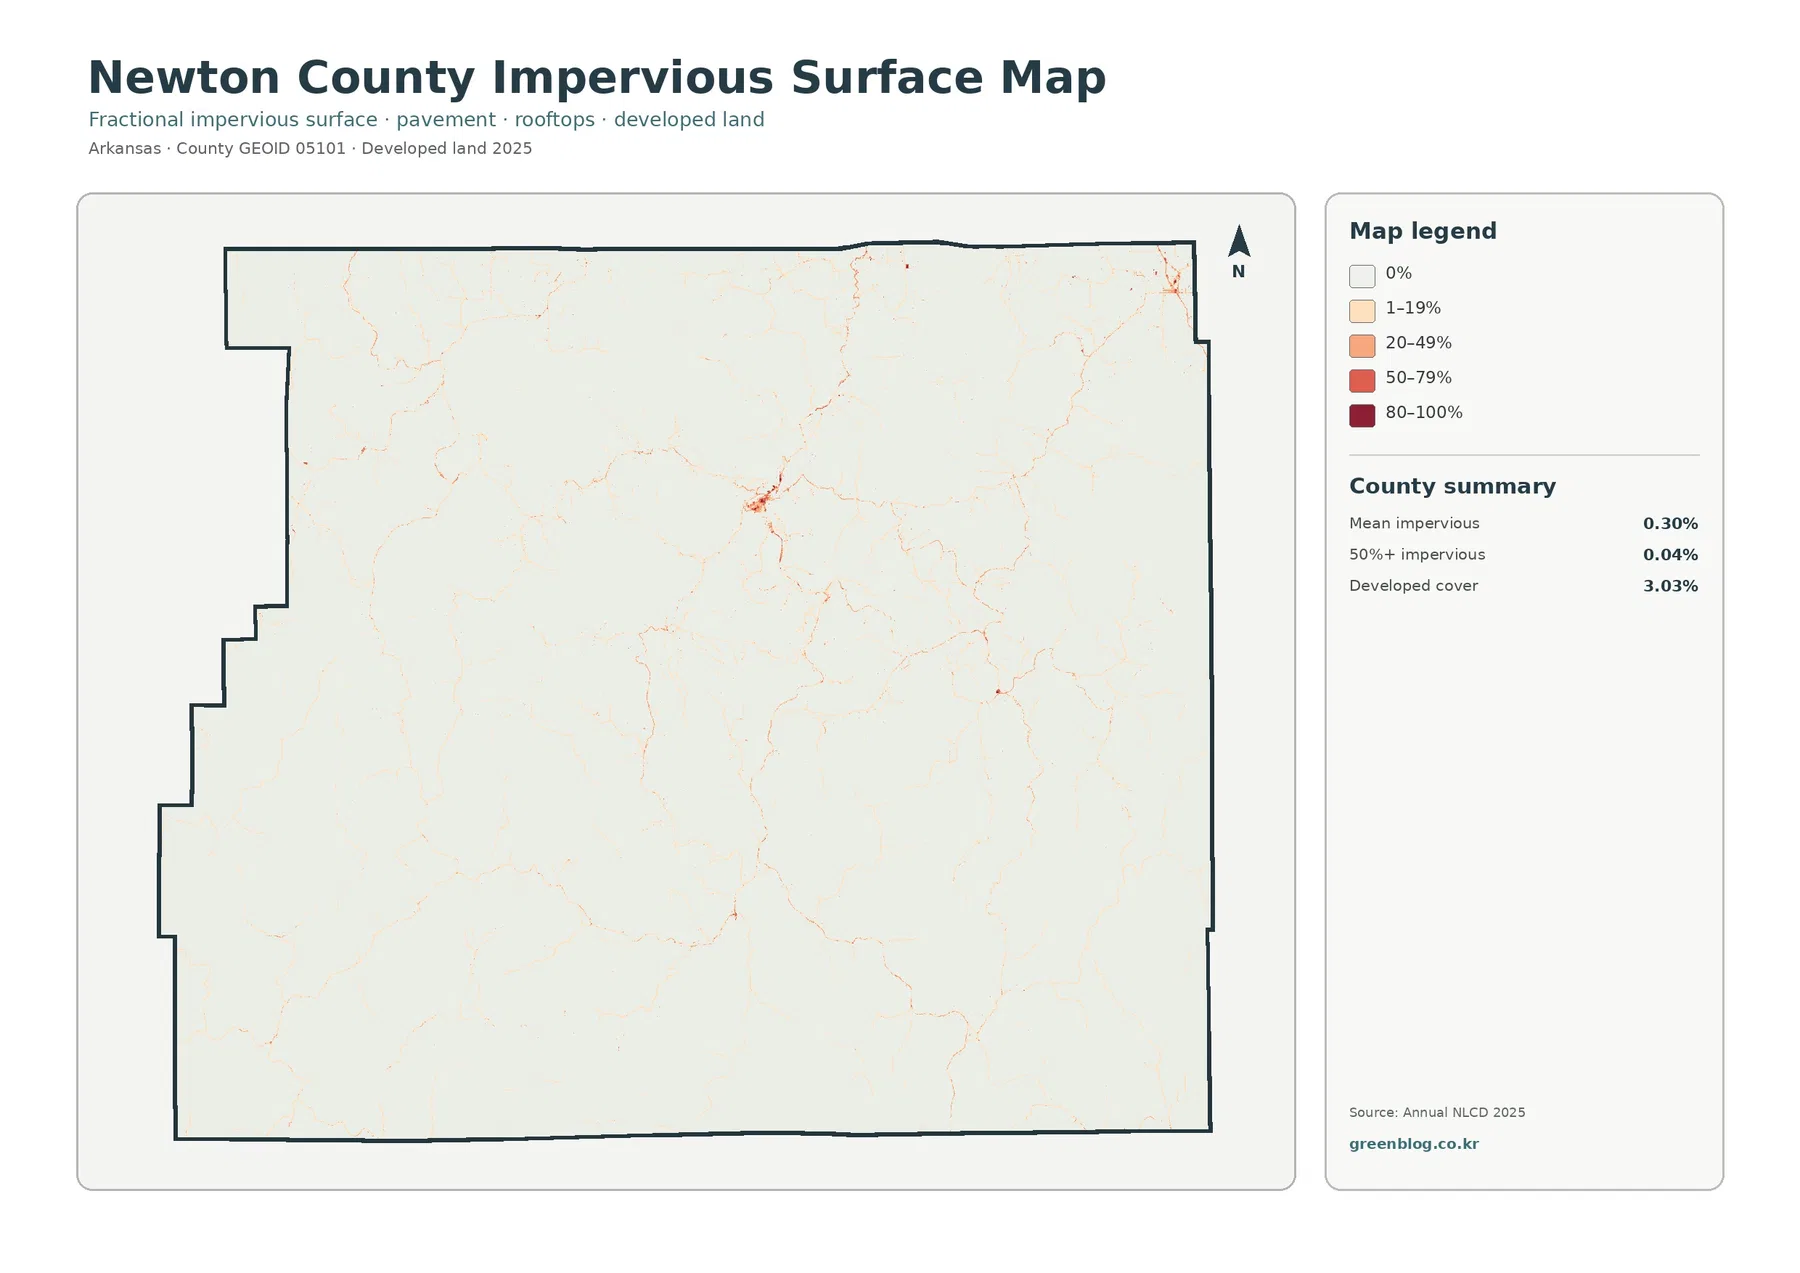
Most of the map is nearly white, with a few compact reddish concentrations and thin lines that resemble road or settlement corridors. One of the stronger clusters lies in the county’s interior, and another noticeable concentration appears near the northeastern edge. The broad southern and western forest areas contain very little high-intensity impervious surface. This pattern is more informative than the county average alone because it shows that the limited built cover is not spread evenly.
Jasper is the county seat, according to the Association of Arkansas Counties, and the University of Arkansas Extension office is also located there. Those references establish a local center for the county, but the preview map itself does not label towns. For that reason, a particular red cluster should not be treated as an exact municipal boundary without comparing it to a roads or places map. The impervious layer is best used to identify concentration and corridors, not city limits.
Developed land and impervious surface are related but not identical. A low-density developed class may include houses, lawns, trees, driveways, and local roads within the same 30-meter cell. The impervious value estimates the share represented by hard surfaces such as pavement or roofs. A cell can therefore be classified as developed while still showing a low impervious percentage. That is especially important in rural counties where homes and roads are surrounded by vegetation.
The 1985–2025 comparison shows limited mapped class differences
Newton County’s change map is much quieter than its 2025 land-cover map. The summary reports a total class difference of 5.81% between 1985 and 2025. Within that comparison, 0.53% is classified as change to developed, 2.99% as forest loss, 0.33% as agricultural loss, and 1.95% as other class difference. Most cells remain in the light ‘no class difference’ background.
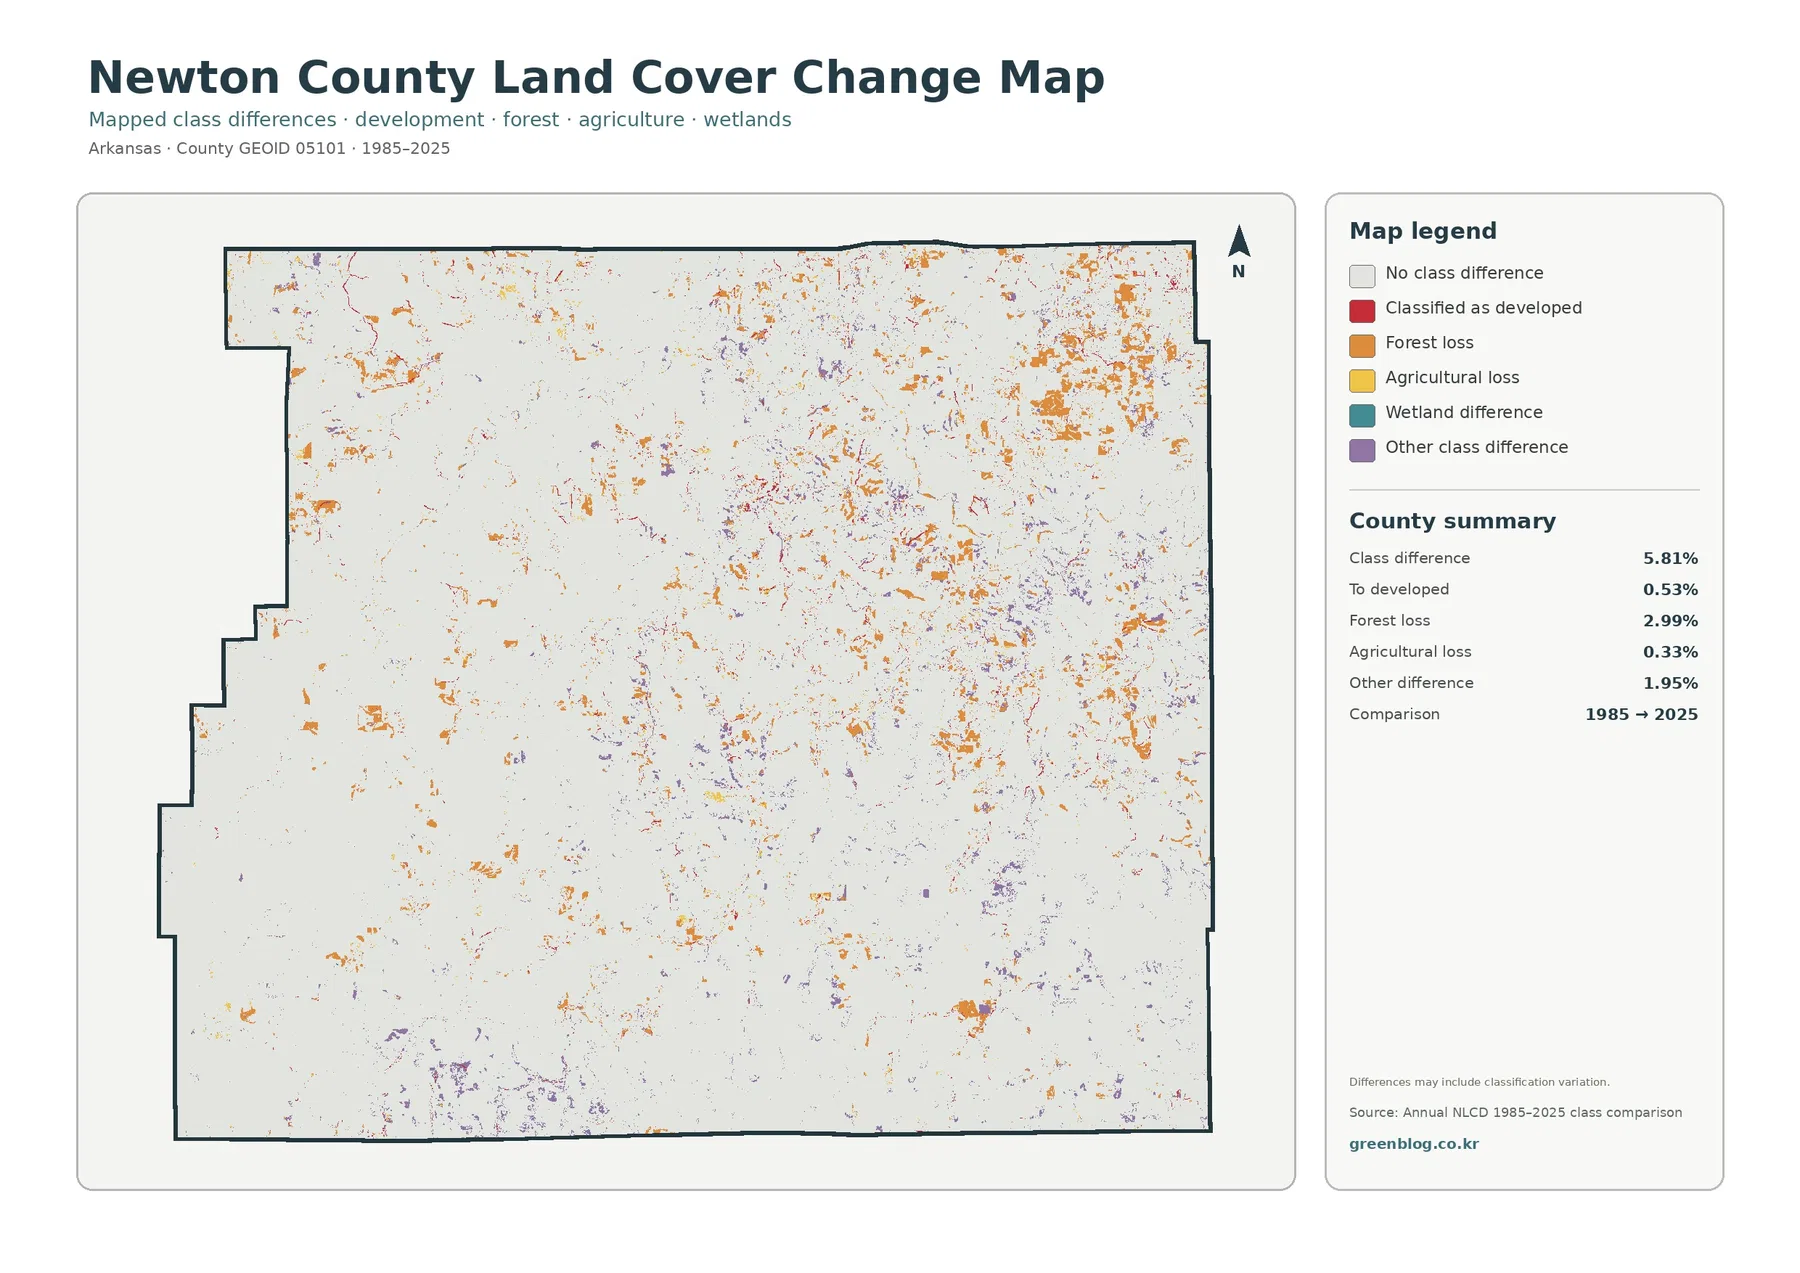
The orange forest-loss class is most noticeable in scattered northeastern patches and smaller spots elsewhere. Red developed-change marks are much less extensive, appearing as limited points and short lines. The map is useful for locating places where the two classifications differ, but it does not explain the process behind each change. Timber harvest and regrowth, agriculture, construction, disturbance, or classification effects can produce very different histories that look similar in a two-date comparison.
The 2.99% forest-loss value should therefore not be described as Newton County’s permanent net forest loss over forty years. The map itself warns that mapped differences may include classification variation. A cell that was labeled forest in the earlier comparison and another class in 2025 contributes to the change category, but that alone does not establish a continuous trend or a final net acreage. Annual NLCD layers or time-series imagery are needed for a stronger trend analysis.
A practical way to use the change layer is to treat it as a screening map. First identify a cluster of change cells. Then locate that same area on the 2025 land-cover map to see its current classification. If the location matters for research or planning, follow with annual data, historical aerial imagery, or field information. This workflow keeps the change map in its proper role: pointing to places that deserve a closer look rather than supplying a complete explanation by itself.
Buffalo National River and the Ozark setting add context the raster cannot label
Official local and federal sources give the forest pattern a useful geographic setting. The Association of Arkansas Counties describes Newton County as rugged Ozark Mountain country and highlights both the Ozark National Forest and Buffalo National River. The National Park Service explains that the Buffalo River originates in the Boston Mountains of the Ozark Plateau and runs through a landscape of deep valleys, bluffs, springs, caves, and varied elevations.
That context helps explain why a forest-dominated map is meaningful here, but it does not turn the green land-cover class into a public-land map. The NLCD forest category includes any qualifying forest surface, regardless of ownership. Ozark National Forest boundaries, National Park Service boundaries, and private forest parcels are separate legal and management layers. Anyone studying land management should overlay or compare those authoritative boundary datasets rather than inferring them from the land-cover colors.
The same caution applies to water. The National Park Service describes Buffalo National River as a free-flowing river through the Ozark landscape, yet the land-cover summary lists only 0.06% open water. A narrow river corridor can be geographically and ecologically important while still occupying a tiny fraction of county area. At 30-meter raster resolution, narrow channels may also share cells with forest or other adjacent cover. A river map and a land-cover map answer complementary rather than interchangeable questions.
Choosing among the four maps depends on the question
For a quick county profile, start with the general 2025 land-cover map. It shows the overwhelming forest share while keeping agriculture and development visible in the same frame. If the purpose is to compare wooded land with agricultural openings, switch to the forest-and-farmland view. Its simplified legend makes the north and northeast stand out more clearly and reduces distraction from minor classes.
For settlement and transportation context, the impervious layer is more revealing than the general map. It highlights the few places where pavement and rooftops concentrate and shows how thin those built corridors are across a mostly rural landscape. In environmental education, this can be used to explain why a 3.03% developed-cover value is not the same as 3.03% completely paved land. Low-density development often includes large amounts of vegetation within the same mapped cell.
The change map belongs at the end of the sequence when the goal is interpretation. Once the current forest, agricultural, and developed patterns are familiar, the scattered 1985–2025 differences are easier to place in context. Because total class difference is only 5.81%, it is especially important not to exaggerate the colored patches. They identify classification differences, not a statement that 5.81% of the county was necessarily transformed by one type of human activity.
Scale, mixed pixels, and observation year set important limits
Annual NLCD products are designed for consistent regional comparison and generally use raster cells about 30 meters across. A raster cell is simply a fixed square of ground represented by a classification or value. If a cell contains trees, a road, a house, and grass, the mapped result generalizes that mixture. This is why small roads, stream edges, narrow clearings, and property boundaries may not match what a visitor sees on the ground.
Mixed pixels matter in Newton County because so many small openings sit inside forest. A thin road can be averaged with surrounding vegetation, and a small farmstead can appear as a broader developed or agricultural cell. Conversely, a narrow stream may not form a continuous blue line if forest dominates the surrounding cells. The maps are appropriate for countywide pattern comparison, not parcel surveying, wetland jurisdiction, engineering design, or legal boundary decisions.
The year of observation is another limit. The 2025 classification does not include changes that occurred after the data used for that map. Recent timber harvest, construction, storm damage, agricultural conversion, or restoration may be absent. When present-day site conditions are important, use newer aerial imagery, local records, and field verification alongside these maps rather than assuming the raster is current to the day.
Finally, percentages should stay attached to the dataset and year printed on the map. Forest at 85.64% is a 2025 mapped summary, while the 5.81% class-difference value belongs to the 1985–2025 comparison. Those numbers should not be projected into future years or treated as census-style measurements. Their strength is consistent landscape comparison at the county scale.
Download the Newton County map files
The ZIP below contains the four original JPG maps discussed in this article: 2025 general land cover, forest and farmland, impervious/developed surfaces, and the 1985–2025 land-cover comparison. Each image is 2480×1754 pixels. The files can be placed in reports, lessons, presentation slides, and countywide landscape references. For large-format printing, check the legend and small change patches at the intended print size before final output.
Frequently Asked Questions
Why is open water only 0.06% when Buffalo National River is important in Newton County?
Open-water percentage measures the area classified as open water in the 2025 raster; it does not measure the cultural, ecological, or recreational importance of a river corridor. Buffalo National River is narrow relative to the county’s total area, and at roughly 30-meter raster resolution some narrow channel cells can also be influenced by adjacent forest. Use an NPS river map when the precise river corridor is the main subject.
Does the 5.81% class difference mean 5.81% of Newton County was developed between 1985 and 2025?
No. The total class-difference value combines several categories. Only 0.53% is shown as change to developed, while 2.99% is forest loss, 0.33% agricultural loss, and 1.95% other class difference. The map also notes that classification variation may contribute to differences. It is a two-date comparison, not a direct measure of total construction or permanent land conversion.
Sources and Reference Data
- MRLC Annual NLCD Data – official land-cover and annual classification data portal
- USGS Annual NLCD Land Cover Classification – class definitions and interpretation guidance
- U.S. Census Bureau TIGER/Line Shapefiles – official county-boundary reference
- University of Arkansas Cooperative Extension – Newton County – local agriculture, soils, forage, and community information
- Association of Arkansas Counties – Newton County – Ozark terrain, elevation range, Jasper, and local landscape context
- National Park Service – Buffalo National River – Buffalo River, Boston Mountains, valleys, bluffs, and Ozark natural-resource context
Map File Information
The download contains four original Newton County JPG maps covering 2025 land cover, forest and farmland, impervious/developed surfaces, and mapped class differences from 1985 to 2025.
- Printable Size: 2480×1754 pixels each
- File Type: ZIP containing four JPG files
Related Maps
- A Craighead County Arkansas Land Cover Map
- Arkansas County Arkansas Land Cover Map
- Ashley County Arkansas Land Cover Map
Green Map creates custom-edited map images using open geographic data sources such as geoBoundaries, Natural Earth, OpenStreetMap, and government open data.
These maps are edited visual materials, not raw data files, and are provided for education, documents, presentations, and graphic reference.