Lee County, Arkansas is overwhelmingly agricultural in the 2025 land-cover summary, but the map is not a simple block of cropland. Agriculture accounts for 69.78% of the county, while wetlands make up another 18.16%. The western and central sections are dominated by broad agricultural areas, whereas the eastern side contains a much more intricate mix of wetlands, water, cultivated land, and curved boundary features.
This page provides four views of the same county: general land cover, forest and farmland, impervious and developed land, and a 1985–2025 land-cover change comparison. The WebP images in the article are quick previews. The four original JPG maps supplied with the package are available together in one ZIP download, making it easier to choose a map for reference, teaching, printing, or a closer comparison of specific land-cover patterns.
Table of Contents
A county dominated by fields, with wetlands becoming more prominent toward the east
The broadest visual pattern is the contrast between extensive agricultural cover and the water-related classes that cut through it. Large yellow agricultural areas fill much of the west, center, and north. Wetlands appear as narrow bands in some western sections, then become wider and more complicated across the central-east and eastern edge. Water follows many of the same curving corridors, creating a patchwork that is very different from the more regular agricultural blocks farther west.
Wetlands are especially important to the way this county looks on the map because 18.16% is a substantial share of the total area. They are not evenly distributed. The eastern half contains many of the largest wetland zones, while smaller strips and patches also appear along channels extending into agricultural country. Reading the percentage together with the map location gives a better picture than either one alone: agriculture is clearly dominant overall, yet water-related cover strongly shapes the eastern landscape.
Forest covers only 4.08% of the county, but one comparatively large forested block stands out in the southeastern interior. Smaller wooded pieces occur elsewhere, often next to wetlands or agricultural land. Because this forest is concentrated rather than evenly scattered, it can look more significant on the map than a four-percent countywide figure might suggest. The map therefore works best when percentages are used to describe total area and colors are used to understand where that area is concentrated.
Developed land represents 4.53% of the 2025 summary. The strongest developed cluster is near the middle of the county, with smaller concentrations to the west and southwest. Thin developed lines also cross the agricultural landscape in a road-like grid. The supplied map does not label cities or roads, so these features should not be assigned names from appearance alone. What the image reliably shows is where developed surfaces form clusters and where they appear as narrow connections through fields.
The 2025 land-cover map puts 69.78% agriculture beside 18.16% wetlands
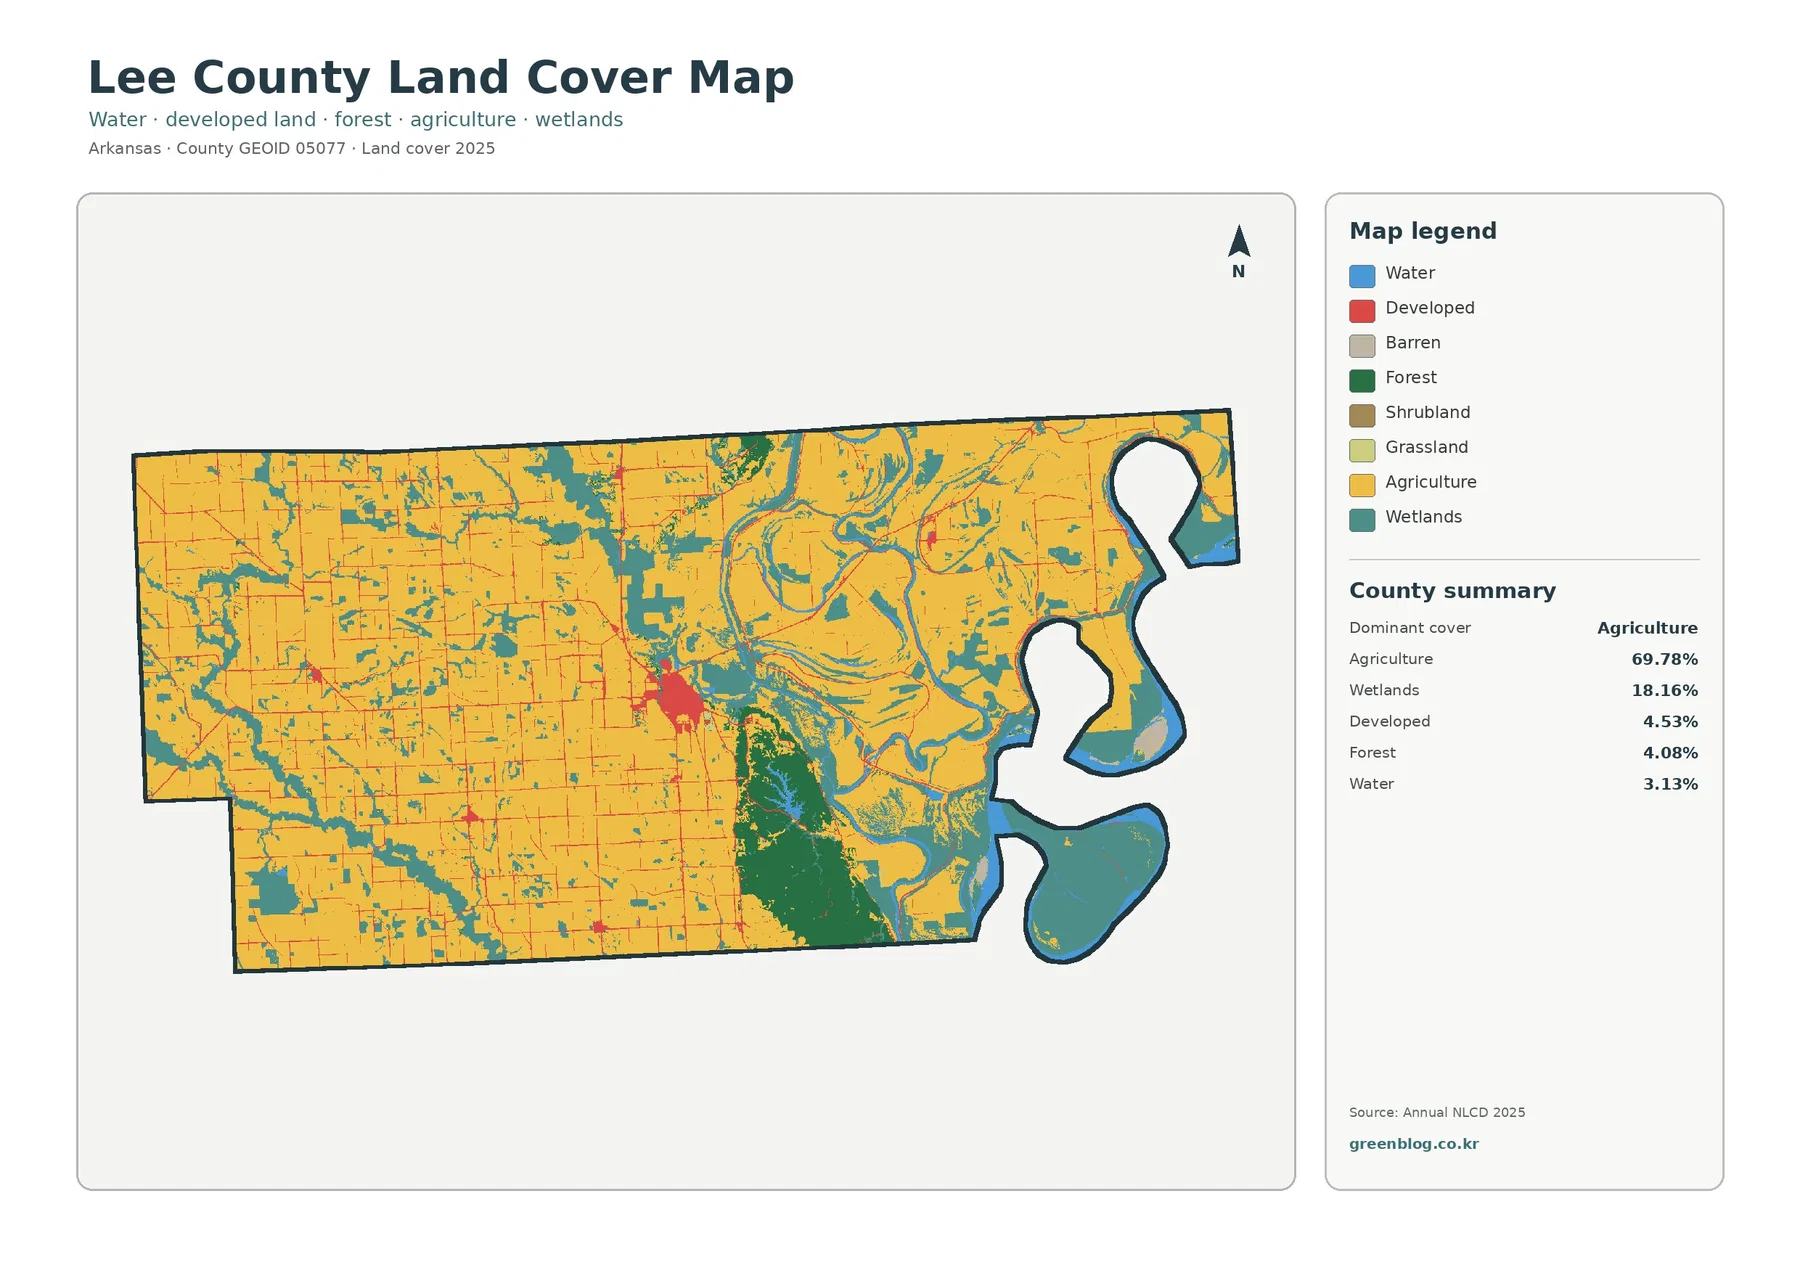
The general map is the best starting point because it displays water, developed land, barren cover, forest, shrubland, grassland, agriculture, and wetlands together. The county summary lists agriculture at 69.78%, wetlands at 18.16%, developed land at 4.53%, forest at 4.08%, and water at 3.13%. Those figures explain most of the visible color on the map and establish Lee County as a strongly agricultural landscape with a notable wetland component.
Agriculture is most continuous across the western half and remains widespread through the center. It also extends into the east, but there the agricultural areas are divided by more wetland and water features. The difference matters when using the map in a report or classroom. Saying that nearly seventy percent of the county is agricultural is accurate, but it does not mean every part of Lee County has the same field-dominated appearance.
Water makes up 3.13% of the county summary. Although its percentage is smaller than developed land or forest, it is visually easy to notice because it forms long, curved shapes and broad bends. Many of those water features sit next to wetland cover, particularly in the eastern portion. This map is not a hydrography or flood-hazard map, however. It does not provide channel names, water depth, discharge, levees, or flood probability, so the blue and teal classes should be used only to understand general surface-cover patterns.
Barren, shrubland, and grassland classes also appear in the legend, but the main land-cover summary does not provide a separate countywide percentage for each of them. The forest-and-farmland view reports grassland at 0.07% and shrubland at 0.00%, yet those values belong to that map’s simplified summary. It is better to retain the supplied figures as shown rather than inventing additional totals from visual estimates.
Forest and farmland view makes the southeastern wooded block easier to separate from fields
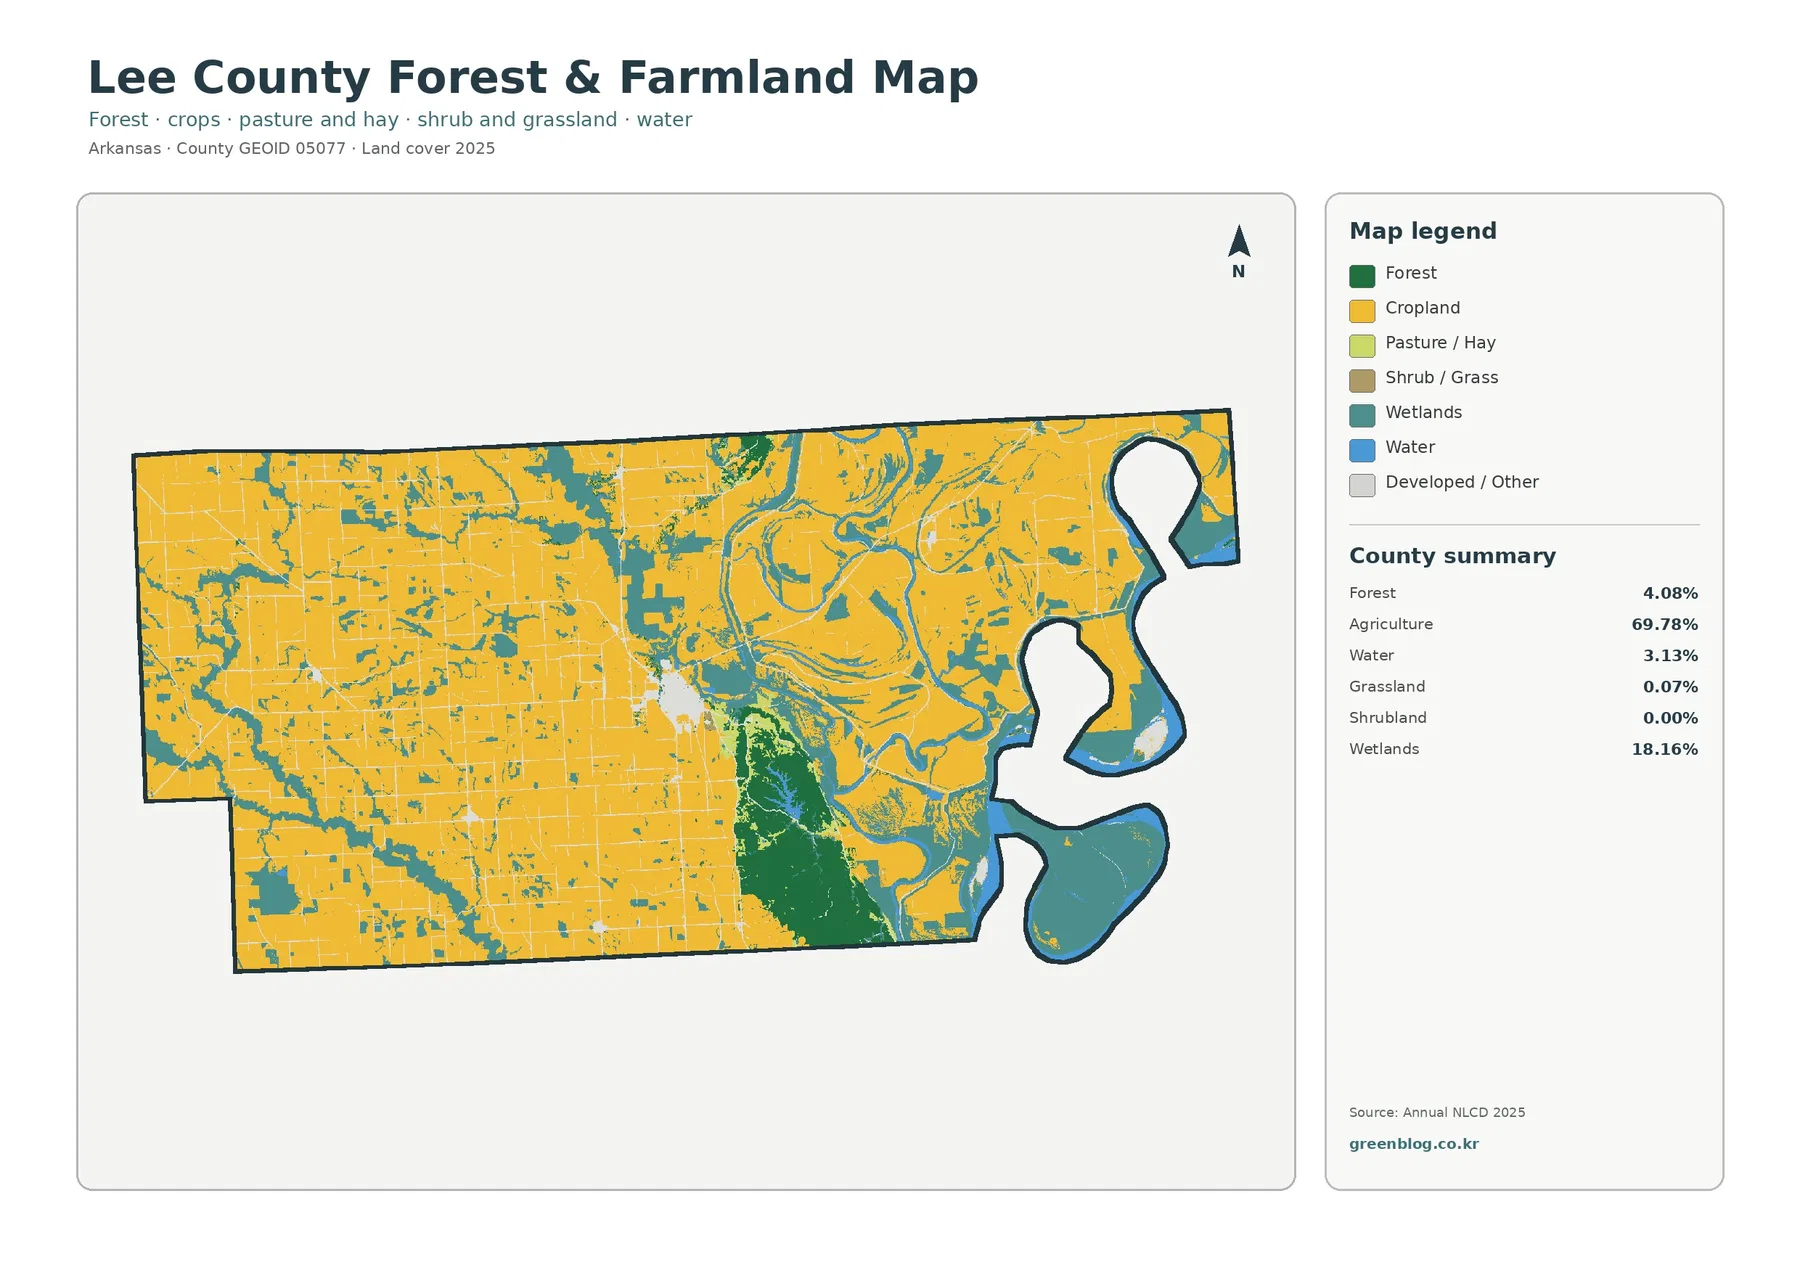
The forest-and-farmland map removes some of the visual competition from developed classes and gives more attention to vegetation and water-related cover. Cropland fills most of the broad western and central areas, while the large southeastern forest patch is immediately visible in dark green. Wetlands retain a strong presence through the eastern half and along narrower corridors extending westward, making this view useful for comparing managed agricultural surfaces with wooded and wet areas.
The county summary groups agriculture at 69.78%, even though the legend distinguishes cropland from pasture and hay. No separate county percentage for those two agricultural subclasses is supplied in the summary, so they should not be assigned precise shares here. The visual impression suggests that cropland is the dominant agricultural color, but a numerical split would require a separate calculation from the underlying data rather than an estimate from the preview.
Forest at 4.08% describes tree-dominated surface cover, not ownership or management status. A green area cannot be identified as public forest, private timberland, a protected site, or a particular tree community from this map alone. Its value is simpler: it shows where tree cover is concentrated relative to agriculture, wetlands, and water. Property, forestry, or conservation questions require additional records or specialized maps.
The same caution applies to wetlands. The 18.16% wetland class is a land-cover classification derived from remotely sensed data. It should not be treated as a legal wetland delineation, a permit boundary, or a direct measure of flood risk. For a reader comparing landscape patterns, however, the map clearly shows that wet areas are a major part of the county’s eastern surface and often lie directly beside agricultural cover.
Why 4.53% developed cover does not mean 4.53% of Lee County is paved
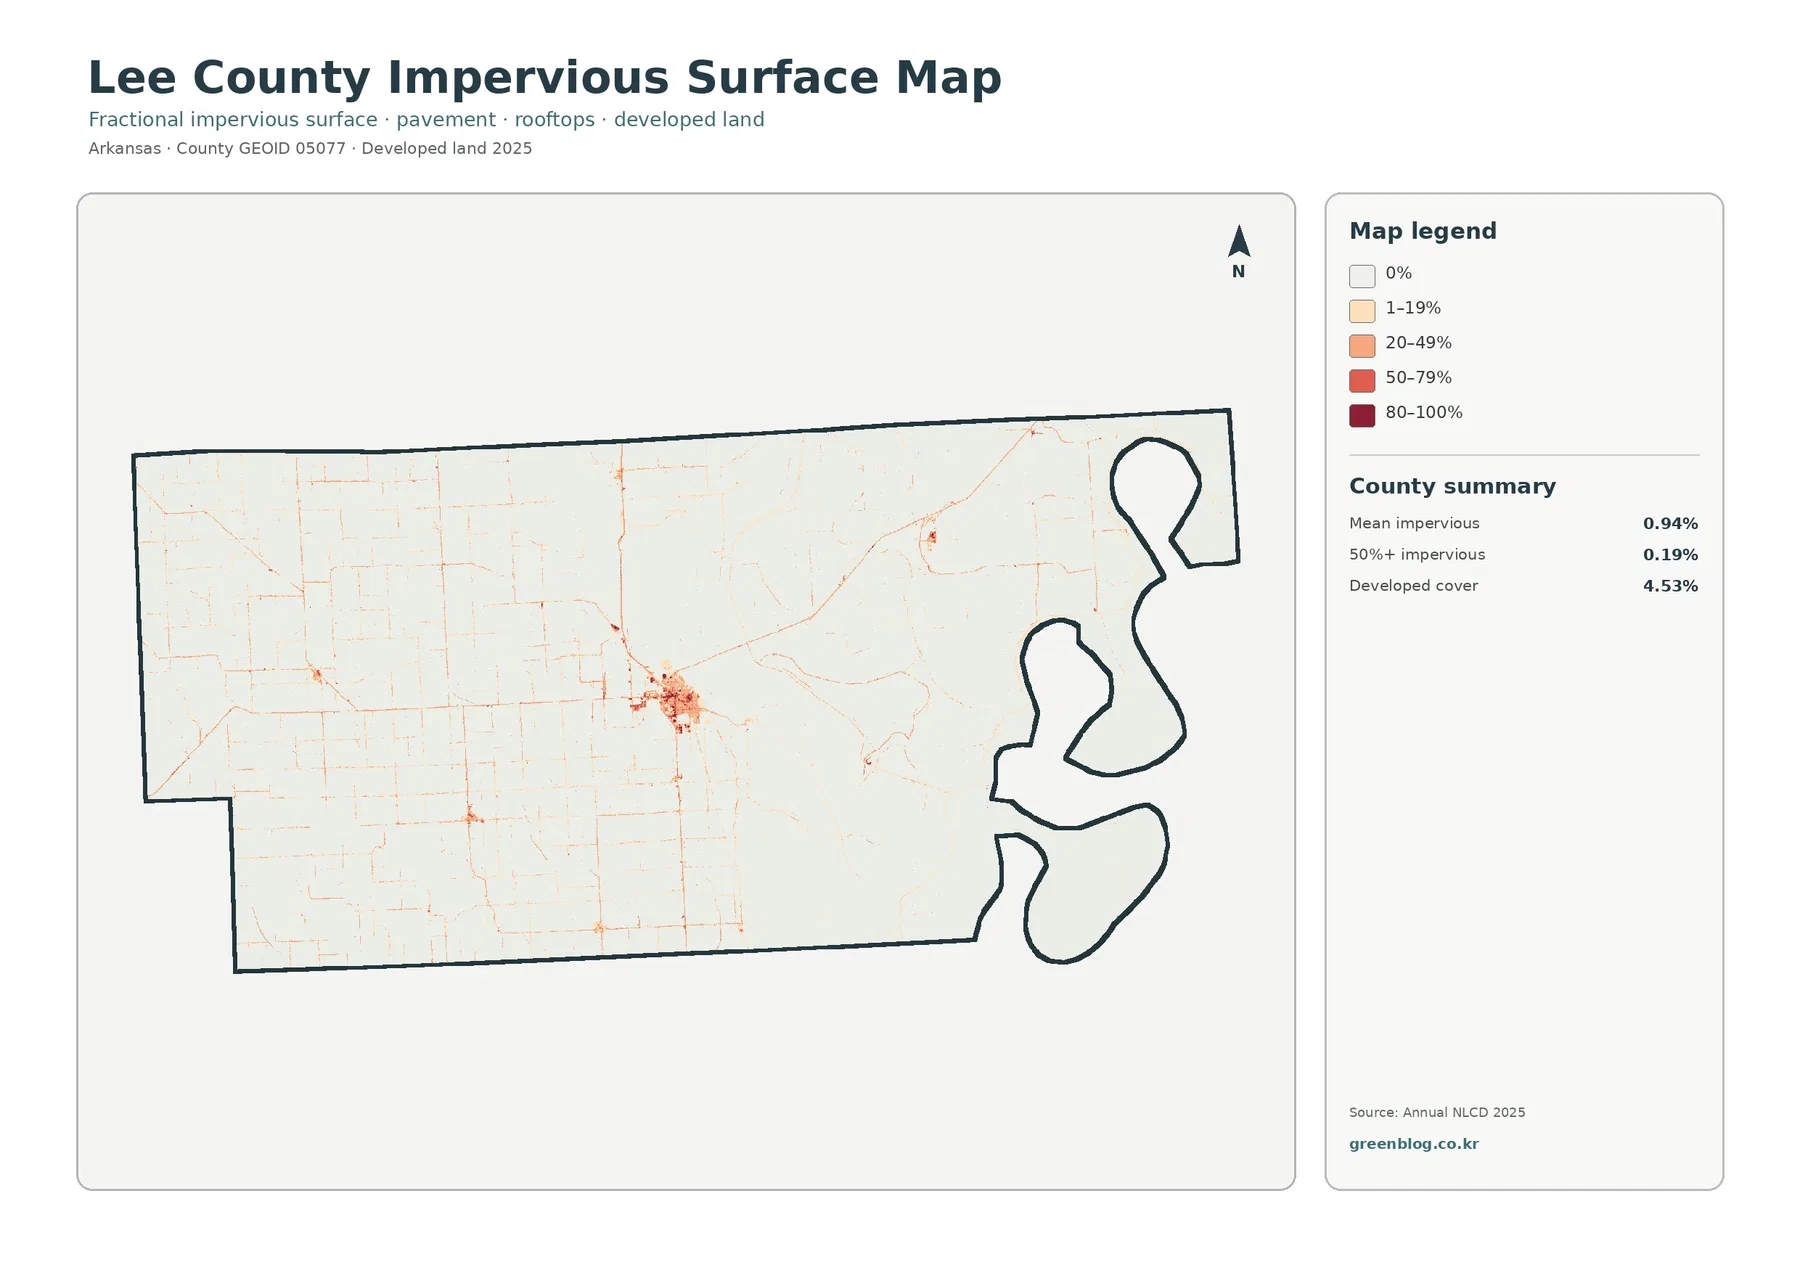
Impervious surface refers to pavement, rooftops, parking areas, and other surfaces that do not readily absorb rainfall. The county summary gives Lee County a mean impervious value of 0.94%, while only 0.19% of the county falls in the 50%-or-more impervious category. Those numbers are much lower than the 4.53% developed-cover figure on the general map because developed land can include lawns, trees, exposed soil, and other surfaces that still allow water to infiltrate.
The darkest concentrations appear in the central developed cluster. Outside that area, the map is dominated by very light tones, with thin road-like lines crossing the agricultural landscape. Smaller concentrations appear in the west and southwest. The scarcity of dark areas fits the low 0.94% countywide mean: most of Lee County is not covered by dense pavement or rooftops even though developed land is present.
Comparing this image with the general land-cover map helps prevent a common misunderstanding. A developed polygon is a land-cover class, while imperviousness measures how much of the ground is actually sealed. A lightly developed area may contain houses or roads surrounded by grass, trees, fields, or bare soil. The two maps therefore answer related but different questions and should not be expected to produce identical percentages.
This map can support a general discussion of where built surfaces are concentrated, but it is not a stormwater or flood-risk model. Runoff depends on rainfall, terrain, soil, drainage systems, channels, and other conditions in addition to pavement. A dark impervious area identifies a surface characteristic; it does not by itself establish that a specific property will flood.
Only 4.11% is mapped as a different class between 1985 and 2025
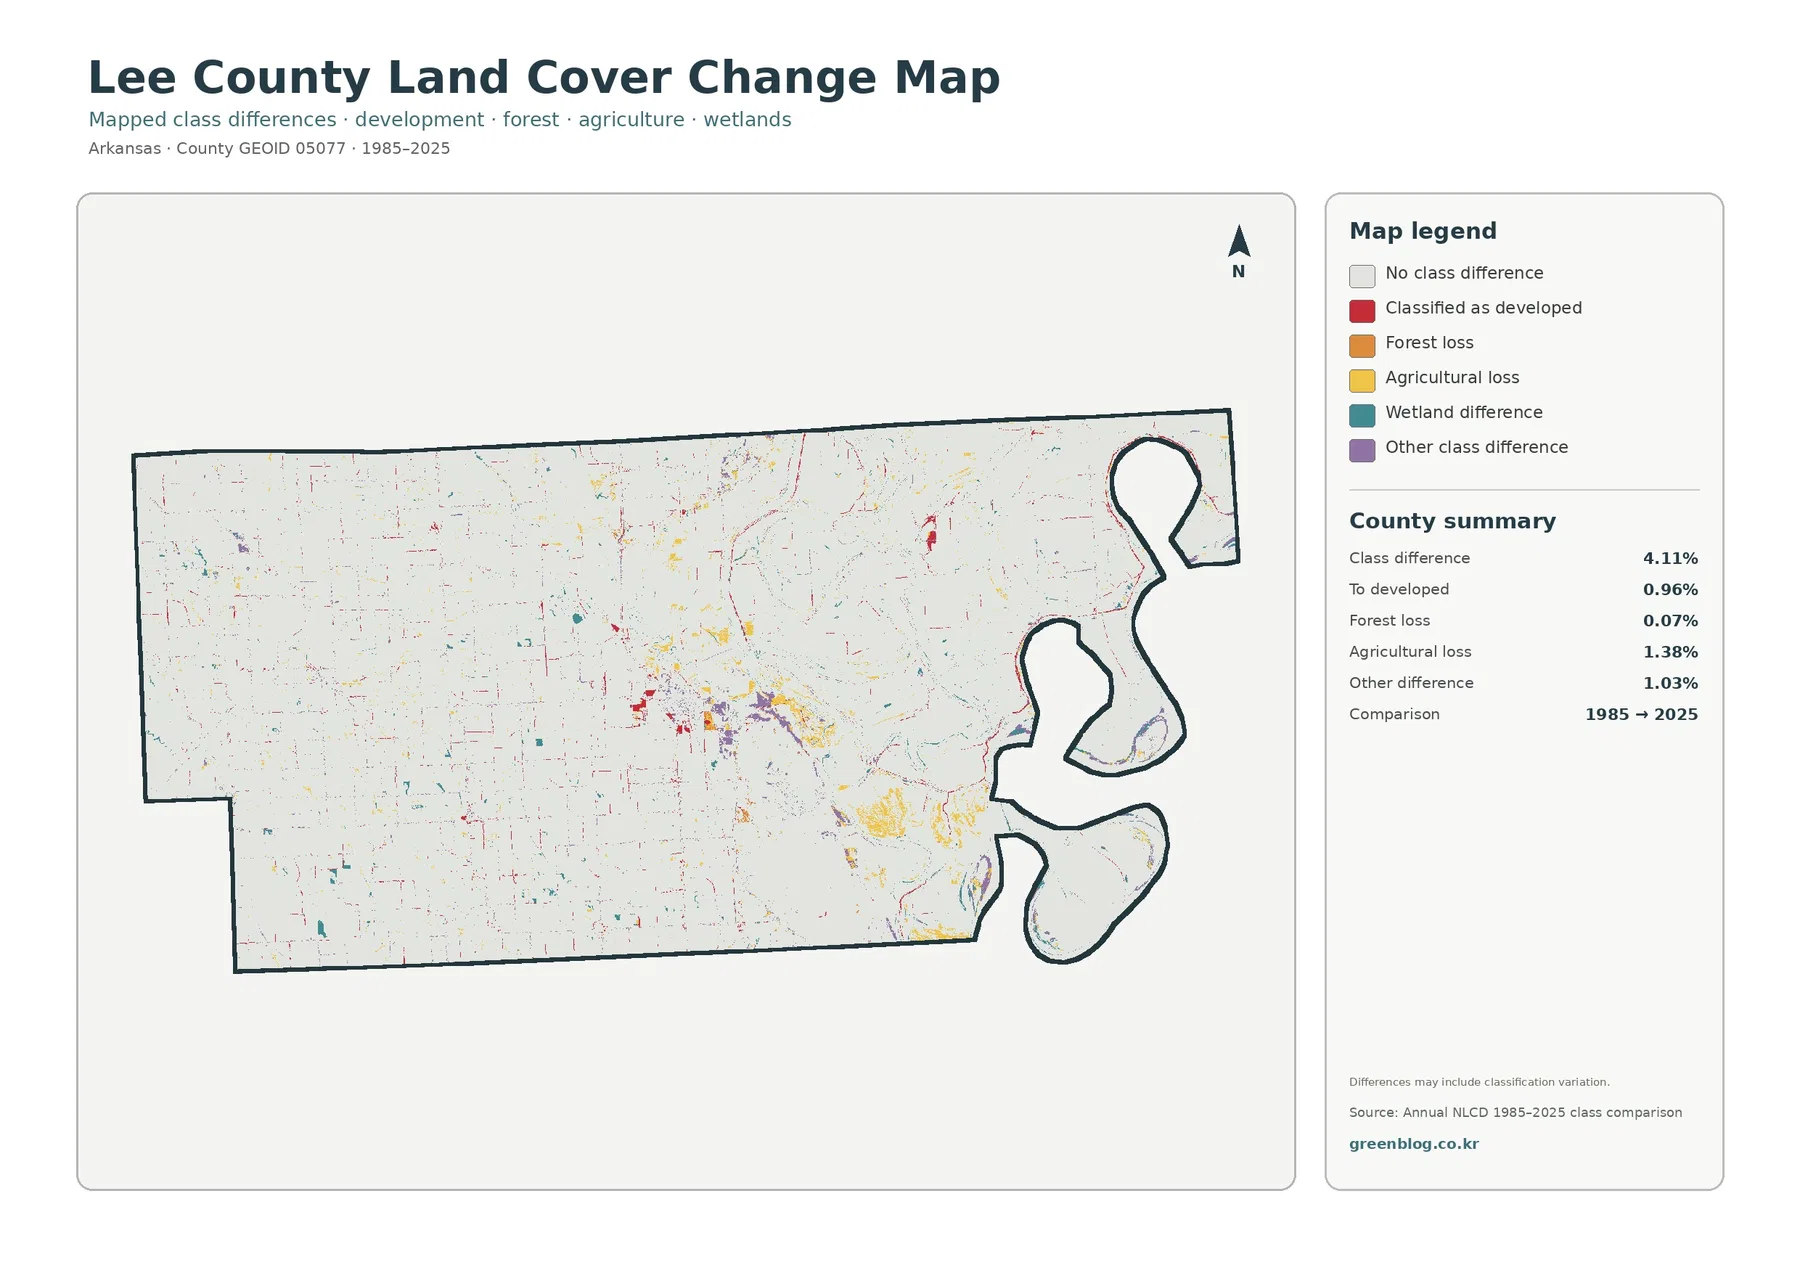
The change map is intentionally sparse. Its summary reports a total class difference of 4.11%, meaning that most of the county is mapped in the same broad land-cover class at the two comparison dates. White or nearly blank areas do not mean that nothing happened on the ground during forty years. They mean that the two endpoint classifications did not show a mapped class difference at the scale and categories used here.
The supplied summary breaks out 0.96% as mapped to developed, 0.07% as forest loss, 1.38% as agricultural loss, and 1.03% as other class difference. Wetland difference appears as its own legend color, but the summary does not list a separate exact percentage for it. Subtracting the other values from the 4.11% total would create an inferred number that the package does not explicitly provide, so this article leaves the wetland share unestimated.
The central developed area contains some of the most visible red and mixed change colors. Farther southeast, larger yellow patches mark places classified as agricultural loss, while the western agricultural expanse is mostly unchanged in this two-date comparison with smaller scattered differences. Other colors are distributed in isolated patches rather than forming one continuous countywide band.
A change label should not be treated as proof of a particular cause. Real land conversion may be involved, but differences in imagery, seasonal conditions, mixed pixels, or classification can also affect a comparison between years. If a specific location matters, the next step is to review intermediate imagery, aerial photographs, local records, and other site-specific information instead of relying on the endpoint map alone.
Use the four maps as a sequence instead of treating them as four versions of the same picture
The general land-cover map should usually come first because it establishes the countywide pattern. It shows that agriculture dominates, wetlands are extensive, forest is concentrated in a few places, and developed land forms relatively compact clusters and thin lines. Once that framework is clear, the other three maps can answer more focused questions without forcing the reader to interpret every class at once.
For vegetation and farming, the forest-and-farmland map is the strongest companion. It is particularly useful in Lee County because the southeastern forest block and eastern wetland network stand out against the broad agricultural background. A reader can follow the transition from fields to wet areas and wooded cover without the developed colors drawing as much attention.
For built surfaces, pair the general map with the impervious map. The first shows the full developed class, while the second reveals that the most heavily sealed surfaces occupy a much smaller footprint. This comparison is useful when explaining why a county can have 4.53% developed cover but a mean impervious value below one percent.
The change map belongs last because it is a two-date comparison rather than another description of 2025 conditions. It can show where classification differs from 1985, but it should not be used as the source for current percentages. Keeping current cover and historical comparison separate makes the four-map set easier to understand and prevents a 4.11% class-difference figure from being mistaken for the share of a present-day land-cover category.
Download the four original Lee County JPG maps
The download archive contains the original JPG versions of all four maps: 2025 general land cover, forest and farmland, impervious and developed land, and the 1985–2025 land-cover change comparison. According to the supplied asset manifest, each original JPG is 2480×1754 pixels. The 1800-pixel WebP images used in the article are web previews, so the JPG files are the better choice when you need the larger source image provided in this package.
Choose the file that matches the question you are trying to answer. Use the general map for the full mix of agriculture, wetlands, water, forest, and development. Use the forest-and-farmland view when vegetation and fields are the main subject. The impervious map is best for built surfaces, and the change map is reserved for comparing 1985 with 2025. Keeping those purposes separate makes legends and percentages easier to explain in presentations, worksheets, or reference material.
What this map set can show—and what requires another source
Land cover describes the physical surface visible to a classification system, not legal land use, zoning, ownership, parcel boundaries, or development rights. An agricultural pixel does not mean the parcel is legally restricted to agriculture, and a developed pixel does not identify the type of building or the property owner. Those questions require cadastral, zoning, planning, or other local records.
Annual NLCD is raster data, which means the landscape is represented as a grid of cells. A narrow road, ditch, tree line, pond edge, field border, and nearby building can fall within a small area together. The classification selects a representative surface for each cell, so fine boundaries can look simplified. This is especially important in Lee County where agricultural fields, channels, wetlands, and narrow developed features frequently meet.
The current maps use the 2025 classification supplied in the package. Construction, crop changes, vegetation growth, clearing, or water conditions after that date may not appear. The change map also compares only 1985 and 2025 endpoints; it does not document every event between them. Current site work should therefore use more recent imagery and local information when available.
The University of Arkansas System Cooperative Extension Service maintains a Lee County office in Marianna and describes its role as providing research-based information in agriculture, 4-H, family and consumer science, and community development. That county resource can provide useful local context, but it should not be used to assign a specific crop, land-management practice, or cause of change to individual pixels in these maps without additional evidence.
Frequently Asked Questions
What is the largest land-cover class in Lee County in 2025?
Agriculture is the largest class at 69.78% in the supplied county summary. Wetlands are second at 18.16%, and they are especially prominent across the eastern and central-eastern parts of the map.
Why is developed cover 4.53% while mean impervious surface is only 0.94%?
Developed land can include lawns, trees, soil, and other permeable surfaces around roads and buildings. Imperviousness measures surfaces such as pavement and rooftops more directly, so its countywide mean can be much lower than the total developed-cover share.
Does the 4.11% class difference mean exactly 4.11% of the county physically changed after 1985?
Not necessarily. Real landscape change can contribute, but imagery conditions, mixed pixels, and classification differences can also affect a two-date comparison. Use intermediate imagery and local records to investigate the cause of change at a specific location.
Map File Information
The ZIP contains four original JPG maps for Lee County: 2025 land cover, forest and farmland, impervious and developed land, and the 1985–2025 land-cover change comparison.
- Included Files: Use only the versions confirmed in the article and supplied images
- File Type: Use the confirmed download contents
- Intended Use: Printing, education, presentations, and map-based projects
Related Maps
- A Craighead County Arkansas Land Cover Map
- Arkansas County Arkansas Land Cover Map
- Ashley County Arkansas Land Cover Map
Sources and references
- MRLC Annual NLCD Data — official access to Annual NLCD land-cover datasets used for year-based land-cover reference.
- USGS Annual NLCD Land Cover Classification — official descriptions of classes such as agriculture, forest, developed land, wetlands, and water.
- U.S. Census Bureau TIGER/Line Shapefiles — official geographic boundary data for U.S. counties, including Lee County.
- Lee County Cooperative Extension Service — University of Arkansas System Extension information for the Lee County office in Marianna and its local programs.
Green Map creates custom-edited map images using open geographic data sources such as geoBoundaries, Natural Earth, OpenStreetMap, and government open data.
These maps are edited visual materials, not raw data files, and are provided for education, documents, presentations, and graphic reference.