Garland County Arkansas Land Cover Map data for 2025 shows a county where forest is the dominant surface, but water and urban development create two strong counterpoints. Forest accounts for 66.41% of the county. A large western water body stands out inside that wooded setting, while the Hot Springs area in the south-central part of the county forms the broadest concentration of developed land. Those contrasts make Garland County especially useful for comparing natural cover with a compact urban footprint.
Four views are provided here: general land cover, forest and farmland, impervious surface with developed land, and a 1985–2025 class comparison. The four original JPGs are available together in one download at the end of the page. Each source image is 2480×1754 pixels. The general layer works well for a quick county overview, while the other three help separate rural cover, hard urban surfaces, and long-term mapped differences without changing the county boundary.
Table of Contents
Forest covers nearly two-thirds of the county in 2025
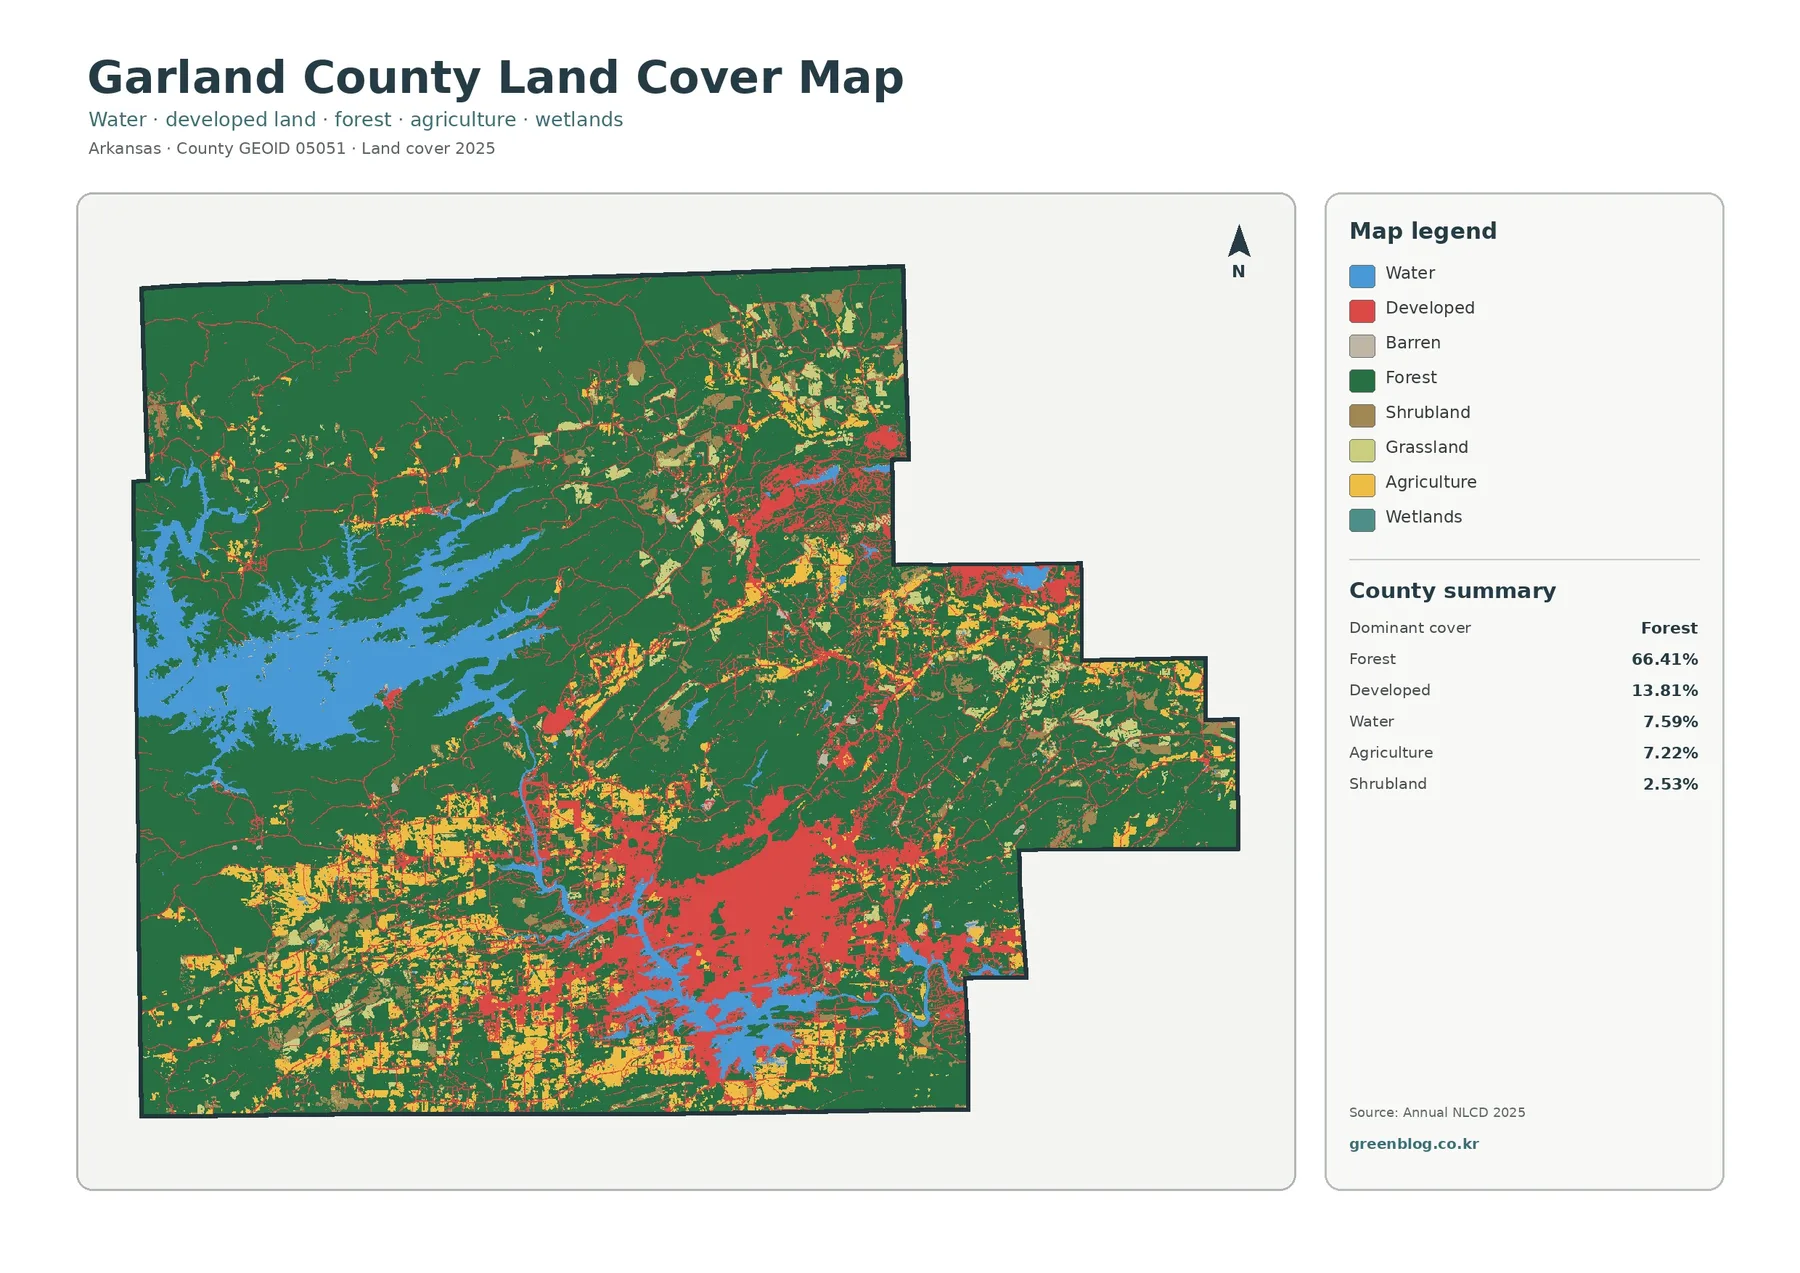
Forest is the largest 2025 class at 66.41%. Developed land follows at 13.81%, water at 7.59%, agriculture at 7.22%, and shrubland at 2.53%. The percentages establish the overall balance, but the countywide image adds an important spatial detail: these classes are not spread evenly. Broad forest blocks dominate much of the west and north, while the south-central area has a more complicated mixture of development, open cover, water, and smaller forest patches.
The large blue area in the western part of the county aligns with Lake Ouachita. The U.S. Army Corps of Engineers describes Lake Ouachita as a reservoir in the Ouachita Mountains west of Hot Springs. On the countywide image, water forms a clear edge against surrounding forest and gives the western half a very different appearance from the more developed south-central area. The 7.59% water figure includes mapped water across the county, so not every blue cell should be treated as part of a single lake.
Hot Springs National Park adds useful local context to the forest pattern. The National Park Service describes the park and surrounding mountains as part of a pine-oak-hickory forest ecosystem and places the park in Hot Springs, Garland County. The land-cover image does not draw the park boundary, so green pixels cannot be labeled as parkland simply because they are near the city. What can be said directly is that extensive forest reaches close to the county’s largest developed concentration.
Hot Springs is much more distinct in the impervious-surface layer
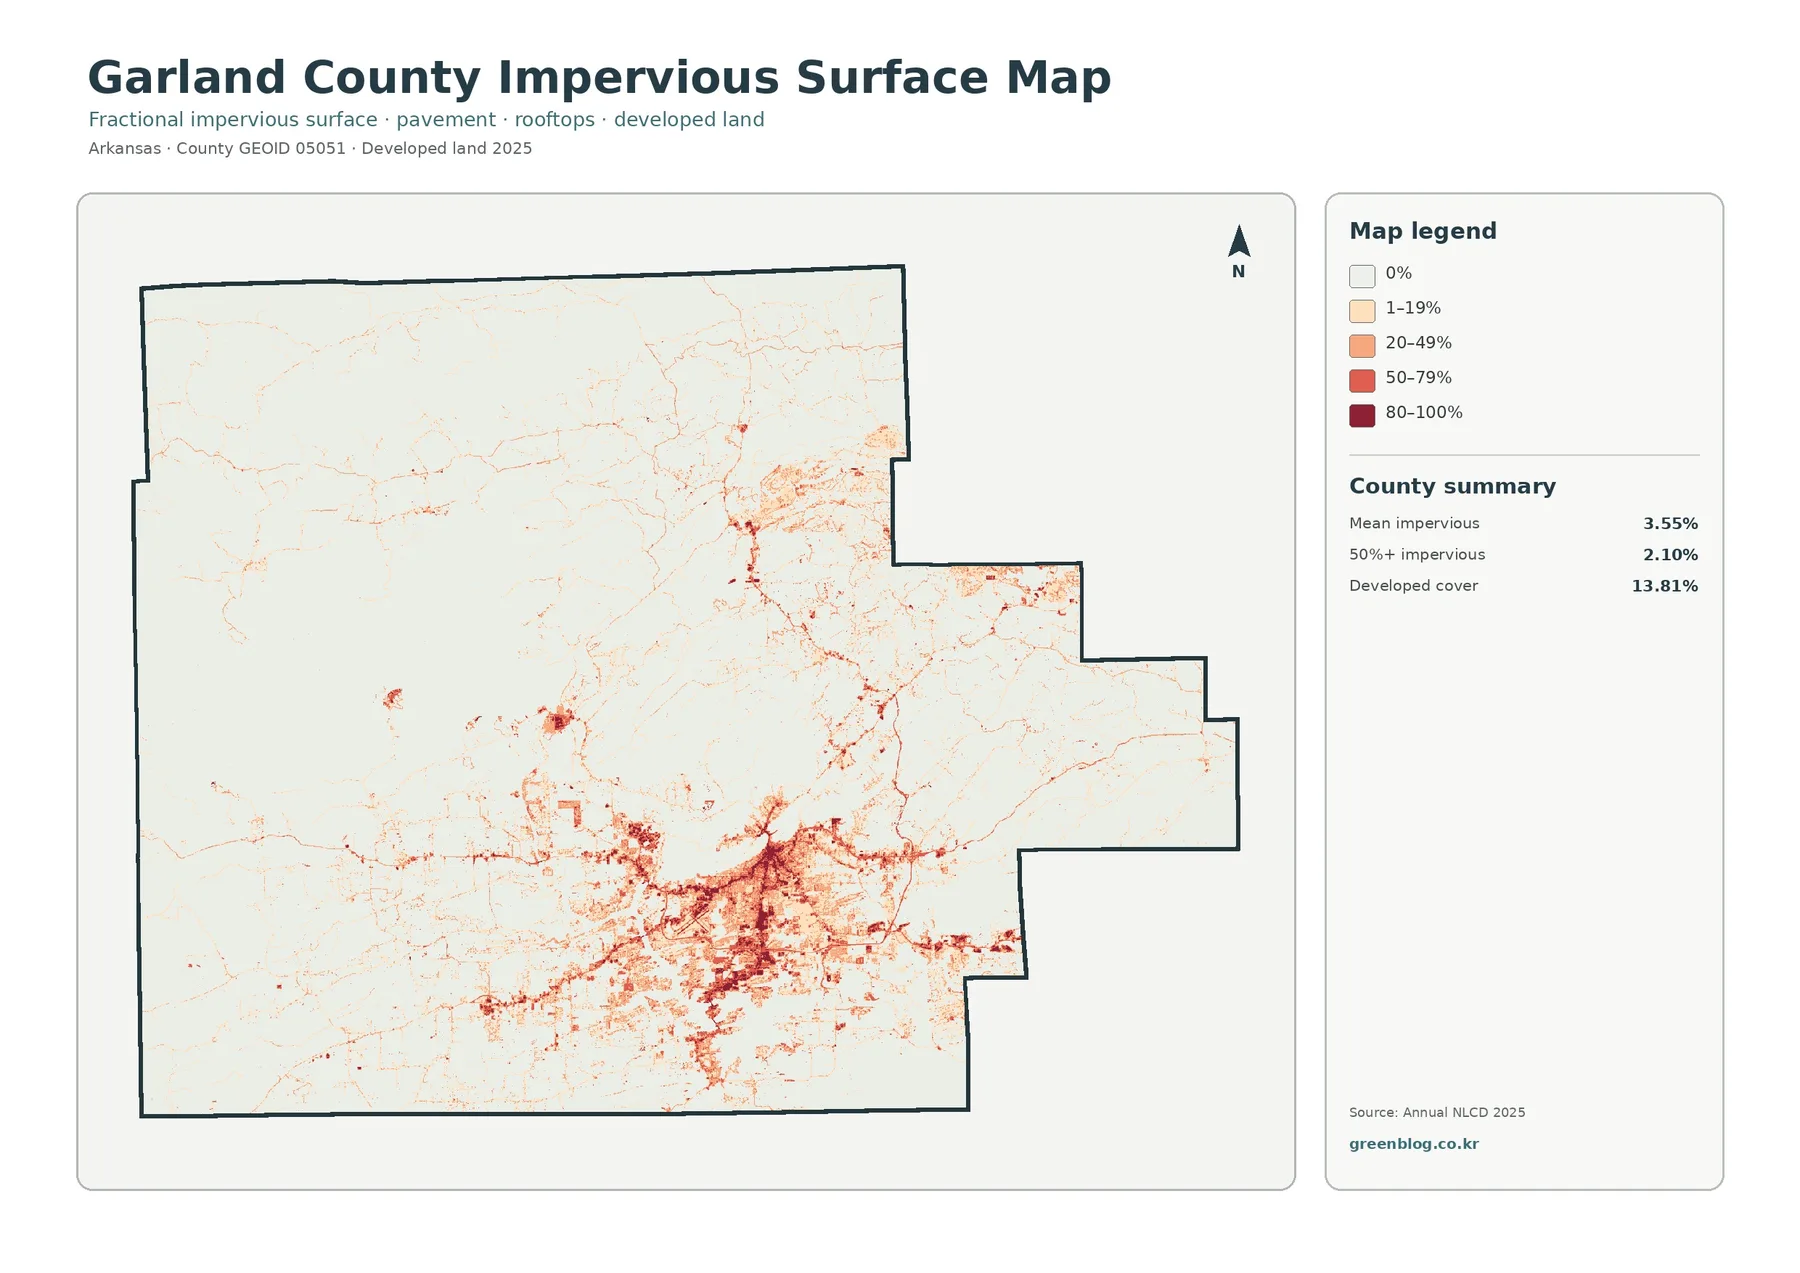
Impervious surface means pavement, rooftops, parking areas, and other surfaces that do not readily absorb rainfall. Garland County’s mean impervious value is 3.55%, and 2.10% of the county is mapped at 50% impervious or greater. Those figures are much lower than the 13.81% developed-cover share because a developed land-cover class can also contain lawns, trees, soil, and other permeable surfaces.
The south-central Hot Springs area forms the darkest and largest cluster. Dense patches merge into a wider web of thinner lines, creating a pattern that is consistent with streets, buildings, and other hard surfaces occurring together. Smaller clusters appear farther north and northeast, but they are more isolated. Western lake and forest areas remain mostly pale. That contrast makes the impervious layer more useful than the general layer when the question is not simply where development exists, but where hard surfaces are most concentrated.
Local planning sources are helpful when this pattern needs more context. The City of Hot Springs planning program addresses land use and development, and its environmental actions identify steep slopes, floodplains, riparian areas, open space, and other sensitive landscapes as planning considerations. The impervious image itself does not measure drainage capacity, traffic, building count, or flood risk. It should therefore be used as a surface-cover reference rather than a substitute for engineering or zoning records.
The rural layer separates forest from smaller agricultural and open areas
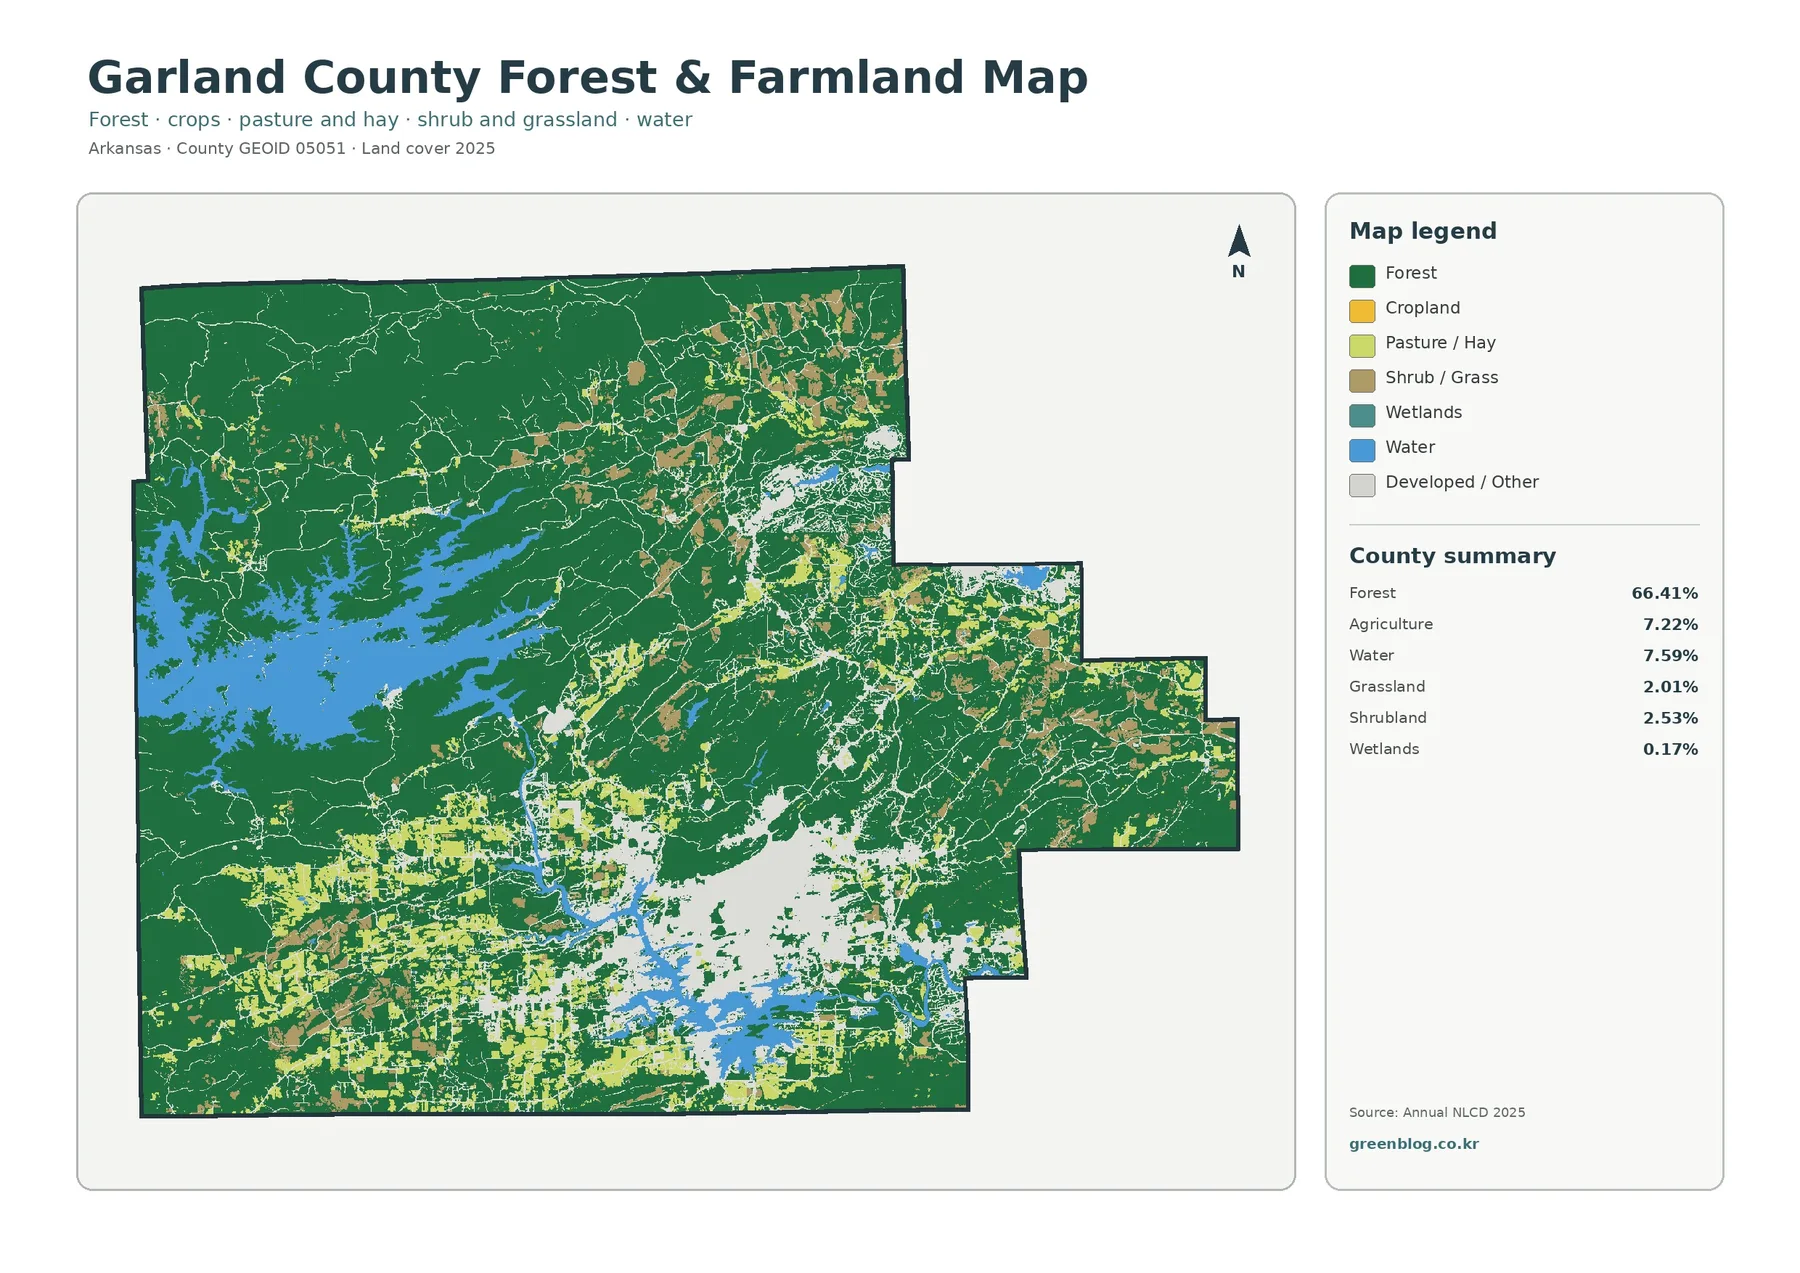
Removing the detailed developed colors changes what stands out. Forest still covers 66.41%, agriculture 7.22%, and water 7.59%, while grassland is 2.01%, shrubland 2.53%, and wetlands 0.17%. The simplified view makes the continuity of the western and northern forest easier to follow. It also reveals where agricultural, grass, and shrub classes break that continuity in the south, northeast, and several smaller interior patches.
Agriculture in Garland County does not form the broad, nearly continuous field pattern seen in many Delta counties. Here it occurs as a set of lighter patches within a heavily wooded landscape. South and southwest of the main Hot Springs concentration, agriculture and open cover become more common, while the large western reservoir remains bordered by extensive forest. The northeast also contains a noticeable mixture of forest and lighter rural classes rather than a single dominant block.
These categories describe surface cover, not legal land use. An agricultural pixel does not identify a crop, farm ownership, parcel boundary, or zoning designation. Likewise, forest pixels may represent public or private land. This distinction matters around Hot Springs and the lakes, where recreation areas, residences, forest, and open land can occur close together. Parcel and planning records are needed for ownership or development decisions; the land-cover layer is better suited to county-scale comparison.
The 1985–2025 comparison records 26.92% overall class difference
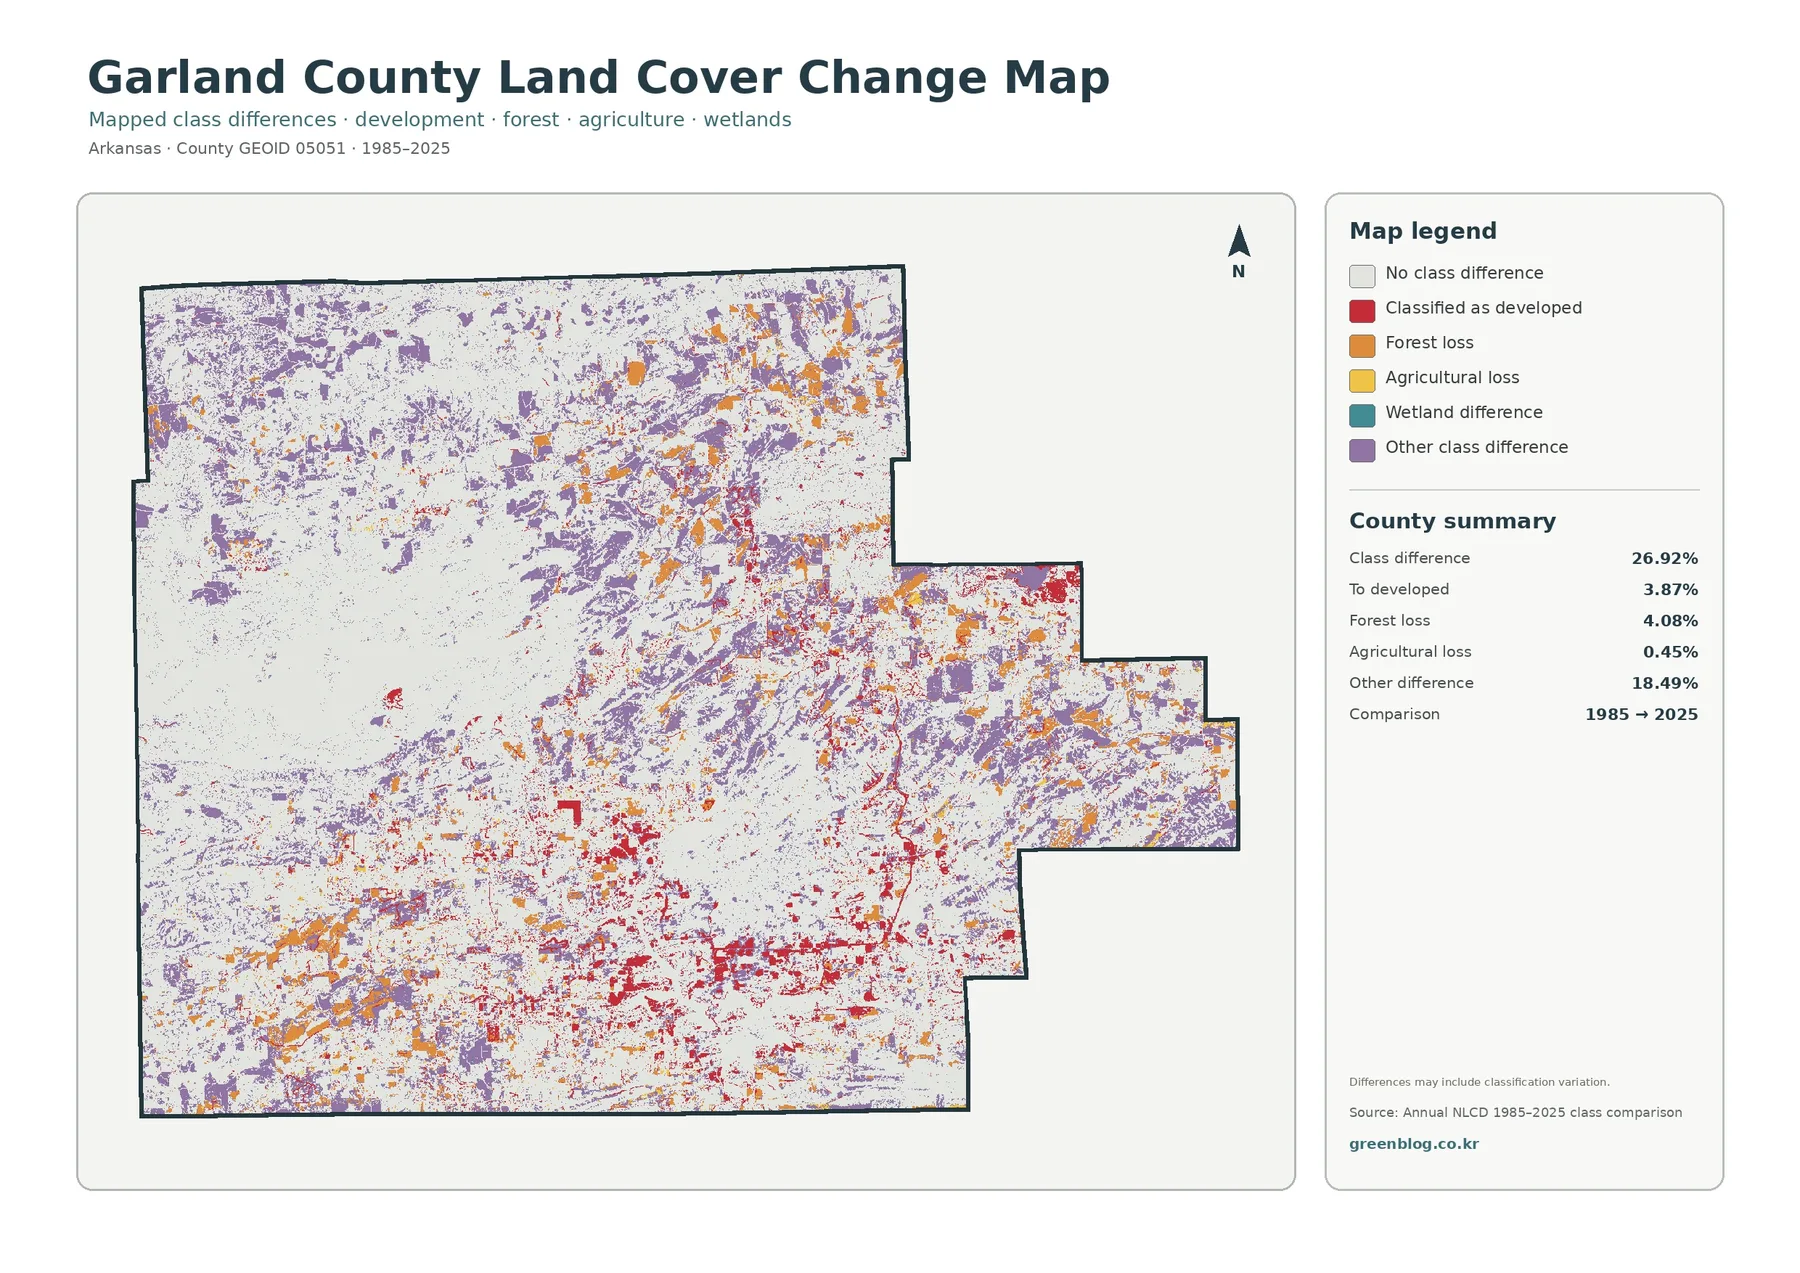
The change layer compares the class assigned to each location in 1985 with the class assigned in 2025. Garland County’s overall class-difference figure is 26.92%. The summary separates 3.87% as change to developed land, 4.08% as forest loss, 0.45% as agricultural loss, and 18.49% as other class difference. Wetland difference is also represented in the legend. The total therefore cannot be described as a development rate or a single type of land conversion.
Red change-to-developed marks are most noticeable around the present Hot Springs footprint and across several connected south-central corridors. Smaller red marks occur elsewhere, including parts of the north-central and eastern county. Orange forest-loss areas appear across a much wider range, including forest edges in the north and east and mixed-cover zones farther south. Purple other differences are especially widespread, which is consistent with their 18.49% share of the countywide comparison.
A forest-loss cell means that the location was classified as forest in 1985 and as another class in 2025. It does not identify the final class by itself. Agricultural loss should be read in the same way. To learn whether a particular area became development, grassland, water, or another category, an intermediate-year Annual NLCD series or historical aerial imagery would be needed. The two-date image is a useful screening tool, not a complete land-history record.
Classification variation can also contribute to small differences. Annual NLCD is a raster product, meaning the landscape is represented by grid cells rather than parcel outlines. A cell near a forest-road edge, shoreline, lawn, or mixed neighborhood can contain more than one surface type. Its representative class can change between dates without a simple one-to-one event on the ground. Broad clusters are therefore more informative than isolated pixels when the image is used at county scale.
Water and forest provide useful reference points for county comparisons
Lake Ouachita is a practical orientation feature because its broad western water shape is easy to recognize. Starting there, a reader can follow the surrounding forest eastward toward the more mixed interior and then into the Hot Springs developed concentration. That sequence makes it easier to describe why a county with 66.41% forest can still have a visibly strong urban core and 13.81% developed cover.
The current layers also answer different questions. General land cover is best for the overall mix. The forest-and-farmland view clarifies rural cover, while impervious surface isolates the harder fraction of development. The 1985–2025 comparison is most useful after the current pattern is understood, because today’s forest blocks and developed centers provide context for orange and red change marks. None of the four should be treated as a parcel survey or a legal land-use document.
Hot Springs National Park illustrates why that distinction matters. The National Park Service documents forested mountains and natural resources within and around the park, yet the land-cover image does not include the park boundary. Green areas near Hot Springs can therefore be described as forest cover, but not automatically as national park property. The same caution applies to lake shorelines, private parcels, and other protected or managed lands.
Scale, date, and original image size set practical limits
Countywide raster classification is designed for broad comparison. Narrow roads, isolated buildings, small coves, complex shorelines, and boundaries between lawns and forest can be generalized. Mixed pixels are especially important in the Hot Springs area, where trees, roofs, pavement, and grass may occur within a short distance, and along reservoir edges where land and water meet in narrow coves.
The current land-cover and impervious products are labeled 2025. Construction, clearing, vegetation changes, or shoreline changes after that observation period may not appear. The comparison layer uses 1985 and 2025 as its two endpoints, so it does not show every temporary or intermediate change during those four decades. Recent aerial imagery, local planning records, parcel data, and field checks should be added when the decision depends on current site conditions.
Each source JPG is 2480×1754 pixels. The package identifies that as the original source size and does not mark the files as meeting an A3 high-resolution reference. Keeping the originals at their supplied dimensions avoids artificial enlargement. The WebP versions are convenient for page browsing, while the JPG files preserve the full source image supplied for worksheets, reports, presentations, and side-by-side county comparisons.
Download the four Garland County JPG files
The ZIP contains one JPG for general 2025 land cover, one for forest and farmland, one for impervious surface and developed land, and one for the 1985–2025 class comparison. All four use the same Garland County boundary, which makes them easy to compare without changing the geographic frame.
Frequently Asked Questions
What is the largest 2025 land-cover class in Garland County?
Forest is the largest class at 66.41%. Developed land is 13.81%, water 7.59%, agriculture 7.22%, and shrubland 2.53%. Forest is extensive across much of the county, while Hot Springs forms the most prominent developed concentration.
Why is developed cover 13.81% when mean impervious surface is 3.55%?
Developed land can include trees, lawns, soil, and other permeable surfaces in addition to roads, rooftops, and pavement. The impervious layer measures only the harder fraction that resists infiltration. In Garland County, 2.10% of the county is mapped at 50% impervious or greater.
Does the 26.92% class difference mean that 26.92% became developed?
No. The 26.92% figure includes every location assigned a different mapped class in 1985 and 2025. Only 3.87% is specifically categorized as change to developed land. Forest loss, agricultural loss, wetland differences, other class differences, and some classification variation are also part of the comparison.
Map File Information
The archive contains the four original Garland County land-cover JPG files described on this page.
- Included Files: land cover, forest and farmland, impervious/developed land, and 1985–2025 land-cover change
- File Type: four JPG images in one ZIP archive
Related Maps
- A Craighead County Arkansas Land Cover Map
- Arkansas County Arkansas Land Cover Map
- Ashley County Arkansas Land Cover Map
Sources and reference material
- MRLC Annual NLCD Data – official access to current and historical Annual NLCD products.
- USGS Annual NLCD Land Cover Classification – definitions for developed, forest, agriculture, water, wetlands, and other classes.
- Hot Springs National Park Nature & Science – official information on the forested mountains and natural resources around Hot Springs in Garland County.
- U.S. Army Corps of Engineers – Lake Ouachita – official location and management information for Lake Ouachita west of Hot Springs.
- City of Hot Springs – Action: Environment – local planning context for slopes, floodplains, riparian areas, open space, and other environmental features.
Green Map creates custom-edited map images using open geographic data sources such as geoBoundaries, Natural Earth, OpenStreetMap, and government open data.
These maps are edited visual materials, not raw data files, and are provided for education, documents, presentations, and graphic reference.