Grant County Arkansas Land Cover Map data for 2025 presents a county where forest and wetlands dominate the surface, while developed land remains concentrated in a few compact areas. Forest accounts for 48.37% of the county and wetlands for 27.19%, with grassland, developed land, agriculture, shrubland, and water making up smaller shares. The four views on this page help separate those broad patterns from farmland, impervious surfaces, and mapped differences between 1985 and 2025.
The four original JPG maps are available together in one download for classroom work, reports, regional comparisons, presentations, and general reference. They should be read as land-cover maps rather than parcel or zoning maps: the colors describe what covers the ground, not who owns a property or what can legally be built there. Starting with the countywide pattern and then moving into each specialized view makes the set easier to use.
Table of Contents
Forest and Wetlands Set the Countywide Pattern
The 2025 summary is unusual enough that the percentages immediately help frame the map. Forest is the largest category at 48.37%, followed by wetlands at 27.19%. Grassland represents 7.55%, developed land 6.35%, and agriculture 5.79%. The forest-and-farmland view also reports 4.31% shrubland and 0.28% water. Those numbers do not describe every part of the county equally. Instead, they establish a countywide balance that becomes much more informative when paired with the location of each color.
Grant County’s official website describes a rural county of rolling, pine-covered hills and identifies Sheridan as the county seat. It also highlights the Saline River as part of the county’s outdoor landscape. That local description provides useful context for the extensive green and wetland-colored areas in the supplied maps without turning the classification into a forestry inventory. The forest class does not identify tree species, ownership, harvest status, or management practice.
Open land appears in a more fragmented pattern. Agriculture is only 5.79% countywide, but several local patches are large enough to stand out, especially where farmland and grassland meet forest edges. Grassland adds another 7.55%, so a reader interested in open rural land should not look at the agriculture percentage alone. The two classes together help explain why some parts of the county look noticeably more open even though forest remains the dominant single category.
Sheridan, Rural Communities, and Timber Country Add Useful Context
A land-cover map becomes more understandable when it is connected to known local geography without forcing details that the image does not label. Grant County’s official website names Sheridan as the county seat and describes the county as rural with pine-covered hills. The University of Arkansas Extension office serves Sheridan, Prattsville, Poyen, Leola, Tull, and other communities. Those references help explain why the impervious layer contains one strong central concentration plus smaller rural clusters rather than a single continuous urban field.
The county is also closely associated with timber. The official county description and the Encyclopedia of Arkansas both emphasize forestry and timber as part of Grant County’s landscape and economy. That background is consistent with the 48.37% forest share, but it does not mean every mapped forest pixel is commercial timberland. Public land, private woodland, riparian forest, young stands, and other wooded settings can all fall within a broad land-cover forest category.
The Saline River is another useful reference because it passes through Grant County and is highlighted by local sources. Broad wetland corridors on the map can be discussed in relation to the county’s river and drainage landscape, while keeping the distinction between a named water feature and a classified wetland cell. If a project requires the exact location of the Saline River, creeks, or floodplain boundaries, a dedicated hydrography or floodplain layer should be added.
Impervious Surfaces Stay Concentrated Around the Central Core
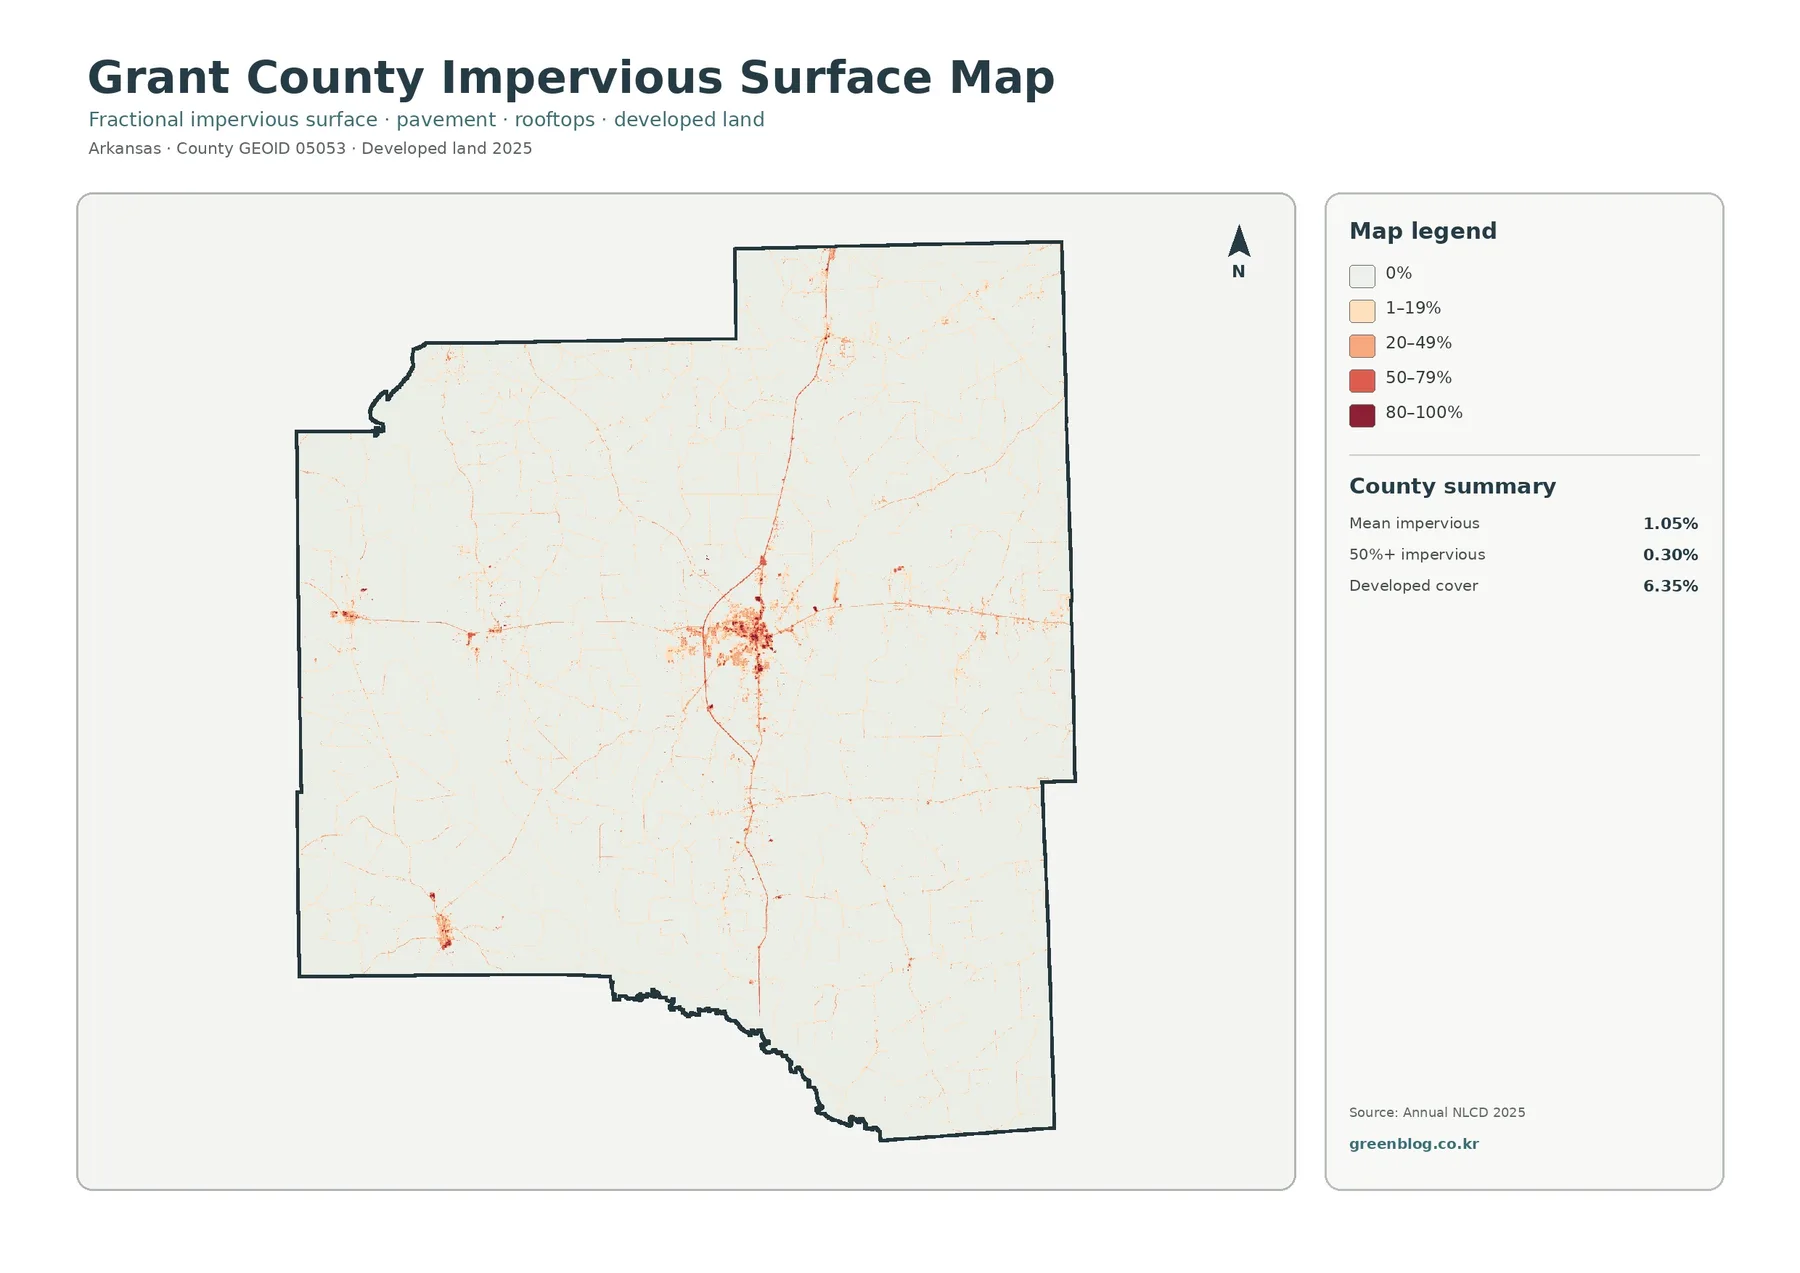
Impervious surface means pavement, rooftops, parking areas, and other surfaces that resist water infiltration. Grant County’s mean impervious value is 1.05%, and only 0.30% of the mapped area falls in cells with at least 50% impervious cover. Developed land covers 6.35%, which is a different measure. A developed class can include lawns, trees, vacant ground, and other pervious surfaces, so it is normal for developed cover to exceed the countywide mean impervious percentage.
The strongest impervious concentration is near the center of the county. Thin lines extend outward from that cluster, and a few smaller concentrations appear elsewhere, including the western and southwestern portions of the map. This layout is more consistent with a rural county containing compact towns and transportation corridors than with a continuously urbanized landscape. The image is particularly helpful when a general land-cover view makes the developed class look broader than the truly hard-surfaced footprint.
For watershed lessons or stormwater context, the impervious layer can be paired with the wetland pattern from the general map. It can show where hard surfaces are concentrated relative to extensive wet areas, but it does not calculate runoff, flood depth, drainage capacity, or risk. Those questions need elevation, soils, drainage infrastructure, streamflow, and floodplain information in addition to land cover.
Forest and Farmland Become Easier to Compare
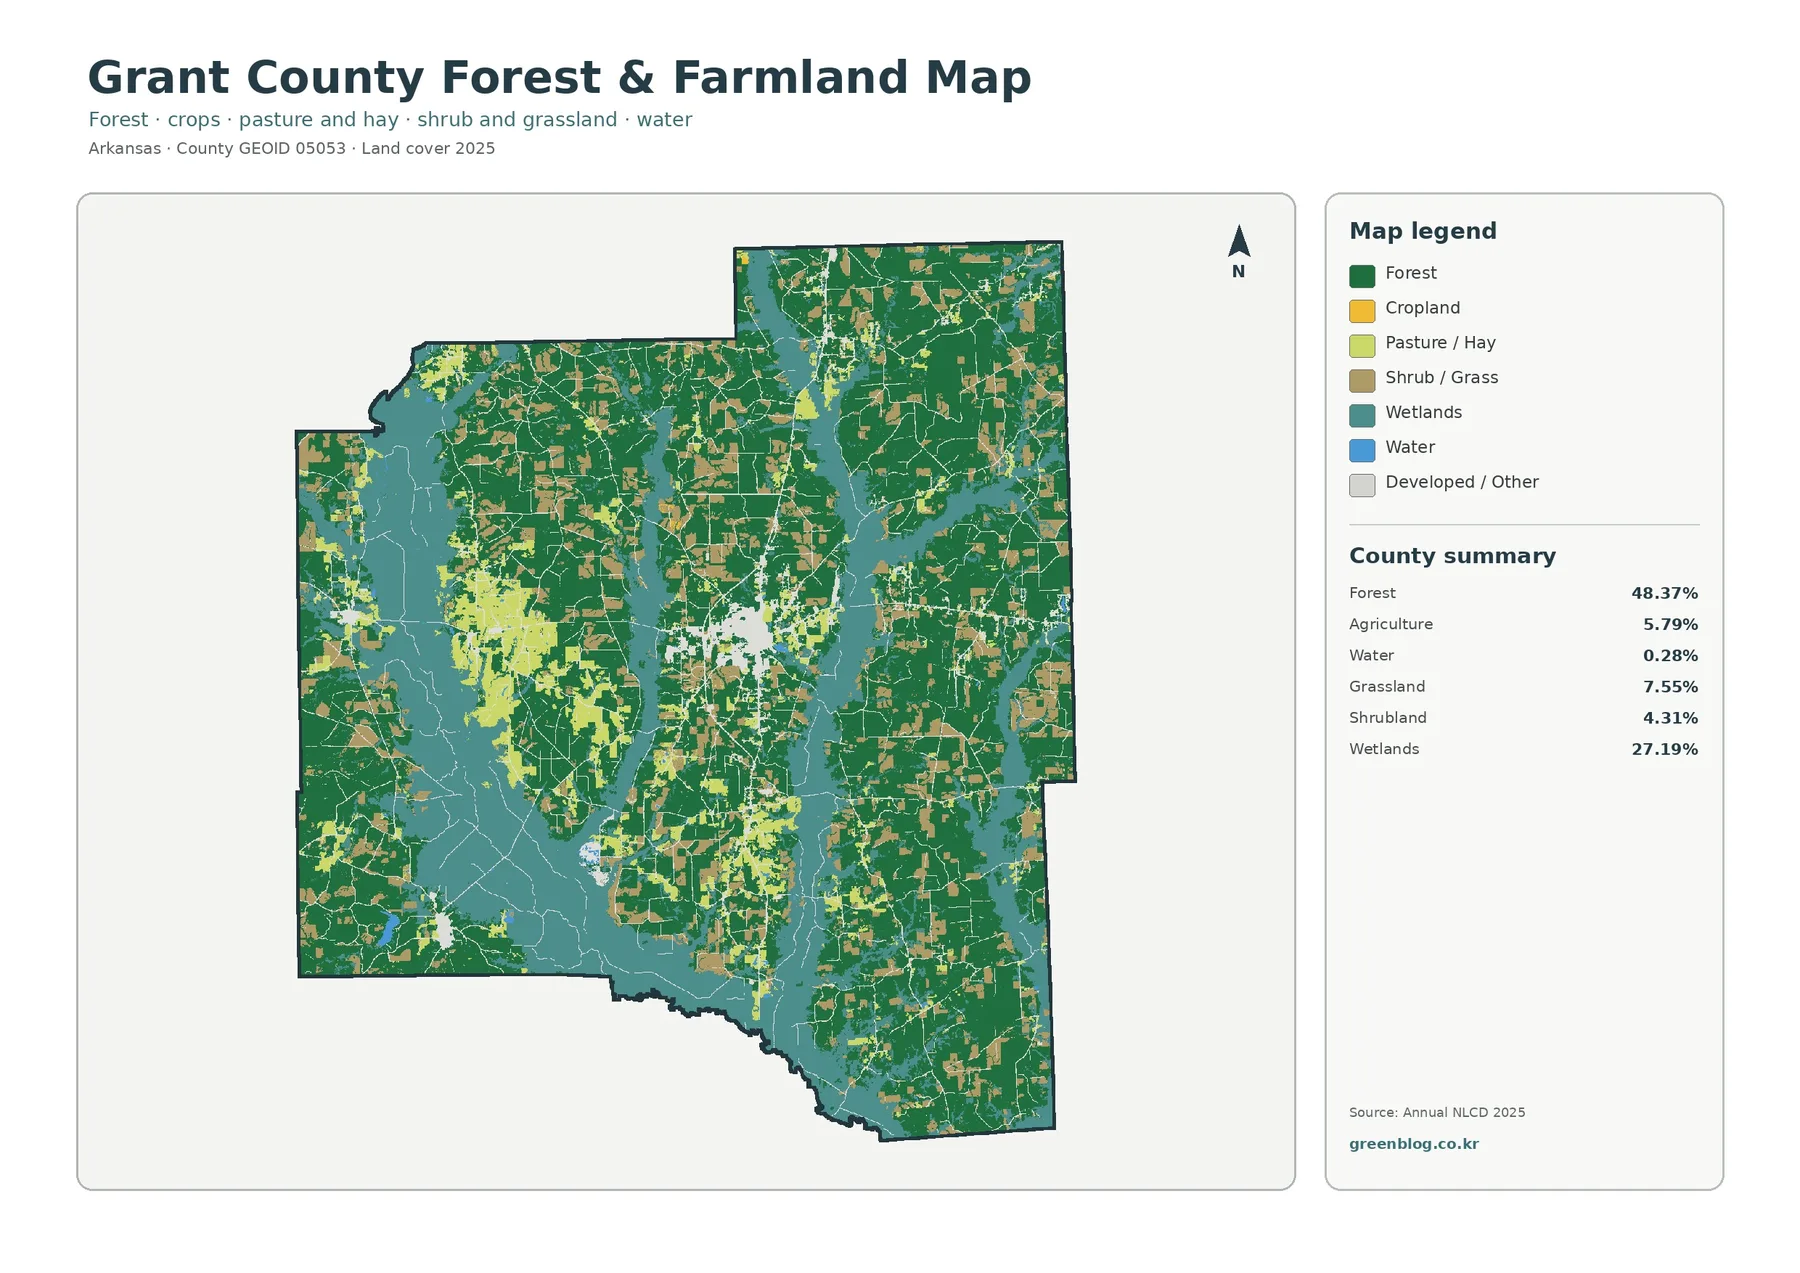
Reducing the legend to forest, cropland, pasture or hay, shrub and grassland, wetlands, water, and developed or other surfaces makes the rural pattern easier to compare. Forest still provides the largest continuous cover, while open land appears in clusters and smaller clearings. A broad open area in the west-central part of the county is especially noticeable against the surrounding forest, and smaller openings repeat through the east and south.
The agricultural share should be interpreted together with grassland and shrubland. Cropland alone does not represent every pasture, hay field, or open rural surface. That distinction matters in Grant County because the University of Arkansas System Cooperative Extension Service provides local assistance with livestock, pasture management, soil testing, horticulture, and other agricultural topics. The map cannot identify a crop or grazing practice, but it can help a reader locate the general settings where open land is more common.
Forest edges are also clearer in this version. Some boundaries between green forest and open classes are smooth, while others are highly broken into small pieces. That difference can be useful for habitat discussions, landscape comparison, or a classroom exercise on fragmentation. It is not enough, however, to determine habitat quality or forest condition. Those questions require field observations, species data, ownership information, and more detailed ecological sources.
The 2025 Cover View Shows Broad Wet Corridors
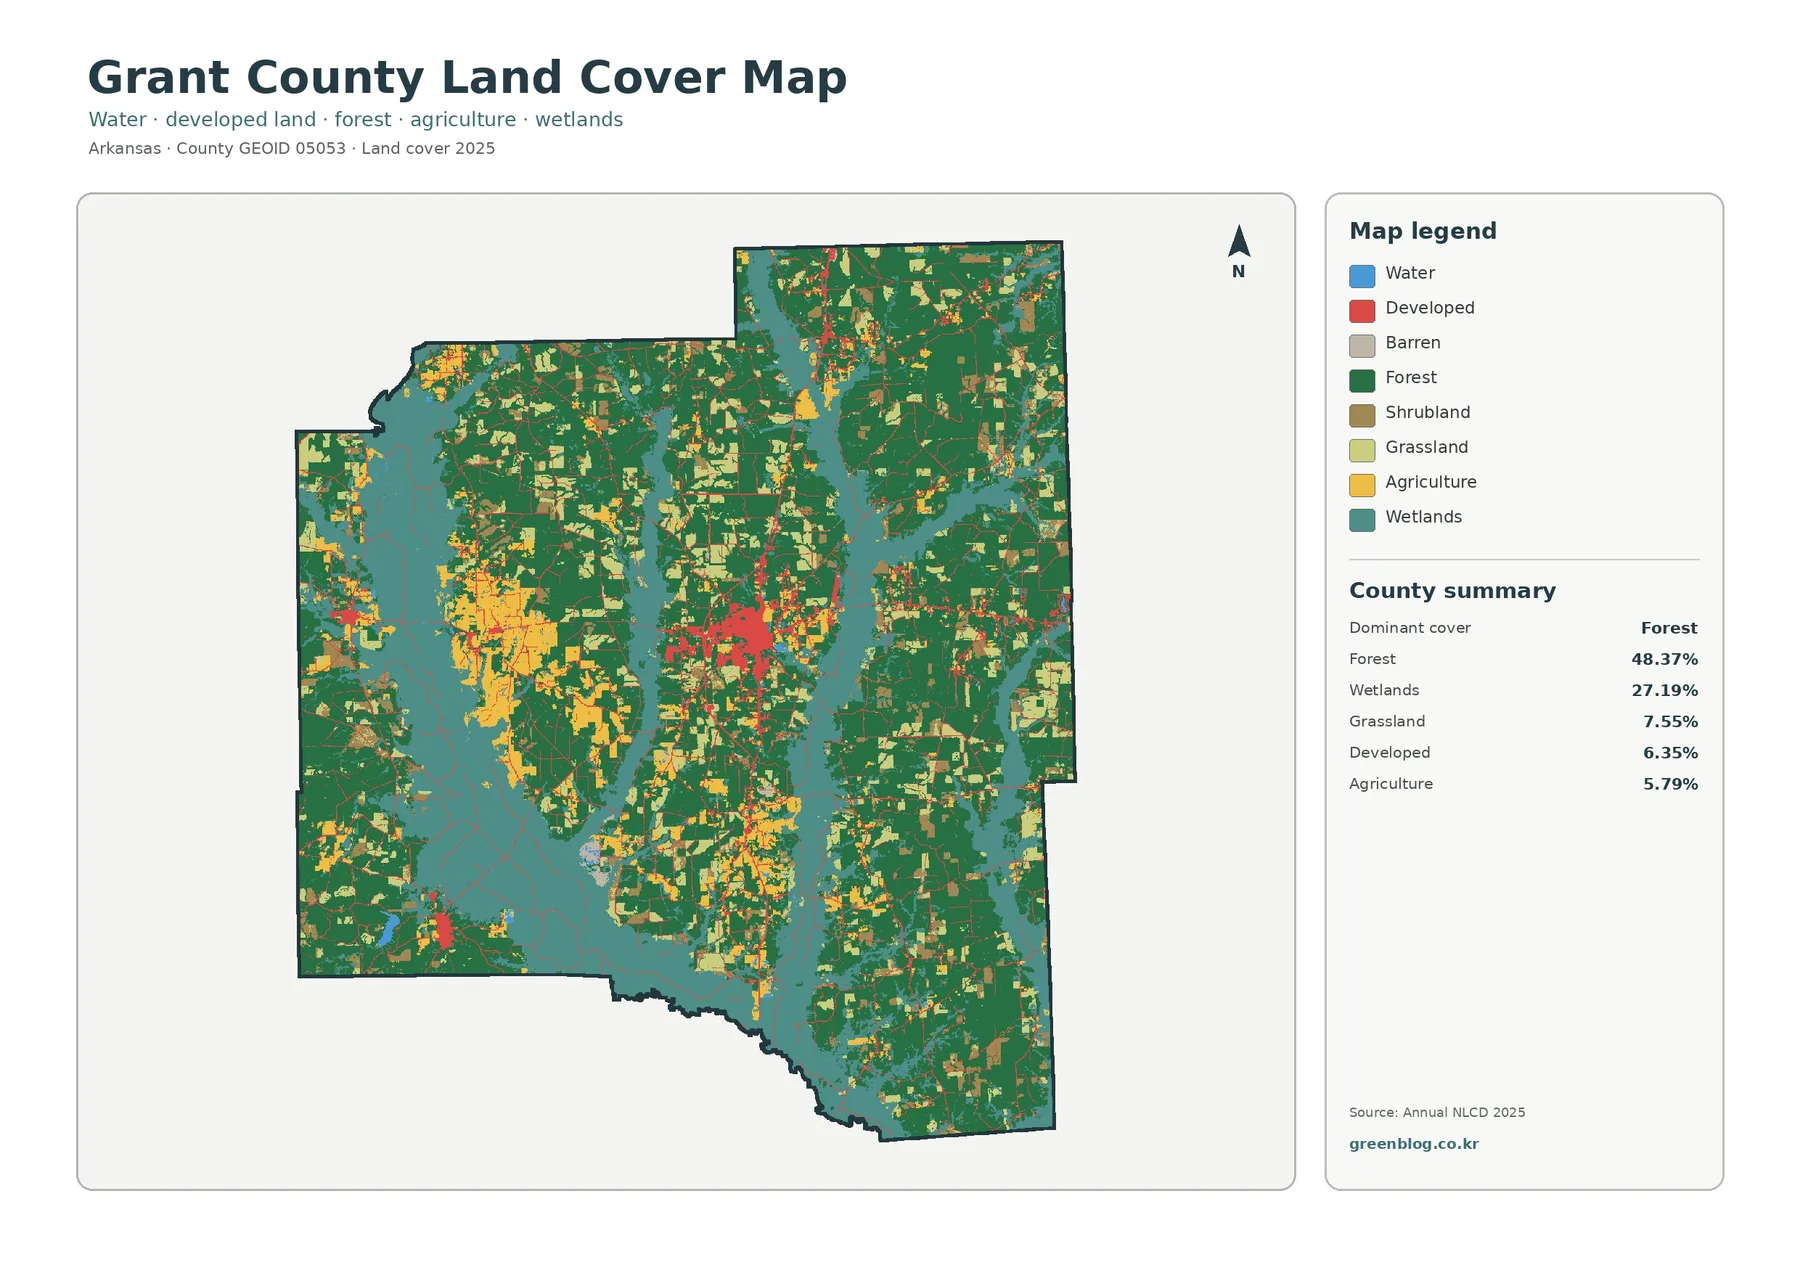
Across the general cover view, green forest occupies large blocks in the north, east, southeast, and parts of the west. Wetlands form wide, branching bands through several sections of the county rather than appearing as one isolated patch. Agriculture and grassland interrupt those forested and wet areas with brighter open-land colors. The result is a complex rural mosaic rather than a simple split between one forest zone and one farming zone.
Developed land is visually different because it is concentrated. The strongest red cluster sits near the central part of the county, with smaller patches and thin linear traces extending away from it. Sheridan is the county seat and the main local service center, so the central concentration is a useful reference for understanding the Sheridan area. The map itself does not label individual streets or parcel boundaries, and it should not be used to define the exact edge of a community.
Wetlands deserve separate attention because 27.19% is a large share of the county. Their map pattern follows low, branching corridors and broad bottomland-like areas between forest blocks. The county’s official description of the Saline River supports the importance of water-related landscapes in Grant County, but the supplied land-cover view does not label every river or creek. It is safest to use the wetland color to identify broad surface-cover patterns and consult hydrography data when a named stream is required.
Mapped Differences from 1985 to 2025 Are Widespread but Mixed
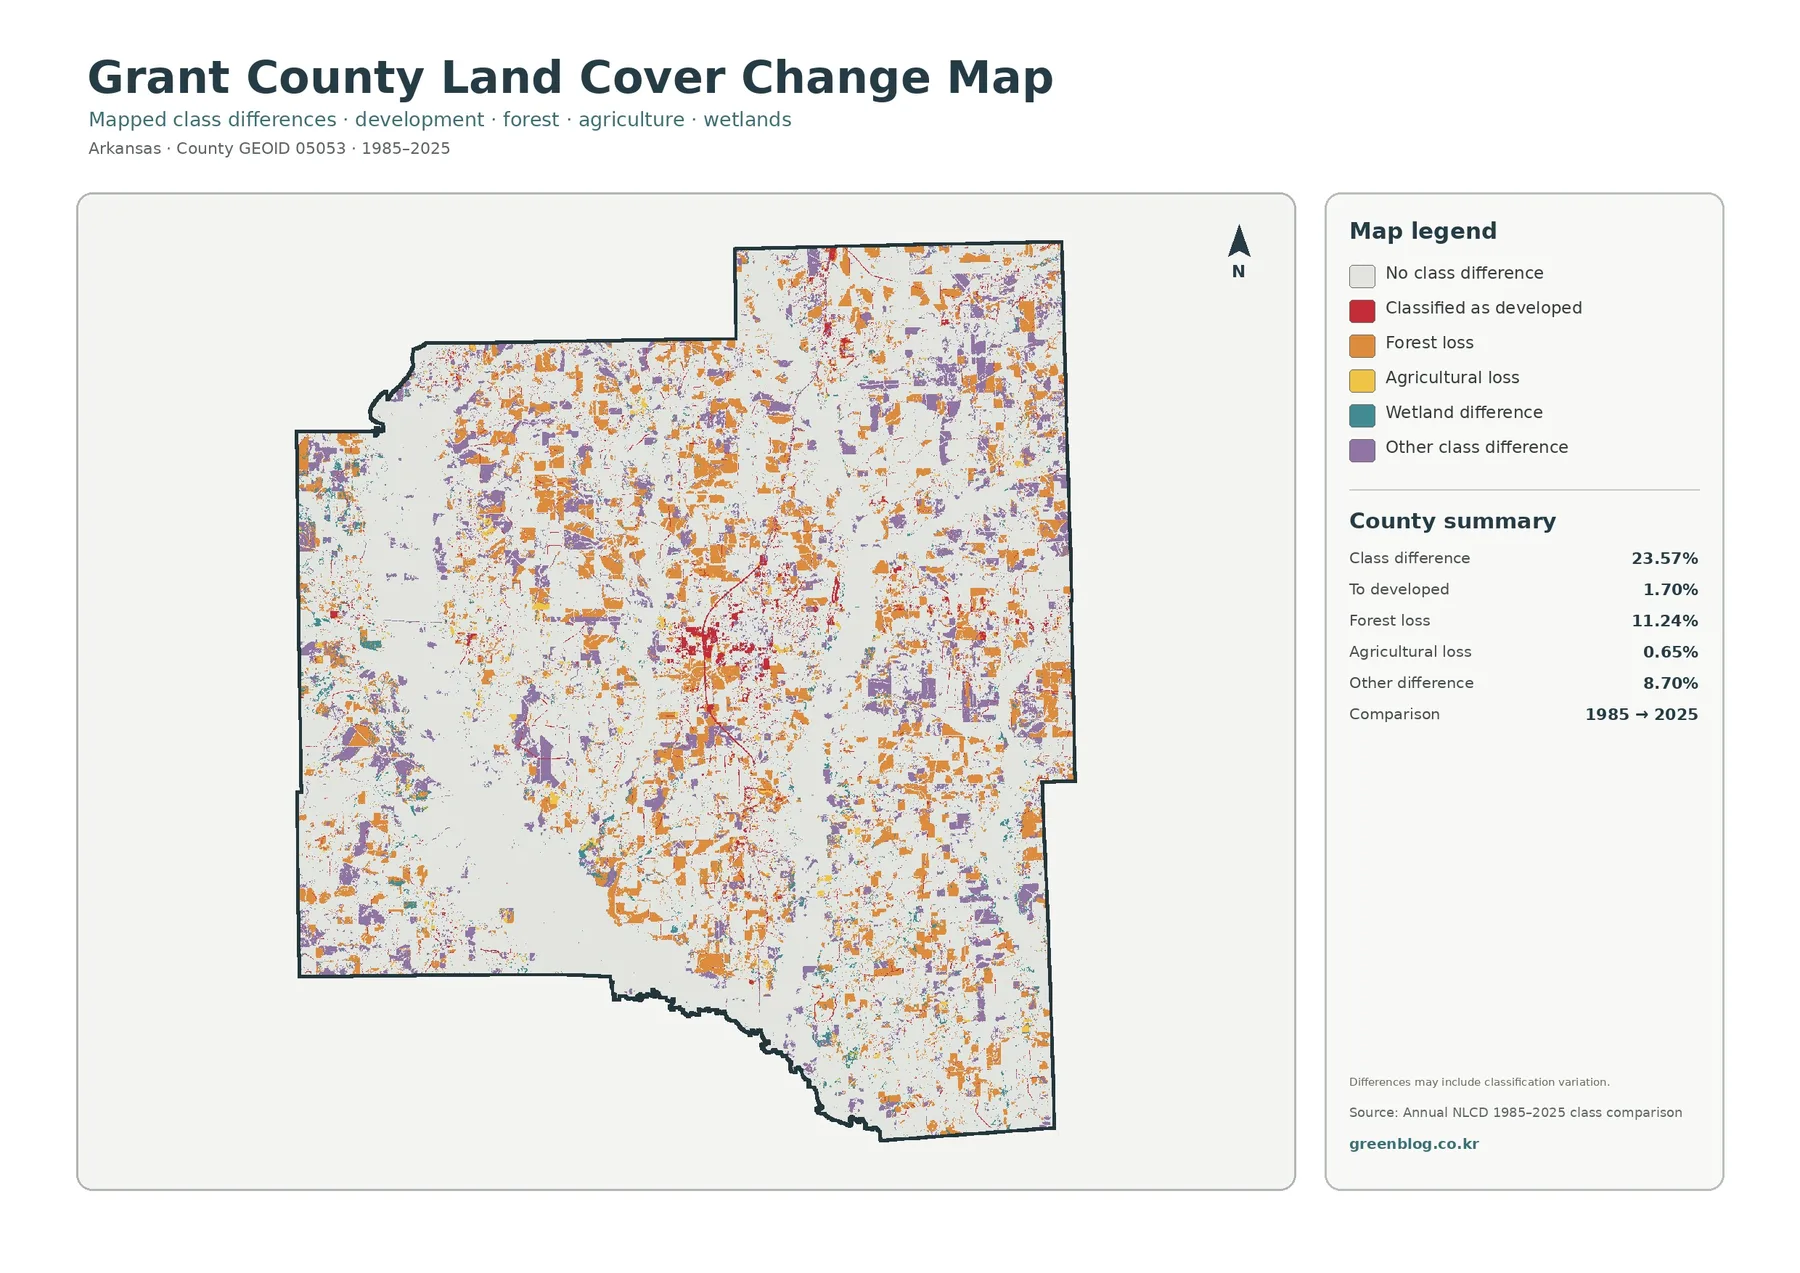
The long-term comparison reports a 23.57% overall class difference between 1985 and 2025. Its summary separates 1.70% classified as developed, 11.24% forest loss, 0.65% agricultural loss, and 8.70% other class difference. These categories should not be added to a simple story of urban growth. They describe several kinds of classification change, and the map notes that some differences may include classification variation.
Orange forest-loss patches are distributed widely through the county, while red change-to-developed cells are more concentrated near the central developed area and a handful of smaller locations. Purple other-class differences also occur in many parts of the map, and wetland differences appear in scattered corridors. This makes the change view useful for locating areas that deserve a closer look. It does not, by itself, establish whether a specific patch changed because of timber harvest, regrowth, agriculture, construction, flooding, or another process.
Annual NLCD Collection 1.2 extends the annual land-cover series through 2025 and is produced at 30-meter spatial resolution. MRLC also cautions users about comparing products from different releases because methodological differences can appear as classification differences. For a local project, the safest approach is to use the mapped change as a screening layer and verify important locations with aerial imagery, field records, planning data, or other time-specific evidence.
Choose the View That Matches the Question
The general 2025 cover view is the best starting point when the question is simply what covers the county. It allows forest, wetlands, open land, developed areas, and water to be considered together. The forest-and-farmland view is more effective when the task is to compare wooded land with cropland, pasture or hay, shrubland, grassland, and wet areas. Using the two side by side prevents a simplified rural-land category from hiding important differences.
The impervious view is better for questions about hard surfaces and settlement concentration. A red developed class on the general map may include a substantial amount of vegetation, but an impervious layer focuses directly on the fraction covered by hard surfaces. The change view serves a different purpose again: it identifies where 1985 and 2025 classifications differ. Selecting a map by question keeps the explanation clear and prevents one legend from being used for a job it was not designed to do.
For reports and presentations, the downloadable JPG files allow each view to be used separately. A classroom activity might compare the general and simplified rural maps first, then use the impervious map to discuss settlement, and finish with the change map to discuss time. A regional study might use the same sequence across several Arkansas counties so that each comparison uses the same year, classification system, and general map design.
Raster Scale and Classification Limits Matter
Annual NLCD is a raster product built from 30-meter cells. A single cell can contain more than one real-world surface, yet the land-cover product assigns a predominant class. This is why a forest edge, narrow road, small pond, or small building group may not match the visible ground boundary perfectly. Mixed pixels are especially important along transitions between wetlands, forest, farms, and development.
Land cover should also be kept separate from legal land use. A cell classified as agriculture does not prove that a parcel is zoned for agriculture, and a developed cell does not establish a building right, permit status, or ownership. Likewise, a wetland class is not a substitute for a jurisdictional wetland determination. The maps are best used for broad landscape reference, education, screening, and visual comparison rather than parcel-level decisions.
The 2025 map is a snapshot of a specific mapping year, and conditions can change afterward. Harvests, regrowth, construction, agricultural rotations, water levels, and seasonal conditions may alter what a visitor sees on the ground. When a decision depends on current conditions, pair the downloaded map with newer imagery or local records. When a decision depends on a legal boundary, use the appropriate official boundary or property source instead.
Download the Four Original JPG Files
The download contains four original JPG files: the 2025 land-cover map, forest-and-farmland map, impervious-surface and developed-land map, and the 1985–2025 land-cover-change map. Each supplied original is 2480 × 1754 pixels. The files are kept at their original size rather than being enlarged or re-encoded to claim a higher print specification. Use the JPGs when you need the source images for a document, slide, reference sheet, or comparison project.
Frequently Asked Questions
Does land cover show zoning or property use?
No. Land cover describes the physical surface classified from remote-sensing data, such as forest, wetlands, agriculture, water, grassland, or developed cover. It does not show ownership, zoning, building rights, or parcel-level legal use.
Does 23.57% class difference mean 23.57% of Grant County was developed?
No. The 23.57% value is the share of mapped cells whose classifications differ between 1985 and 2025. The summary separates change to developed land, forest loss, agricultural loss, and other differences, and some variation can come from classification effects.
What is included in the download?
The ZIP contains four Grant County JPG maps: general land cover, forest and farmland, impervious surface and developed land, and land-cover change. Each original file is 2480 × 1754 pixels.
Map File Information
The ZIP contains the four original Grant County JPG maps used for the 2025 land-cover and 1985–2025 change comparison.
- Included Files: Use only the versions confirmed in the article and supplied images
- File Type: Use the confirmed download contents
- Intended Use: Printing, education, presentations, and map-based projects
Related Maps
- A Craighead County Arkansas Land Cover Map
- Arkansas County Arkansas Land Cover Map
- Ashley County Arkansas Land Cover Map
Sources and Reference Links
- MRLC Annual NLCD Data — Annual land-cover products and data access
- USGS Annual NLCD Collection 1.2 — 1985–2025 annual coverage and 30-meter product information
- U.S. Census Bureau TIGER/Line Shapefiles — county boundary reference
- Grant County, Arkansas official website — county seat, local landscape, Saline River, and county information
- University of Arkansas System Cooperative Extension Service — Grant County — local agriculture and natural-resources programs
Green Map creates custom-edited map images using open geographic data sources such as geoBoundaries, Natural Earth, OpenStreetMap, and government open data.
These maps are edited visual materials, not raw data files, and are provided for education, documents, presentations, and graphic reference.