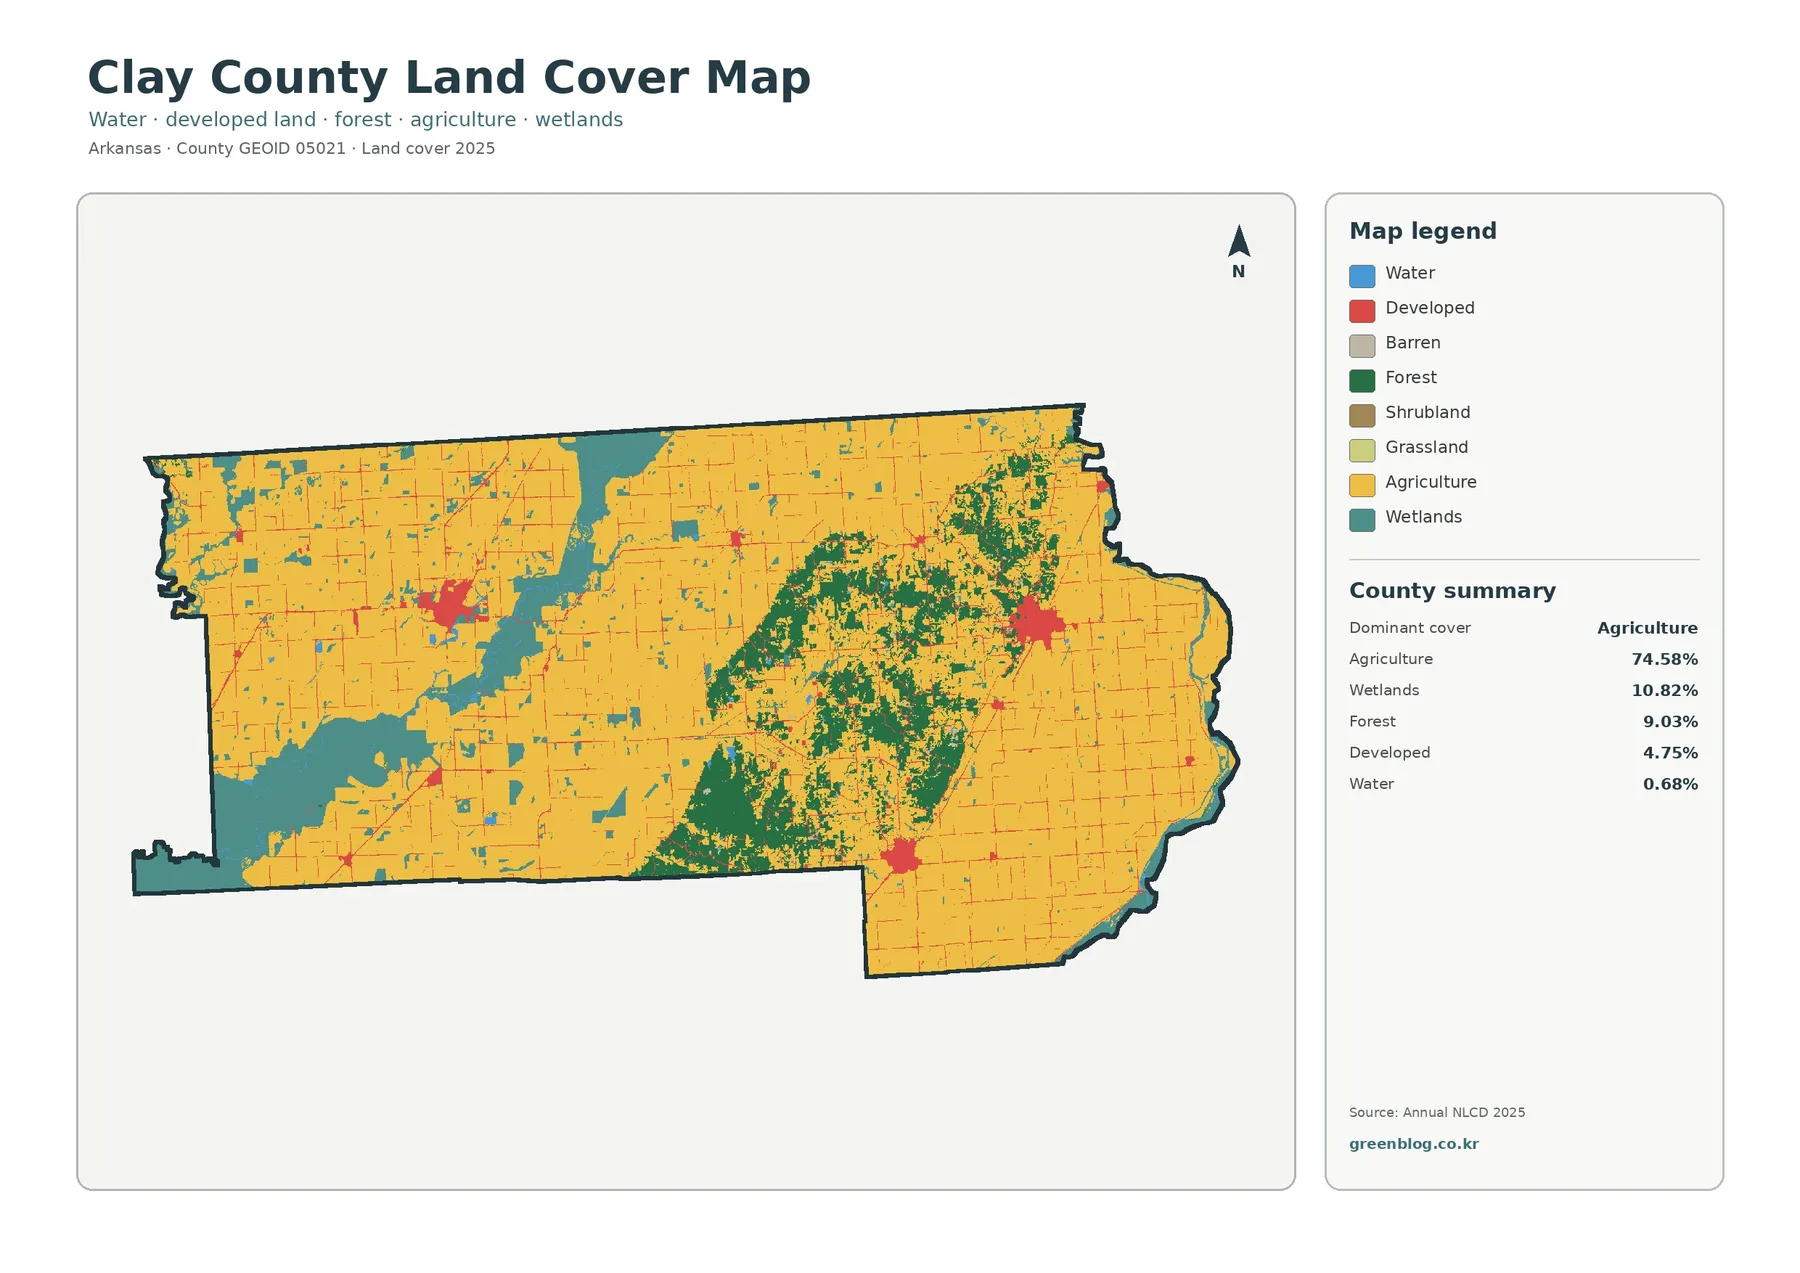
The Clay County Arkansas Land Cover Map set shows a county where agriculture dominates both the western and eastern lowlands while a greener band along Crowley’s Ridge interrupts the broad field pattern. In the 2025 summary, agriculture covers 74.58% of the county, followed by wetlands at 10.82%, forest at 9.03%, developed cover at 4.75%, and water at 0.68%. The contrast is easy to see even before looking at the percentages because the central ridge and wet lowlands break up an otherwise extensive agricultural landscape.
This page includes four matching views: general 2025 land cover, forest and farmland, impervious/developed surface, and a 1985–2025 class-difference comparison. The original JPG versions of all four are available together in one download near the end of the page. They can be used for county-scale reference, lessons, presentations, printing, and side-by-side environmental comparisons while keeping the same boundary in every view.
Table of Contents
A county-scale pattern built around farm country
The general 2025 view is mostly agricultural color. Large, nearly continuous field areas cover the west and east, and the road network cuts them into regular blocks. Wetlands and water interrupt those fields in lower areas, while forest becomes much more concentrated through the middle of the county. The 74.58% agricultural share therefore describes both the numerical majority and the visual background of Clay County.
The University of Arkansas System Cooperative Extension Service describes Clay County as a mostly rural county with row-crop agriculture on both sides of Crowley’s Ridge. Its local agriculture page lists corn, cotton, grain sorghum, wheat, rice, and soybeans among the crops grown in the county. Those crop records are a different kind of information from satellite land-cover classification, but they provide useful local context for the large agricultural area seen in the image.
Land cover should not be confused with zoning, ownership, parcel use, or a legal land-use designation. The categories describe what the ground surface was classified as from remotely sensed data. A cell shown as agriculture does not identify a particular crop or farm operator, and a developed cell does not define a city limit. The set works best for broad county patterns rather than property-level decisions.
Hard surfaces reveal a small set of developed centers
The impervious-surface view removes most of the agricultural and forest detail and makes settlement patterns much easier to spot. Mean impervious cover is 1.18%, only 0.36% of the county is in the 50%-or-more impervious category, and total developed cover is 4.75%. Most of the county remains pale on this layer, so the strongest red and orange clusters stand out sharply against the rural background.
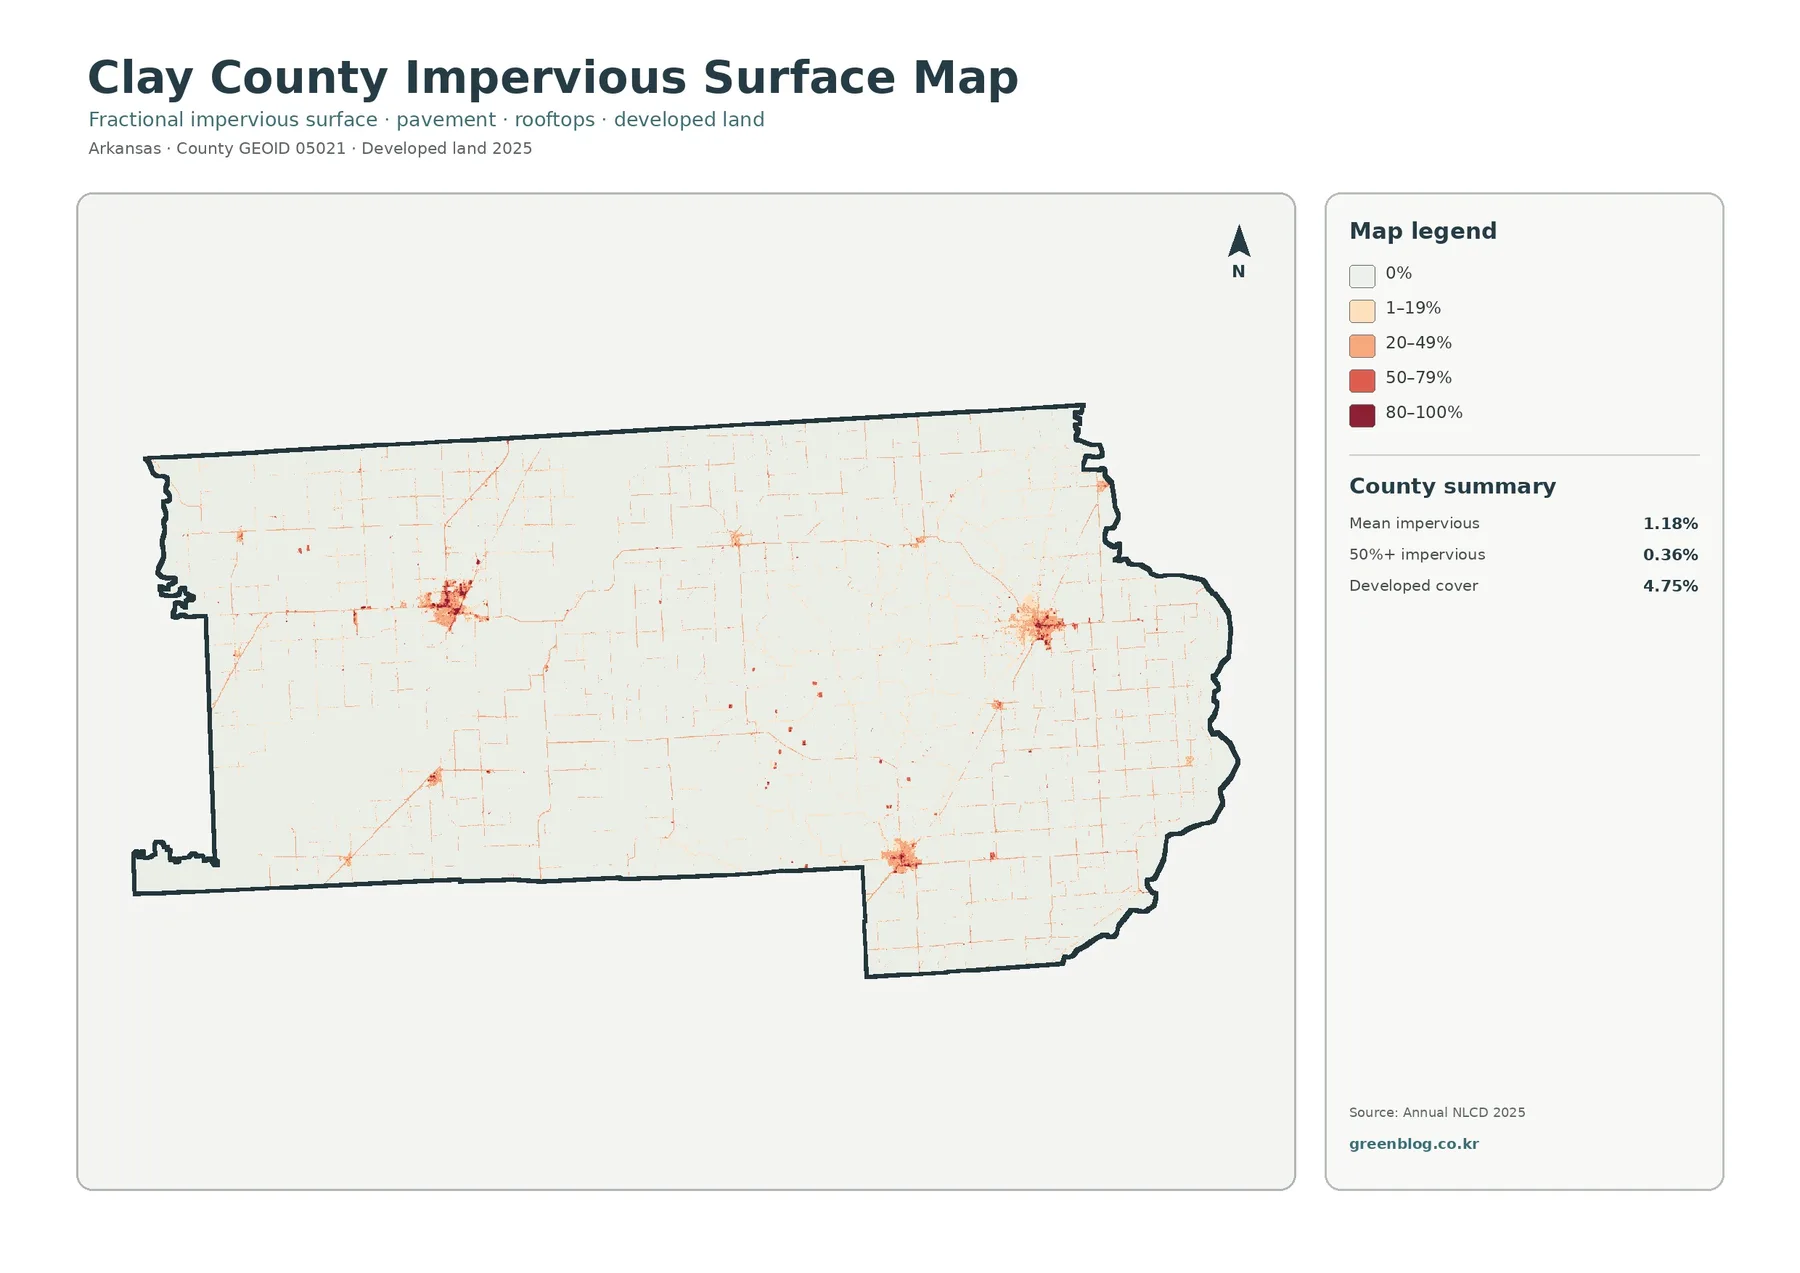
Three larger clusters appear in the western middle, eastern middle, and south-central parts of the county, with several smaller concentrations elsewhere. Clay County’s local government site identifies Piggott, Corning, and Rector as prominent cities and also lists smaller communities such as Knobel and Peach Orchard. Because the impervious image itself does not print city labels or legal municipal boundaries, it is safest to use those place references with a separate road or administrative source rather than tracing a city boundary from the colored cells.
Thin lines crossing the agricultural plain are another useful feature. They show where pavement and other hard surfaces follow the road network through otherwise open land. Near a larger settlement the lines become denser and merge into a compact patch; farther away they separate into a loose grid. For a classroom or presentation, this layer is a simple way to explain why “developed cover” can include both concentrated urban surfaces and narrow transportation features.
Crowley’s Ridge breaks the field pattern
The forest-and-farmland view makes the central contrast more obvious than the general classification does. Forest accounts for 9.03% of the county, yet it is not spread evenly. Green patches form a broad north-south zone through the center, with especially strong concentration in the south-central portion and a mixed forest/open pattern farther north. Extensive cropland remains on both sides.
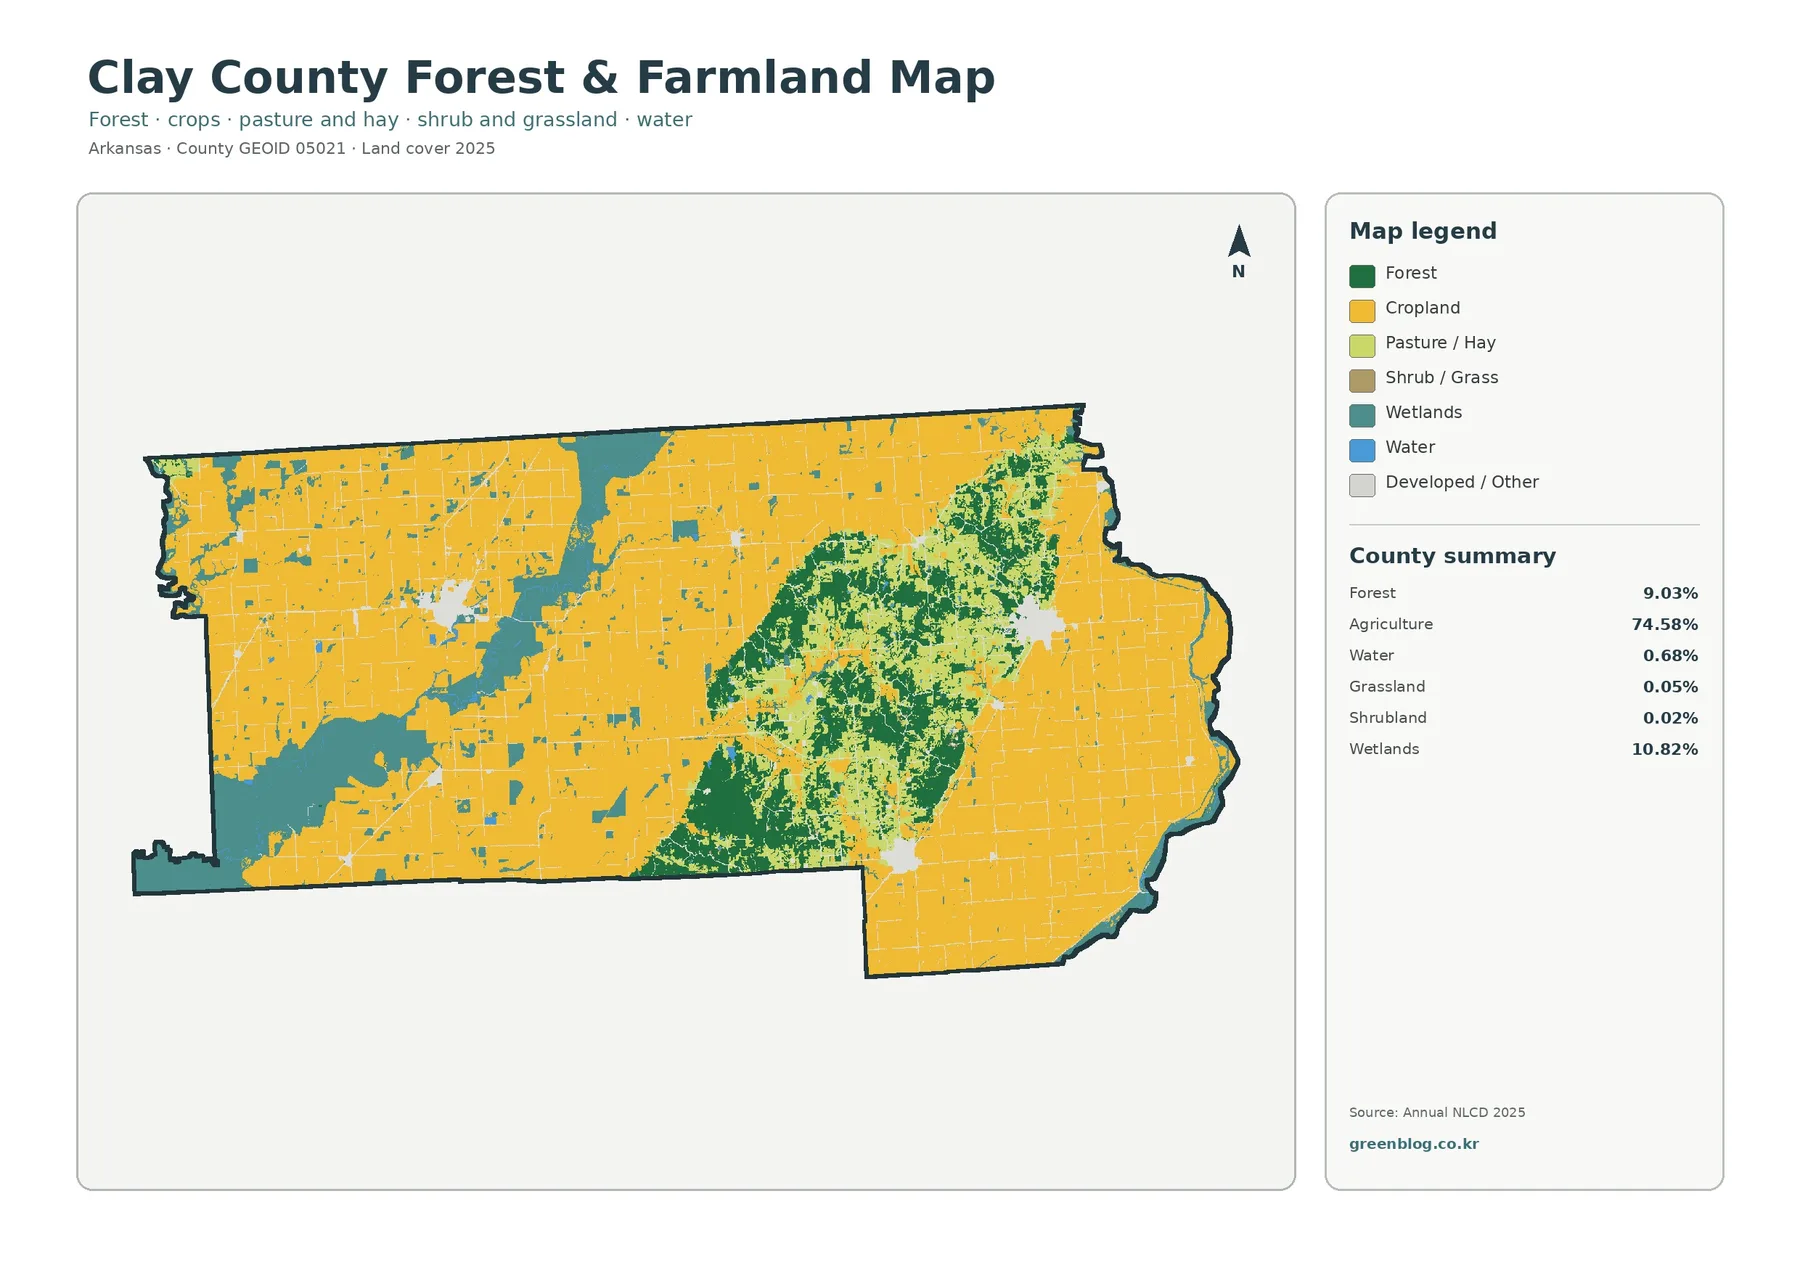
That pattern matches a useful local description from the Cooperative Extension Service: Crowley’s Ridge separates eastern and western Clay County, row-crop acreage occurs on both sides, and much of the county’s livestock, forage, and hay activity is on the ridge. The map does not identify individual pastures or livestock operations, but the combination of forest and small open areas along the ridge provides a more varied surface pattern than the surrounding crop plains.
Grassland is only 0.05% and shrubland 0.02% in the supplied summary, so neither is a major countywide class. Their small size does not make them irrelevant, however. Small open patches can be visually important where they sit beside forest or agriculture. This is a good example of why percentages and location should be read together: a class may occupy little total area but still mark a noticeable transition in one part of the county.
Wet lowlands interrupt the agricultural plains
Wetlands cover 10.82%, slightly more than forest, and they appear in several broad corridors rather than as a uniform background. Teal areas are especially noticeable in the western lowlands, through parts of the north-central county, and along the eastern edge. Open water is much smaller at 0.68%, but blue reaches and ponds are easy to distinguish where they cut through yellow agricultural land.
USGS water records provide two useful geographic anchors. A Black River monitoring location is near Corning in Clay County, while a St. Francis River monitoring location lies along the county’s eastern side. An older USGS description of northeastern Arkansas also distinguishes the low plain west of Crowley’s Ridge from the Mississippi lowland east of the ridge and notes swampy or wooded valleys along major rivers. That historical description is not the source of the 2025 classification, but it helps explain why wetland colors are not randomly distributed across the modern image.
Water and wetlands should remain separate in interpretation. Open water usually represents visible water surfaces, while wetland classes can include vegetated ground strongly influenced by water. Neither category is a substitute for a regulatory wetland determination. A landowner, planner, or researcher who needs a precise boundary should use current wetland inventories, surveys, and agency records rather than treating the raster edge as a legal line.
The 1985–2025 comparison is mostly stable at county scale
The class-difference layer marks 5.60% of Clay County as having a different mapped class between 1985 and 2025. The supplied summary identifies 0.99% as classified to developed, 0.60% as forest loss, 0.74% as agricultural loss, and 2.70% as other class difference. Because the total difference is relatively small, most of the image remains in the no-class-difference background.
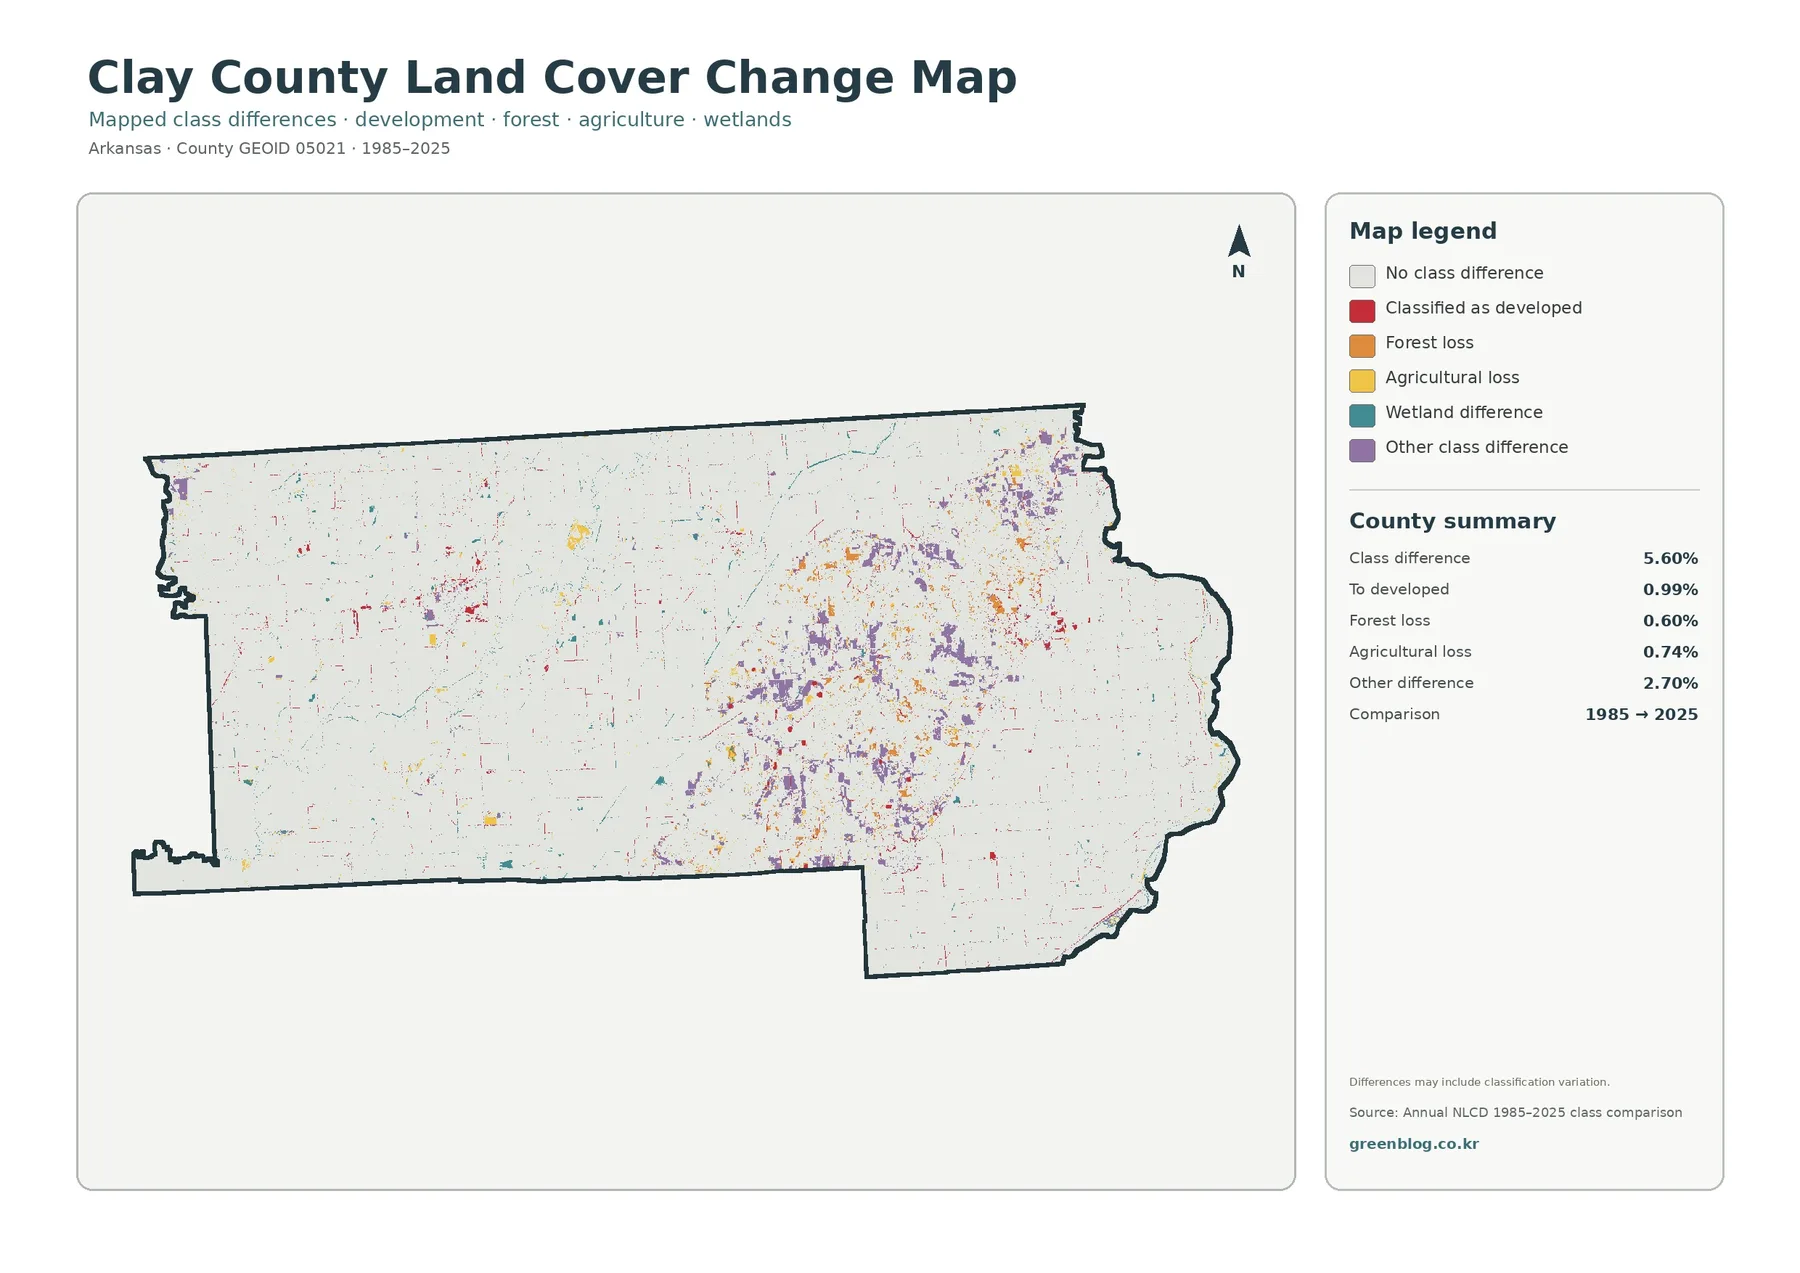
The colored changes are scattered. Some occur around the central ridge, some appear near the compact developed clusters, and others are small isolated cells across the farm plain. The map therefore does not support a single countywide story such as “development replaced the landscape.” It is better used to locate areas where the two endpoint classifications differ and then ask a more specific question about those places.
The labels “forest loss” and “agricultural loss” also require care. They describe a difference between the two mapped endpoints, not a complete forty-year history. A cell could have changed more than once, and classification methods or mixed pixels can also contribute to a difference. The map itself warns that differences may include classification variation. Annual NLCD source layers and intermediate years are needed before making a detailed claim about timing or cause.
How to use the four views as one set
A useful sequence depends on the question. For agriculture, begin with the general 2025 image to establish the 74.58% countywide share, then switch to the forest-and-farmland view to see how Crowley’s Ridge interrupts the field pattern. For settlement, start with the impervious layer and then return to the general image to see whether a developed cluster sits beside agriculture, forest, wetland, or water.
For river and wetland study, the overall image is more informative than the impervious view because it preserves open water and wetland classes together with adjacent fields. A student can compare the western and eastern lowlands, trace where teal wetlands interrupt cropland, and use separate labeled sources to identify the Black River or St. Francis River. The change layer can then be added last to find locations where the 1985 and 2025 classes differ.
The set also works well for presentation graphics because the county outline stays consistent. One slide can show the dominant agricultural landscape, another can isolate the wooded ridge, and a third can focus on hard surfaces without changing the geographic frame. That consistency helps viewers understand that the maps answer different questions about the same place rather than depicting four unrelated areas.
Download the original JPG set
The WebP images displayed in the article are browsing previews. The download package contains the original JPG versions of the general land-cover view, forest and farmland view, impervious/developed surface view, and 1985–2025 class comparison. Each JPG is 2480 × 1754 pixels. The supplied files are kept at their original resolution rather than being enlarged to imitate an A3 high-resolution source.
Scale, date, and classification limits
Raster land-cover products generalize the ground into cells. A cell can contain more than one real surface, such as a house surrounded by lawn, a road crossing a field, a narrow wooded strip beside a ditch, or a small pond within farmland. The final class represents the mapped category for that cell, so small features and boundaries may not match what a parcel survey or high-resolution aerial image would show.
The 2025 layer is also tied to its observation and processing period. Cropping changes, new construction, flooding, clearing, vegetation recovery, or other later events may not appear. Likewise, the 1985–2025 layer compares two endpoints and does not document every event between them. For current property, farm, wetland, or development decisions, readers should combine this county-scale overview with current local records and more detailed sources.
Frequently Asked Questions
What is the dominant land-cover class in Clay County?
Agriculture is the dominant 2025 class at 74.58%. Wetlands account for 10.82%, forest for 9.03%, developed cover for 4.75%, and water for 0.68%. The agricultural share is large on both sides of Crowley’s Ridge.
Why does the center of the county look greener than the east and west?
The greener central zone corresponds with the Crowley’s Ridge area, where forest and smaller open-cover patches are more concentrated. The University of Arkansas Extension Service also notes that the ridge separates the eastern and western row-crop areas and supports much of the county’s livestock, forage, and hay activity.
Does the 5.60% class difference mean 5.60% of the county was developed?
No. The 5.60% figure includes all mapped class differences between 1985 and 2025. Only 0.99% is identified as classified to developed in the summary. Forest loss, agricultural loss, wetland differences, other differences, and possible classification variation account for the rest.
Map File Information
The ZIP contains four original Clay County JPG maps covering 2025 land cover, forest and farmland, impervious/developed surface, and the 1985–2025 class comparison.
- Included Files: Use only the versions confirmed in the article and supplied images
- File Type: Use the confirmed download contents
- Intended Use: Printing, education, presentations, and map-based projects
Related Maps
- Arkansas County Arkansas Land Cover Map
- Ashley County Arkansas Land Cover Map
- Baxter County Arkansas Land Cover Map
Sources and Reference Links
- MRLC Annual NLCD Data – official annual land-cover data access
- USGS Annual NLCD Land Cover Classification – class definitions and interpretation
- University of Arkansas System Cooperative Extension Service – Clay County Programs – local row crops, Crowley’s Ridge, livestock, forage, and hay context
- Clay County, Arkansas – Towns & Cities – local place reference for Piggott, Corning, Rector, and smaller communities
- USGS Water Data – Black River near Corning – stream location and county water context
Green Map creates custom-edited map images using open geographic data sources such as geoBoundaries, Natural Earth, OpenStreetMap, and government open data.
These maps are edited visual materials, not raw data files, and are provided for education, documents, presentations, and graphic reference.