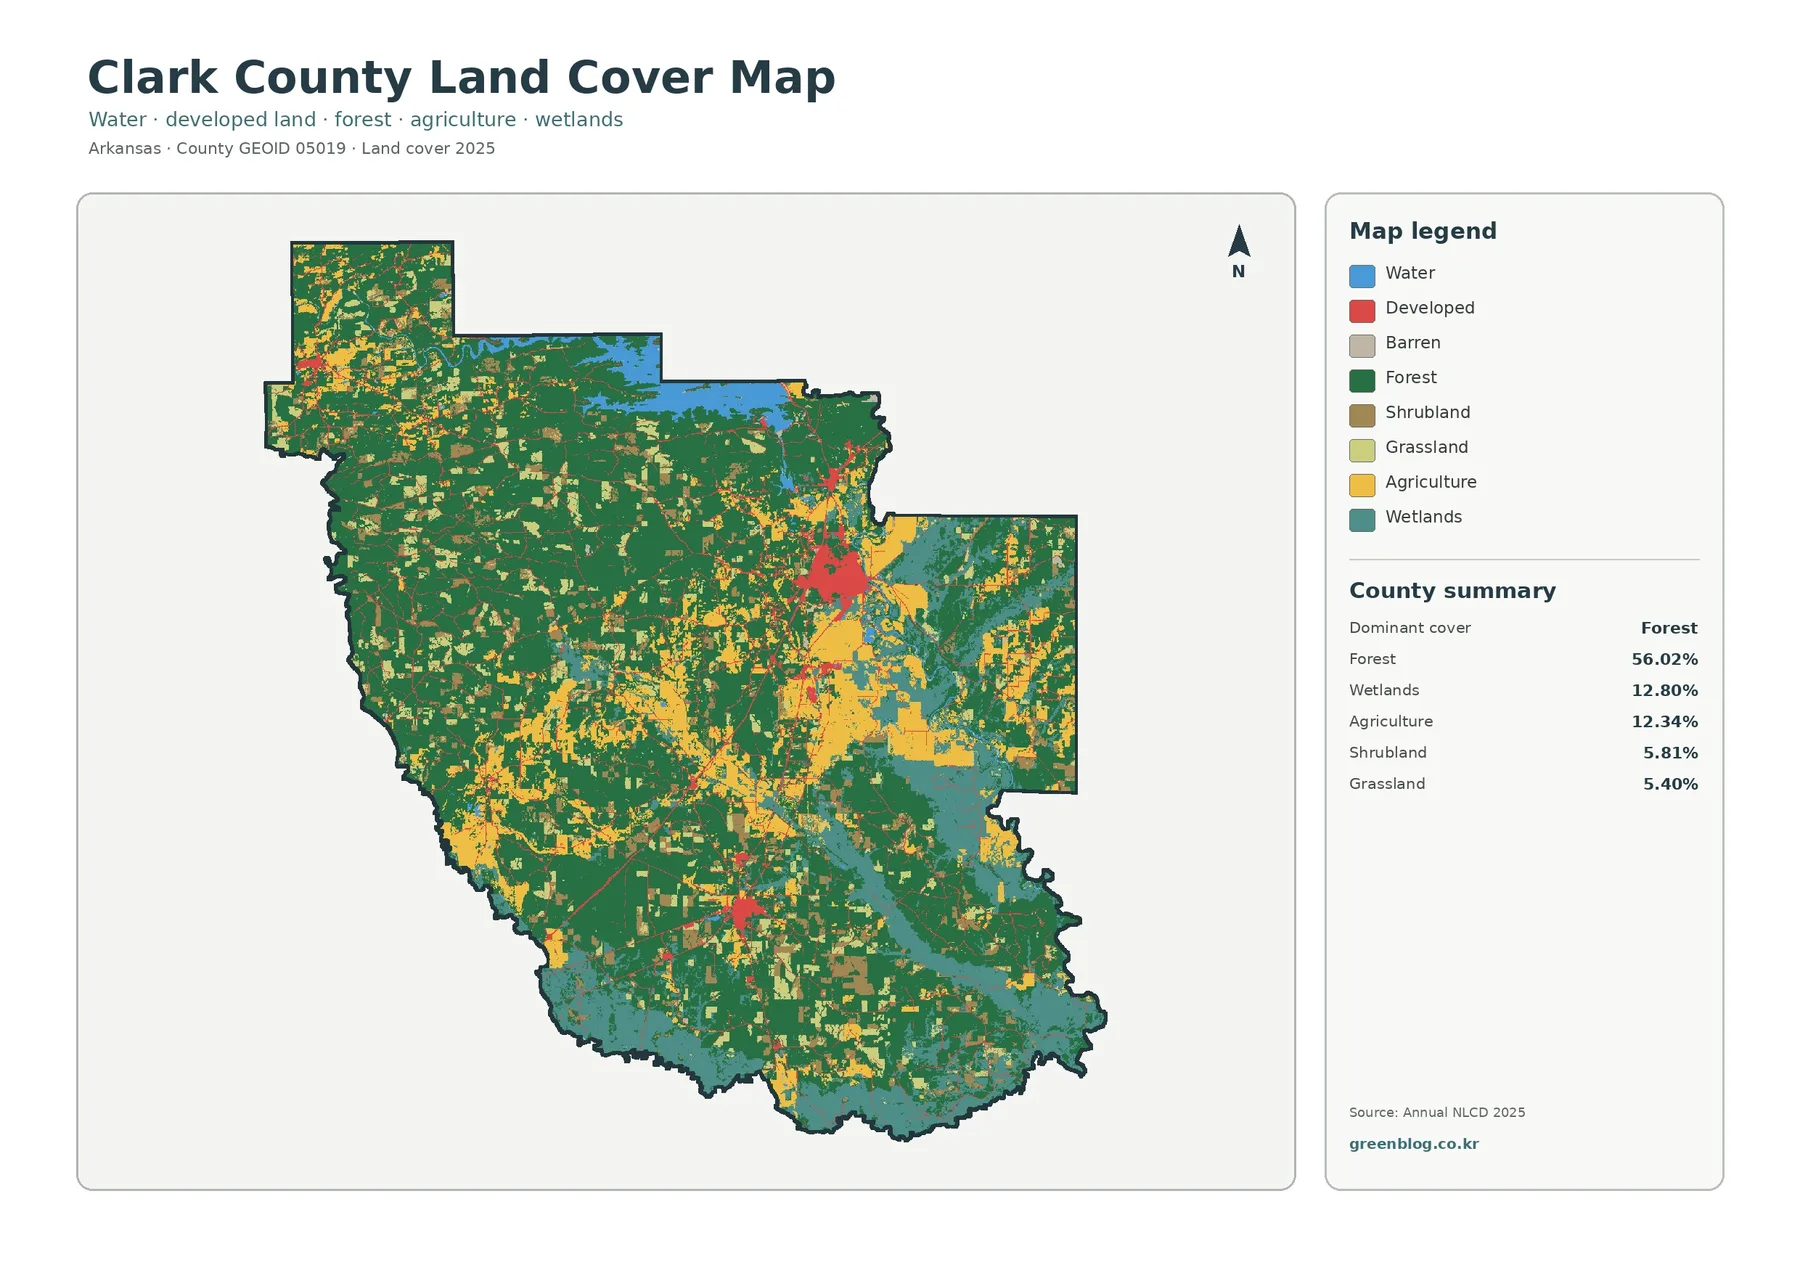
The Clark County Arkansas Land Cover Map set describes a county where forest is the main background but water, wetlands, farms, and compact developed places create strong local contrasts. The 2025 summary lists forest at 56.02%, wetlands at 12.80%, agriculture at 12.34%, shrubland at 5.81%, and grassland at 5.40%. A large water area near the northern edge and a chain of developed surfaces around Arkadelphia stand out against the broader forest cover.
This page includes four views built on the same county boundary: 2025 land cover, forest and farmland, impervious/developed surface, and a 1985–2025 class-difference view. The four original JPG files can be downloaded together near the end of the article. Keeping the boundary consistent makes the set useful for printing, classroom comparison, presentations, and county-scale environmental reference.
Table of Contents
Compact development inside a mostly rural county
Clark County looks lightly developed when the entire county is viewed at once. The impervious-surface summary gives a mean impervious value of 1.05%, while only 0.40% of the county falls in the 50% or greater impervious category. Developed land cover totals 5.32%. Most of the county therefore remains very pale on this view, while roads and settlements appear as thin lines and concentrated patches.
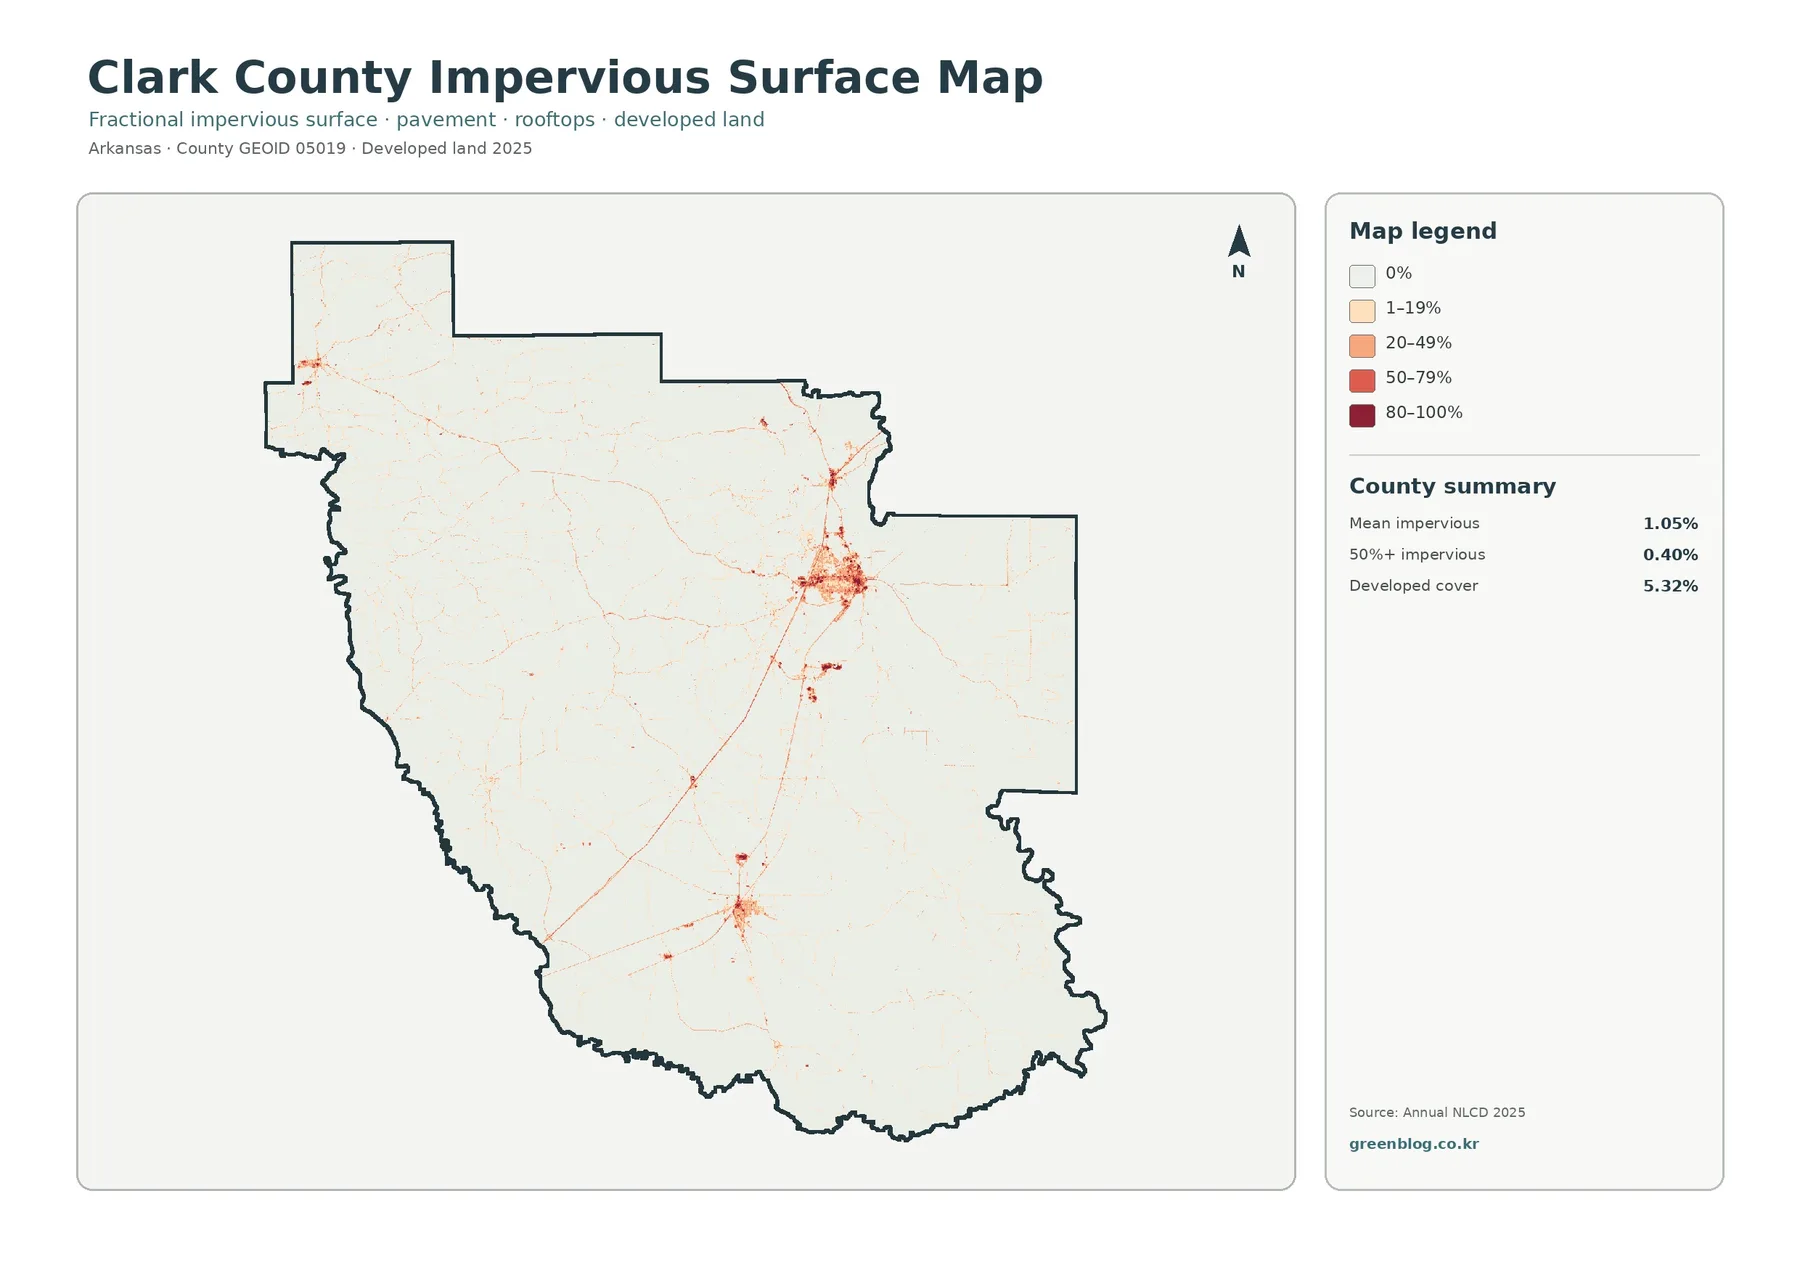
The largest concentration sits in the central-eastern part of the county and aligns with Arkadelphia. Smaller clusters appear farther south around Gurdon, in the northwest near Amity, and toward Caddo Valley near the northern water area. Clark County’s official government site lists Arkadelphia, Amity, Caddo Valley, Gum Springs, Gurdon, Okolona, and Whelen Springs among its incorporated places. Because the impervious view itself is not a labeled city map, those place names should be used as reference points rather than as exact boundary labels.
Thin reddish lines also connect some of the settlement clusters. They are useful for seeing where paved surfaces and development occupy the same corridor, but they do not prove that a road caused a particular development pattern. Questions about growth history, traffic, zoning, or municipal expansion require separate planning and transportation sources. The land-cover product simply shows how much of the surface was classified as developed or impervious in the mapped year.
Forest is the dominant cover, but not a continuous blanket
Forest accounts for 56.02% of Clark County in the 2025 summary. Broad green areas cover much of the west, southwest, and northwest, and forest remains common through the central part of the county. Even so, the cover is not uniform. Agricultural fields, grassland, shrubland, wetlands, and developed clearings break the forest into a varied pattern, especially as the view moves east toward Arkadelphia and the larger water corridors.
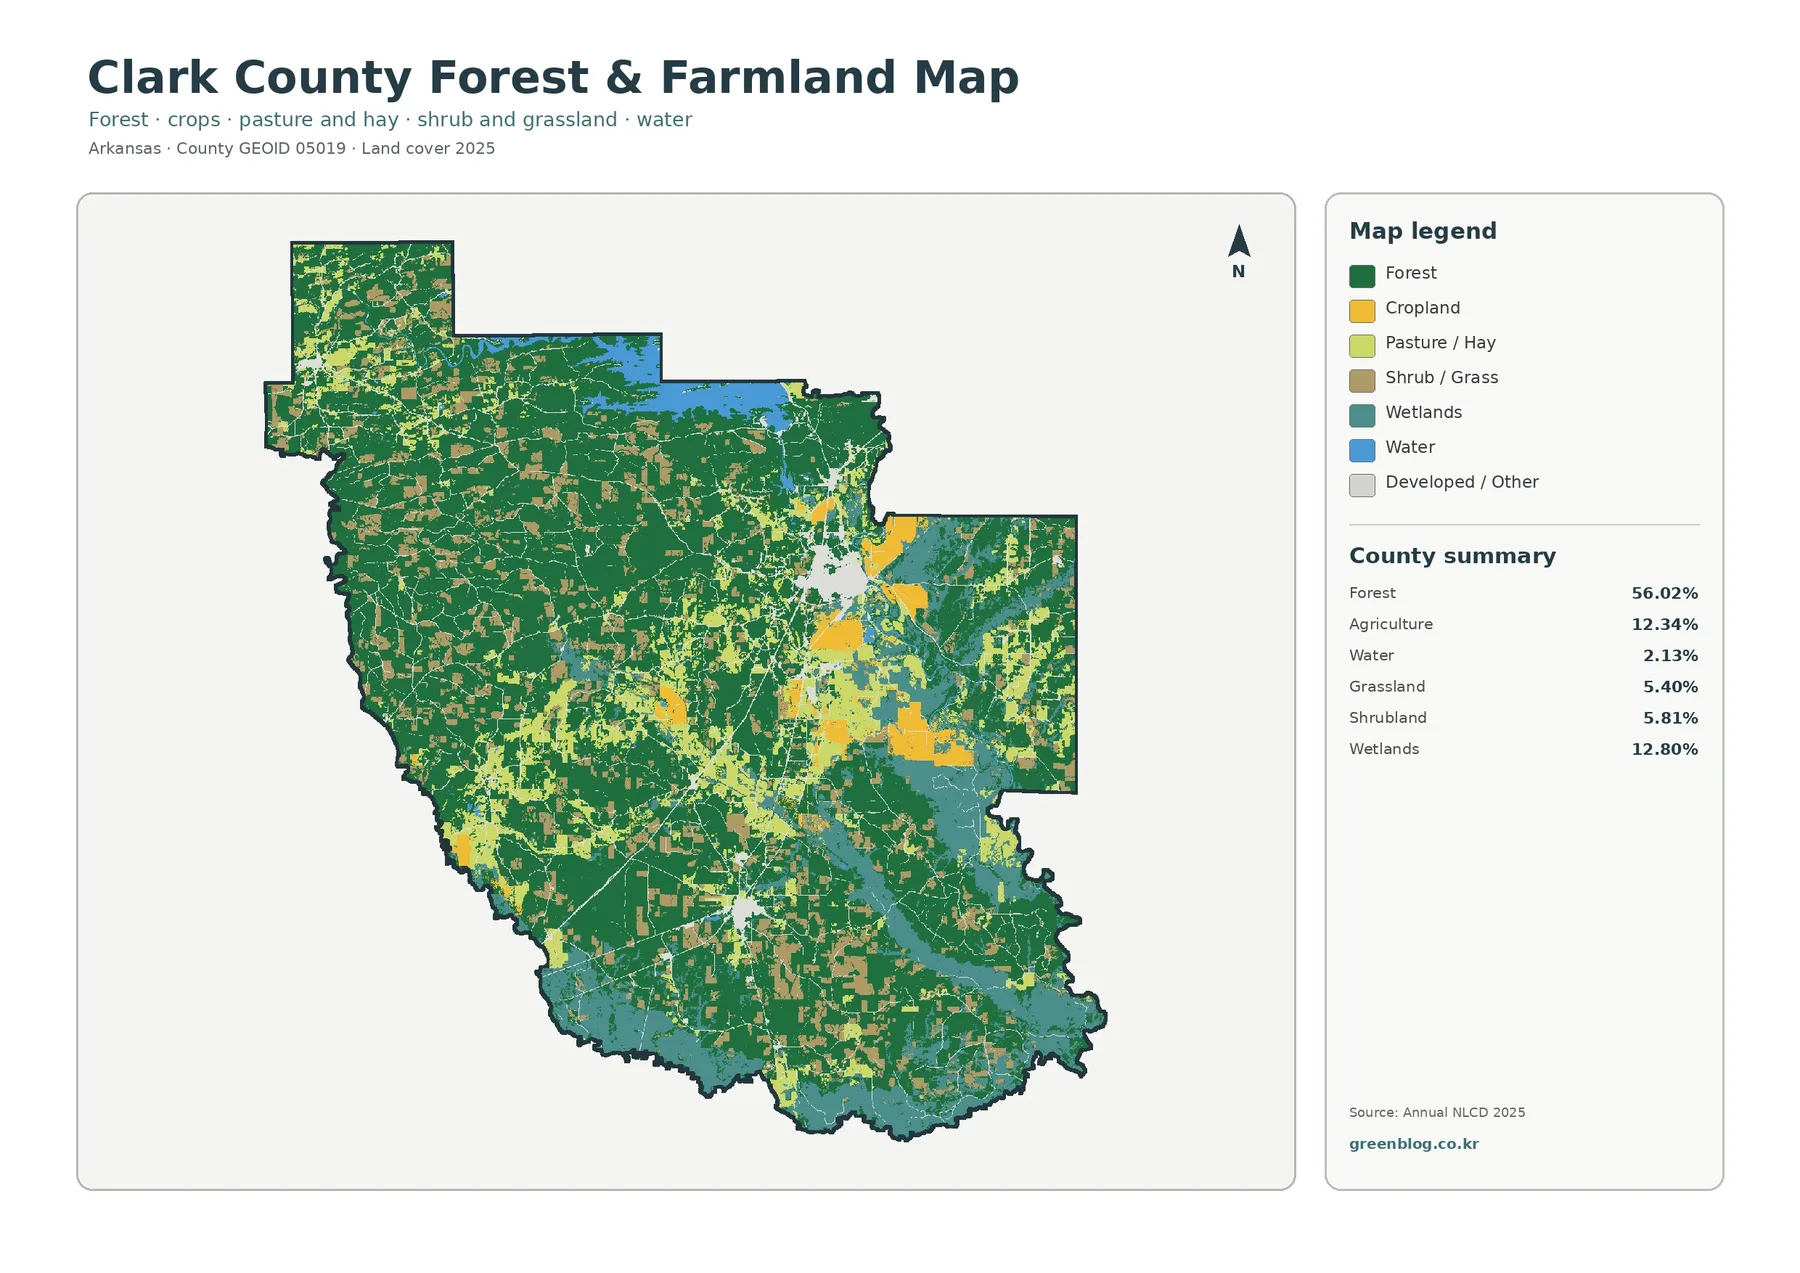
Agriculture represents 12.34% of the county, but it is spread through multiple areas rather than forming one enormous block. Larger agricultural patches occur in the central and eastern portions, while smaller fields and pasture-like areas are interspersed with forest farther west. Grassland is 5.40% and shrubland 5.81%, so the open landscape cannot be described only as cropland. Those classes help explain why some areas look more open even where the main agriculture color is not dominant.
The University of Arkansas System Cooperative Extension Service provides useful local context for that mixture. Its Clark County programs include row-crop production as well as beef and forage, pasture renovation, and timber/forestry education. Those programs are not a direct measurement of the mapped percentages, but they confirm that agriculture, forage, and forestry are all active resource topics in the county. That makes the forest-and-farmland view more informative than a simple forest-total statistic.
Water and wetlands connect the northern lake area with lower river corridors
Open water covers 2.13% of Clark County, a modest share compared with forest, yet it is visually important because much of it is concentrated. The large blue area along the northern part of the county corresponds to the DeGray Lake setting. The U.S. Army Corps of Engineers describes DeGray Lake as lying just north of Arkadelphia in the foothills of the Ouachita Mountains, created by damming the Caddo River. That named feature gives the northern water block a clear geographic context.
Wetlands cover 12.80%, slightly more than agriculture. They are especially noticeable through the east and southeast and along water-connected lowlands. Near Arkadelphia, the Ouachita River provides another useful reference. The Corps of Engineers maintains a river gage on the Ouachita River at Arkadelphia, confirming that the river passes through the city. In the land-cover image, water and wetland classes form elongated bands rather than the rectangular shapes common in many agricultural patches.
Land cover should not be confused with a legal wetland boundary, parcel ownership, or zoning. Annual NLCD classifies the surface observed in raster cells. A cell near a river may contain trees, standing water, grass, and a road at the same time, while the product assigns a single class or generalized value according to its method. A regulatory wetland determination or property decision therefore needs field information and the relevant official program, not this county overview alone.
What changed between the 1985 and 2025 classifications
The class-difference view compares 1985 with 2025 and marks 27.69% of the county as having a different mapped class. The summary separates that total into 1.12% classified as developed, 10.44% shown as forest loss, 1.78% shown as agricultural loss, and 13.27% placed in other class differences. Those categories describe mapped differences between two endpoints. They should not be converted automatically into a simple claim that 27.69% of the county was cleared, built over, or permanently changed.
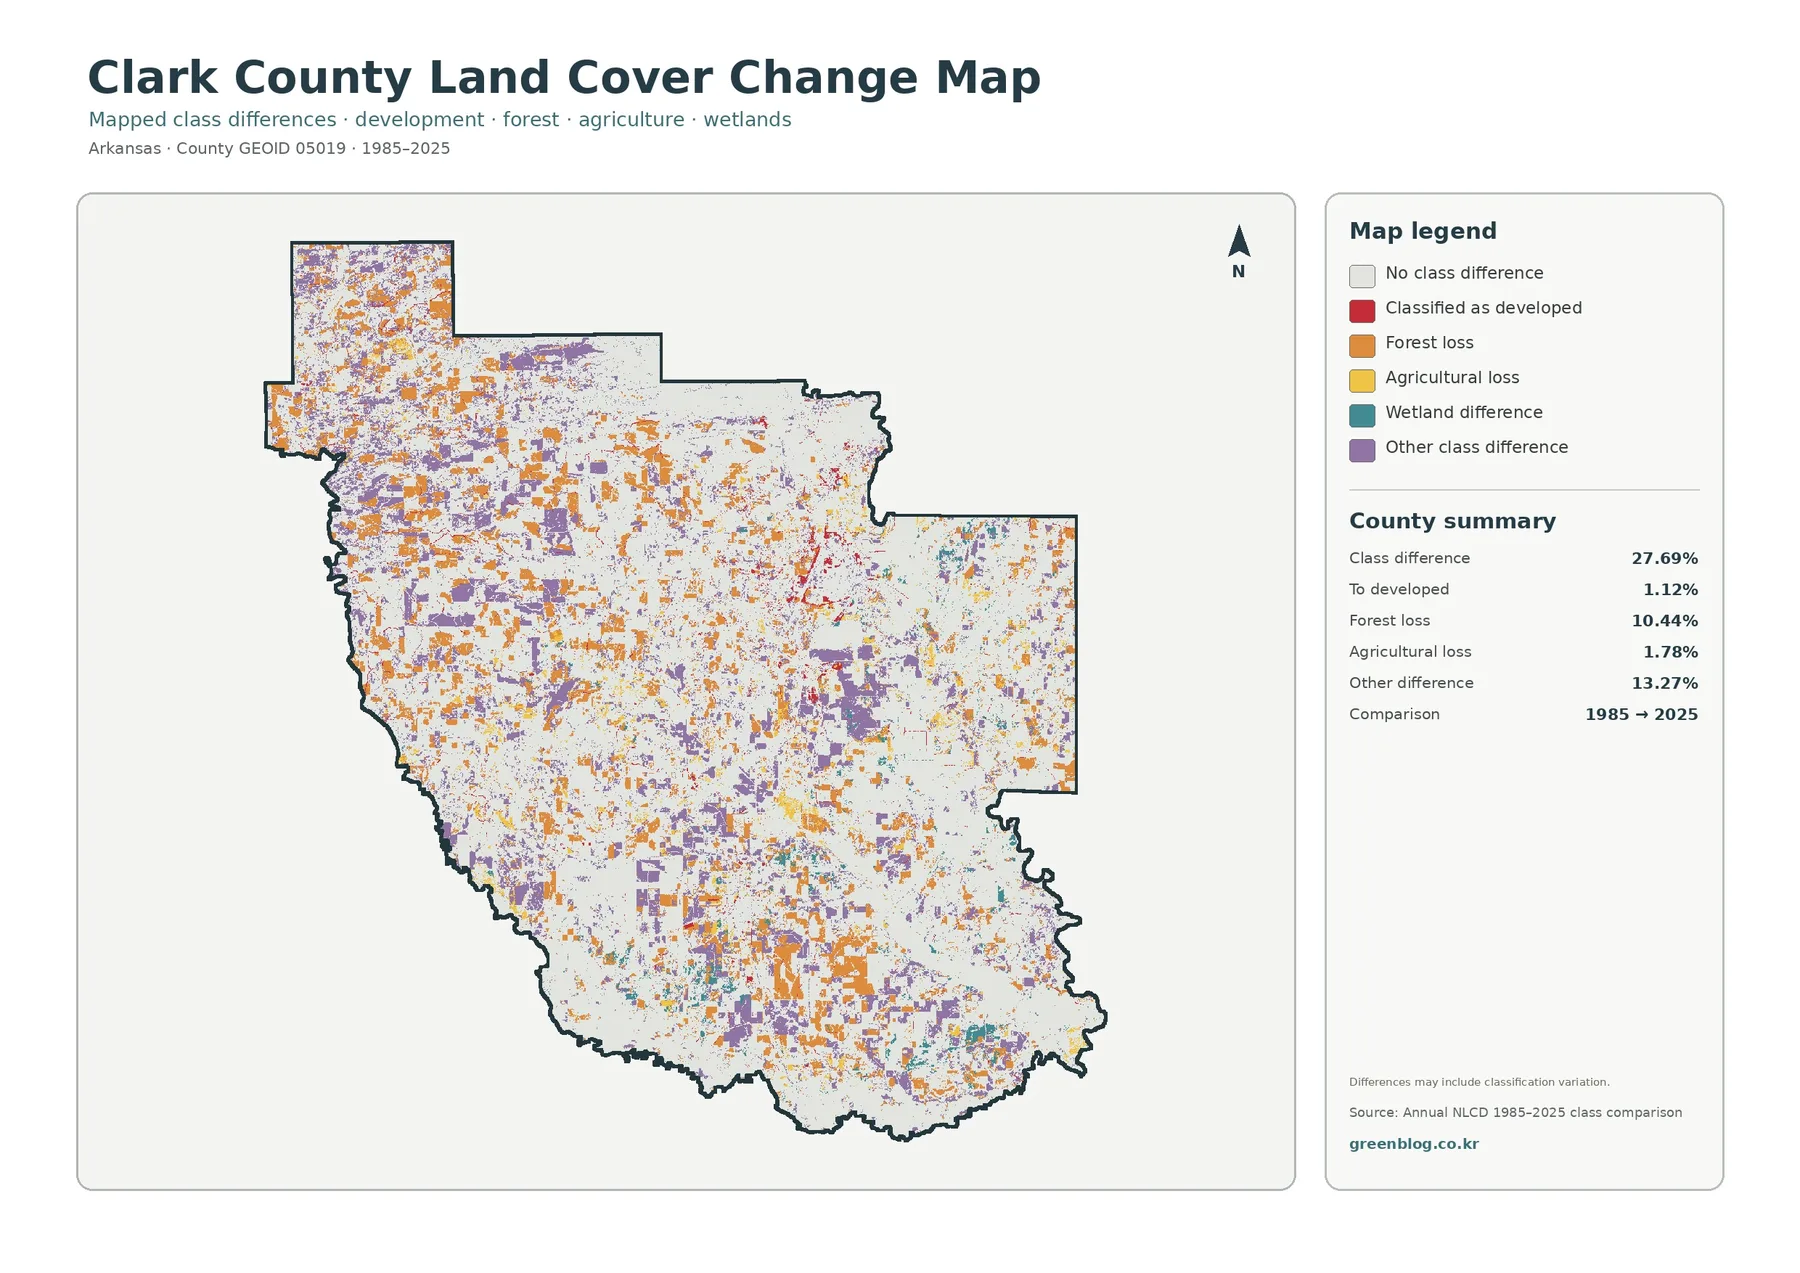
Orange forest-loss patches are scattered across the west, center, and south rather than forming one single zone. Purple other-difference cells are also widespread, while red developed-class differences are easier to notice near existing settlement areas. This mixed pattern suggests that a countywide total hides many local transitions. To study any specific tract or to determine the sequence of change, a researcher would need the annual source data instead of relying only on the two-date summary.
The comparison legend also carries an important caution: differences may include classification variation. Satellite products, processing methods, and mixed pixels can cause a cell to fall into different classes without representing a dramatic land-use event. For that reason, the change view works best as a screening layer. It can identify areas worth checking more closely, but it is not a substitute for aerial-photo review, forestry records, planning documents, or site visits.
Reading the four views together
The countywide 2025 view is the best place to begin when the goal is to compare several cover types at once. It makes the 56.02% forest dominance immediately visible while preserving the location of wetlands, agriculture, water, grassland, shrubland, and development. The simplified forest-and-farmland view is better when the question is how open agricultural or pasture areas interrupt the forest matrix. The impervious view strips away most other categories so settlement patterns become much easier to see.
For an Arkadelphia-focused project, a useful sequence is to start with the developed cluster, then compare the surrounding forest and wetland classes, and finally check the 1985–2025 difference layer. Around DeGray Lake, the countywide and forest/farmland views reveal the relationship between open water and forest more clearly than the impervious image does. Around Gurdon or Amity, the impervious surface view can help locate the compact settlement pattern before another labeled road or administrative source is added.
This approach is useful in classrooms because students can ask a different question while keeping the county boundary fixed. One exercise might compare the percentages of forest, wetlands, and agriculture. Another might trace where developed surfaces cluster. A third can identify places where the 1985 and 2025 classes differ and discuss why a two-date classification needs caution. The set can also support presentation graphics when a consistent visual frame is more important than parcel-level precision.
Download files and image size
The WebP images on the page are previews for browsing. The download package contains the original JPG versions of the general land-cover view, forest and farmland view, impervious/developed surface view, and 1985–2025 change view. Each source JPG is 2480 × 1754 pixels. The files are kept at their original supplied resolution rather than being enlarged and re-encoded to imitate a higher-resolution product.
Classification limits and scale
Annual NLCD is designed for consistent regional land-cover analysis, not for showing every small feature on the ground. Raster cells generalize the landscape, and a mixed pixel can contain more than one real-world surface. A narrow road through forest, a small pond, a house surrounded by lawn, or a wooded strip beside a field may not appear exactly as a viewer expects at parcel scale. The map is most reliable when it is used to compare broad patterns across the county.
The 2025 classification also represents a dated observation. Logging, construction, farm conversion, storm damage, vegetation recovery, or other changes after the source year may not be reflected. The same caution applies to the 1985–2025 comparison: its endpoint difference does not reveal every change that may have happened in the forty years between those dates. For current property, wetland, planning, or infrastructure questions, readers should use current local or state records in addition to this overview.
Frequently Asked Questions
What is the largest land-cover class in Clark County?
Forest is the dominant 2025 cover at 56.02%. Wetlands account for 12.80% and agriculture 12.34%, while shrubland and grassland each make up a little more than five percent.
Why does Arkadelphia stand out on the impervious-surface view?
Impervious surfaces emphasize pavement, rooftops, parking areas, and similar hard surfaces. Arkadelphia has the county’s largest concentrated developed area, so it creates a much stronger cluster than the surrounding rural landscape. The view is not a municipal-boundary map, however, and should not be used to define the legal city limits.
Does the 27.69% class difference mean that 27.69% of Clark County was developed?
No. The 27.69% figure represents all mapped class differences between 1985 and 2025. Only 1.12% is labeled as classified to developed in the summary. Forest-loss, agricultural-loss, and other differences make up the rest, and some differences may reflect classification variation.
Map File Information
The ZIP contains four original Clark County JPG maps covering 2025 land cover, forest and farmland, impervious/developed surface, and the 1985–2025 class comparison.
- Included Files: Use only the versions confirmed in the article and supplied images
- File Type: Use the confirmed download contents
- Intended Use: Printing, education, presentations, and map-based projects
Related Maps
- Arkansas County Arkansas Land Cover Map
- Ashley County Arkansas Land Cover Map
- Baxter County Arkansas Land Cover Map
Sources and Reference Links
- MRLC Annual NLCD Data – official annual land-cover data access
- USGS Annual NLCD Land Cover Classification – class definitions and interpretation
- University of Arkansas System Cooperative Extension Service – Clark County Programs – local row-crop, forage, pasture, and forestry context
- Clark County Arkansas – Cities & Incorporated Towns – official local place reference
- U.S. Army Corps of Engineers – DeGray Lake – lake location, Caddo River, and project information
Green Map creates custom-edited map images using open geographic data sources such as geoBoundaries, Natural Earth, OpenStreetMap, and government open data.
These maps are edited visual materials, not raw data files, and are provided for education, documents, presentations, and graphic reference.