The Chicot County Arkansas Land Cover Map set covers a Delta county where broad agricultural fields occupy most of the interior while water and wetlands become much more prominent toward the Mississippi River side. The 2025 summary lists agriculture at 69.50%, wetlands at 18.72%, water at 6.65%, and developed land at 3.86%. That combination makes Chicot look very different from a heavily forested Arkansas county: fields dominate the map, but the eastern water-and-wetland edge is too large to treat as a minor detail.
Four views are provided on this page: overall 2025 land cover, forest and farmland, impervious/developed land, and a 1985–2025 class-difference map. The four original JPG maps are available together in one download. They are useful for printing, classroom comparison, presentations, or any county-scale project that needs a consistent boundary across several land-cover themes.
Table of Contents
Start with the Delta landscape, not with a list of map classes
Chicot County sits in southeastern Arkansas along the Mississippi River. The county-specific Extension office describes commercial agriculture as a vital local activity, and its row-crop information includes corn, rice, soybeans, and cotton. The land-cover pattern matches that agricultural setting at a broad scale. Large blocks of agricultural cover fill much of the county, especially away from the eastern river edge, while wetlands and water trace a more irregular network through the Delta landscape.
Lake Chicot provides another useful landmark. Arkansas State Parks describes it as a large C-shaped oxbow lake formed from an old course of the Mississippi River. On the county map, the curved water body near the east-central side stands out immediately, and wetland cover appears around and beyond it. That relationship helps explain why a county with nearly seventy percent agriculture can still have a strong aquatic and wetland character on the map.
Land cover should not be confused with zoning, ownership, crop records, or parcel boundaries. These maps classify the visible or remotely sensed surface into broad groups such as agriculture, water, wetland, and developed land. A yellow cell tells the reader that the surface was classified as agricultural cover; it does not identify the farmer, the crop in that field, or the legal use allowed on a parcel.
The 2025 map is dominated by agriculture but shaped by water
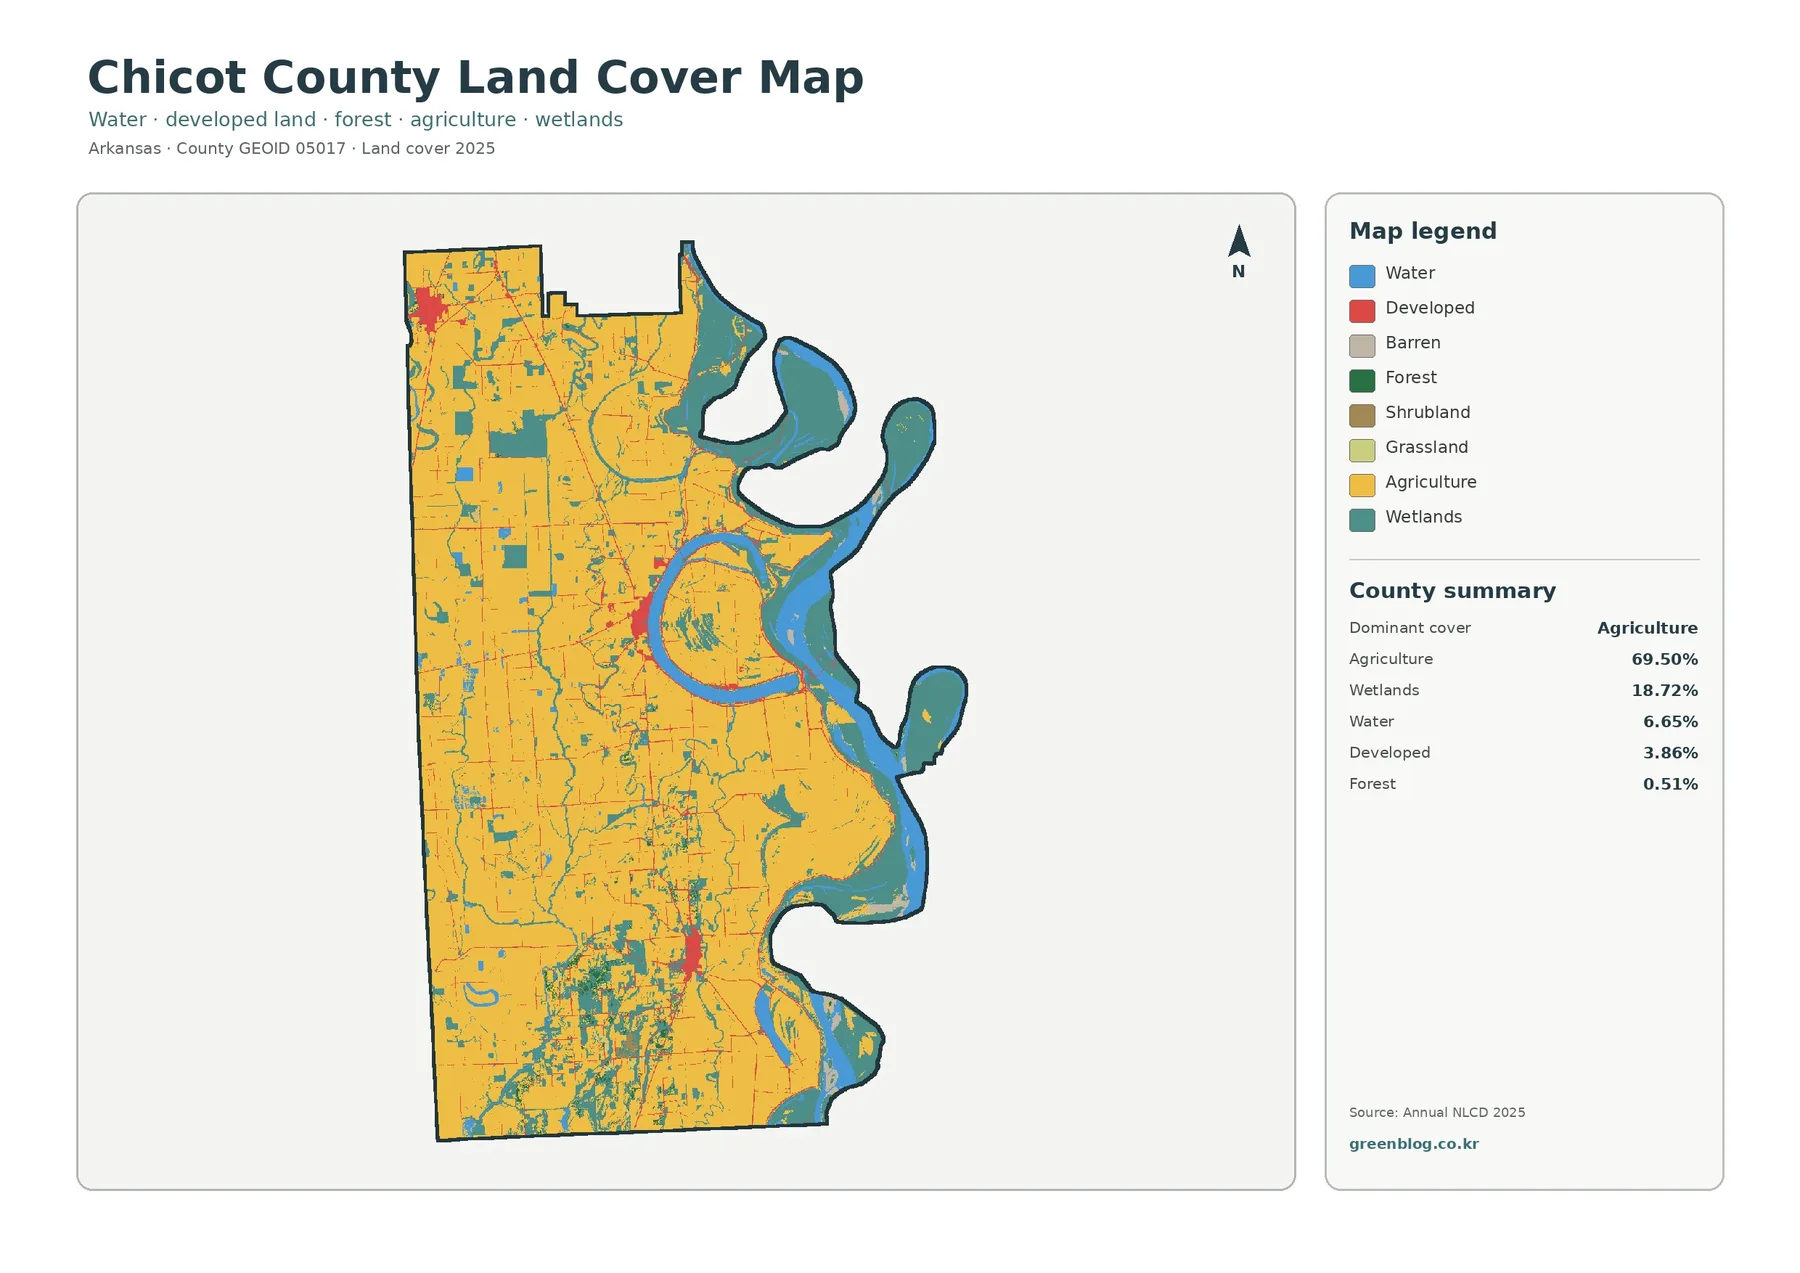
Agriculture is the dominant class at 69.50%. Yellow fills most of the county interior in large, connected areas, creating the clearest visual pattern on the map. Wetlands account for 18.72% and water for another 6.65%, so more than one quarter of the county summary is represented by those two water-related categories together. Their distribution is not uniform: the eastern edge, the Lake Chicot area, and several channels or low-lying corridors contain much denser concentrations than the broad agricultural interior.
Developed land represents 3.86% of the summary. Red areas appear as compact clusters and narrow lines within the agricultural matrix rather than as a continuous urban belt. Forest is only 0.51%, while grassland and shrubland are also minor classes in the county summary. The small forest value is especially useful context because green patches can still catch the eye locally even though they occupy very little of the county as a whole.
The geometry of the map is as informative as the percentages. Straight-edged agricultural blocks dominate many interior areas, while water and wetlands follow curves, bends, and irregular margins. The eastern boundary itself is strongly sinuous because of the Mississippi River setting. That contrast makes the map useful for explaining how Delta agriculture and water-related land cover exist side by side rather than as two completely separate zones.
Hard surfaces occupy a small footprint inside a largely agricultural county
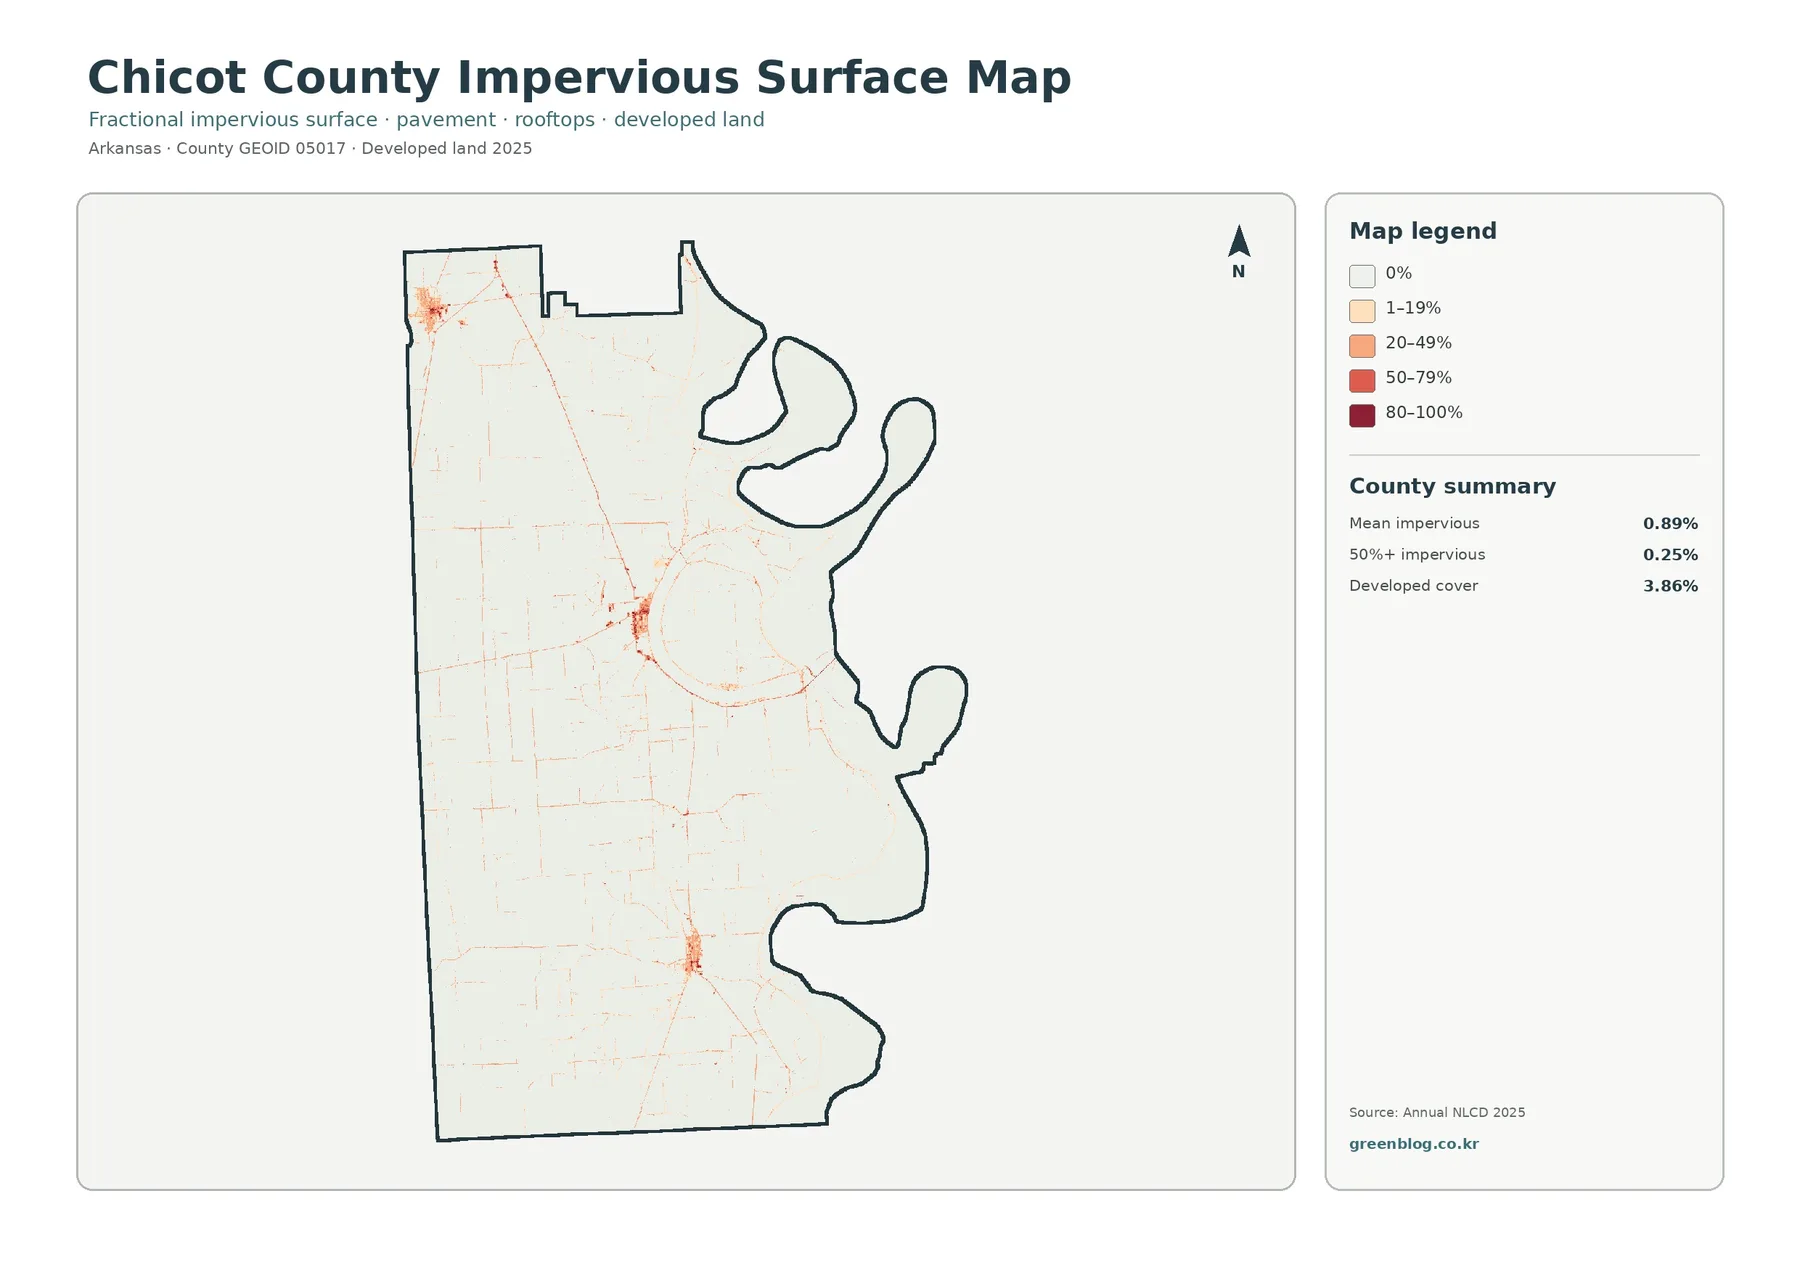
Impervious surface means pavement, rooftops, parking areas, and other hard surfaces that do not readily absorb rainfall. Chicot County has a mean impervious value of 0.89%, and only 0.25% of the county is mapped at 50% or more impervious surface. Most of the map is therefore very pale. Stronger orange and red tones are limited to a few centers and thin connecting lines, which is consistent with a county where fields, wetlands, and water occupy far more land than dense development.
The impervious numbers should not be treated as duplicates of the 3.86% developed-land figure. A developed land-cover class can include lawns, bare soil, trees, and other surfaces mixed with buildings and roads. The impervious product instead measures the fraction of each raster cell covered by hard surfaces. A low-density developed area can therefore be counted as developed land while still having a relatively small impervious fraction.
The most noticeable hard-surface concentrations occur in compact nodes, including the east-central area around the Lake Village setting, with other smaller concentrations toward the northwest and south. The Association of Arkansas Counties identifies Lake Village as the county seat, and the University of Arkansas Extension office is also located there. Those references help place the east-central cluster in local context, although this map is not detailed enough to identify individual streets, buildings, or property boundaries.
The forest-and-farmland view strips the pattern down to fields, wetlands, and water
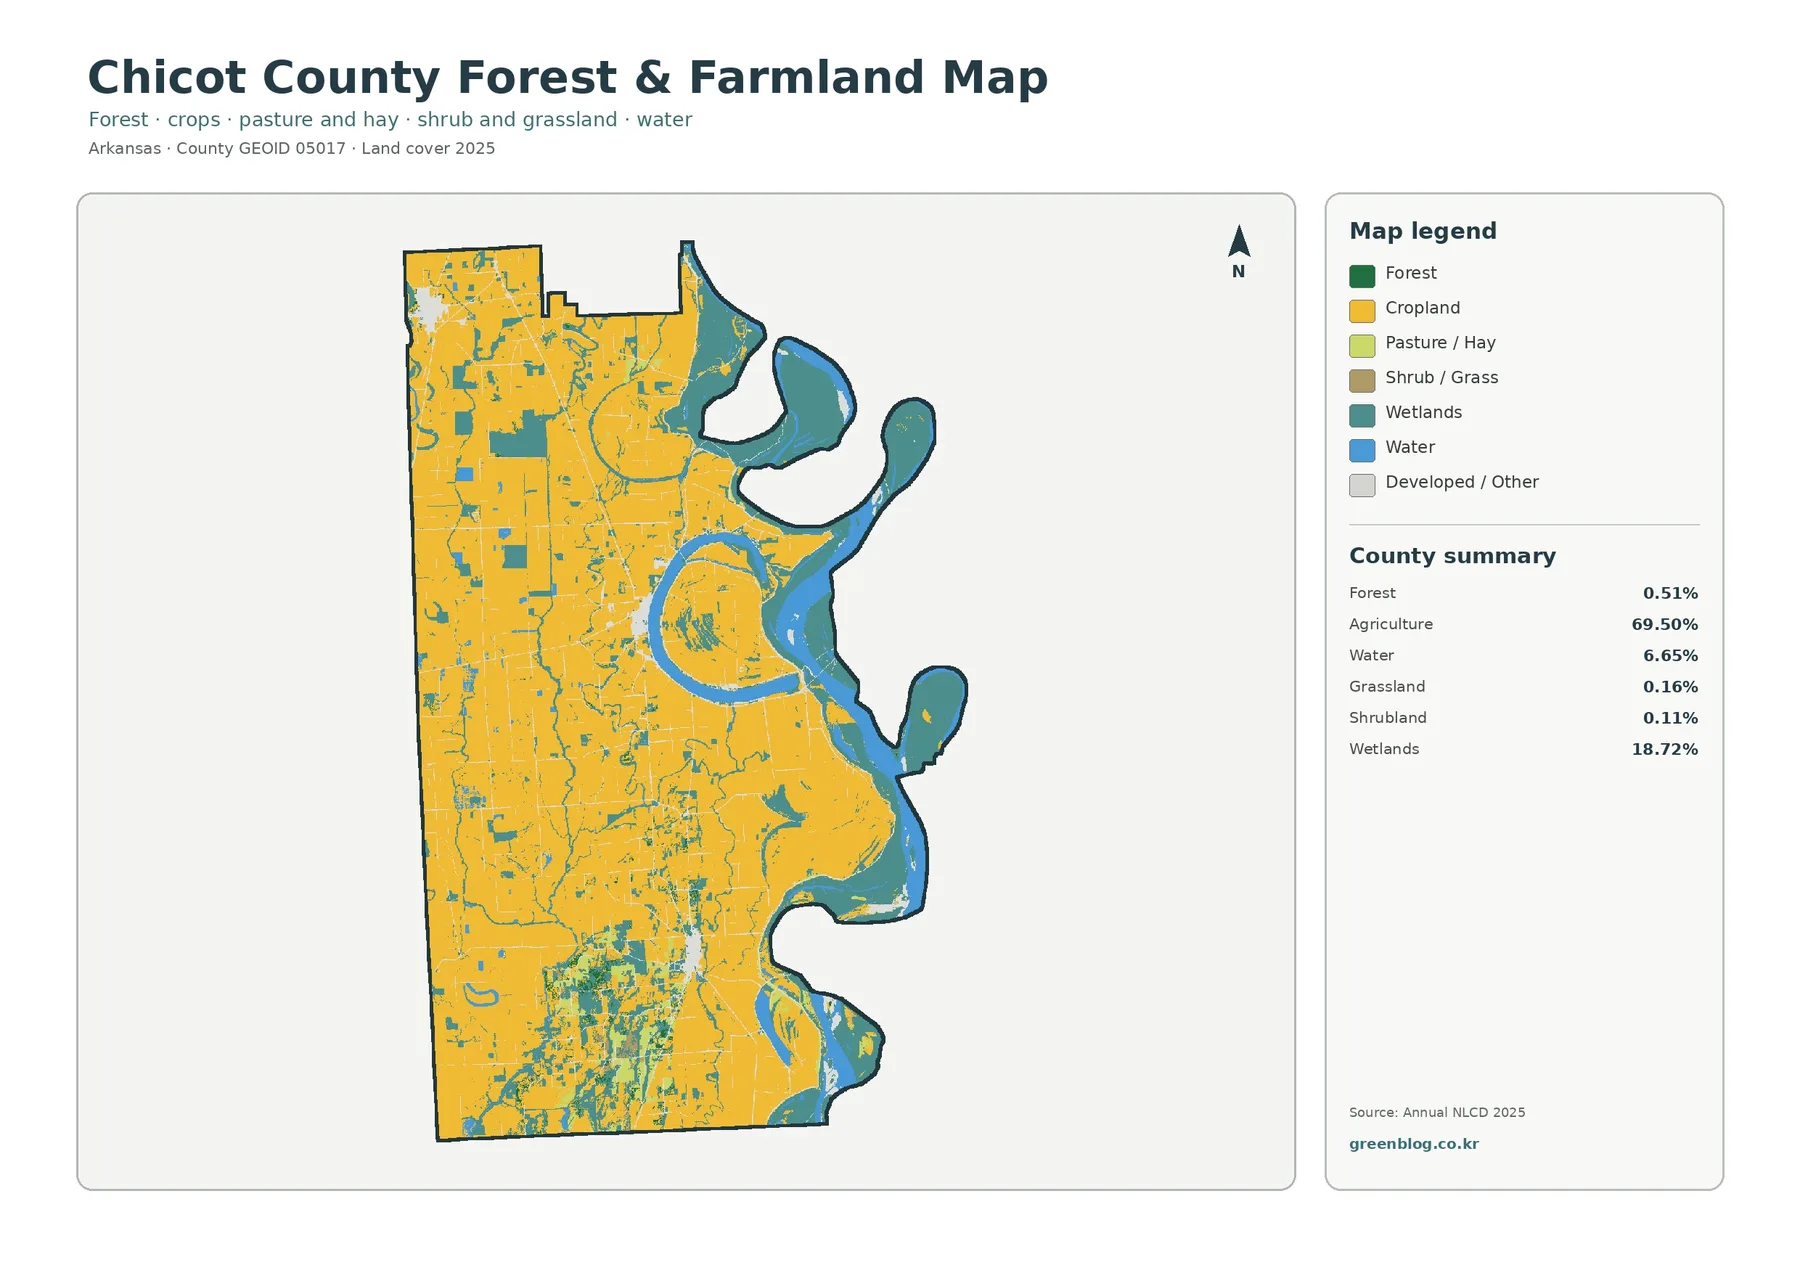
Because forest is only 0.51%, the forest-and-farmland map does not show a contest between two equally large cover types. Agriculture remains the overwhelming land-based class. Cropland colors form wide blocks across the county, while wetlands and water interrupt them along the east and through smaller channels and low areas. This simplified view is useful when the goal is to separate productive open land from water-related cover without the extra developed and minor classes competing for attention.
The southern part of the county contains more visible wetland patches mixed into the agricultural background than many interior areas. Near the eastern side, those patches become larger and more connected to the river-and-lake environment. Farther west, agriculture generally appears more continuous. The result is a county where the same dominant agricultural class looks different depending on whether it lies in the interior or near a wetter edge.
The legend distinguishes cropland, pasture or hay, shrub and grassland, wetlands, water, and forest, but the county summary groups agriculture at 69.50%. A map like this cannot tell the reader which crop was planted in a particular field. For crop-specific context, the county Extension program is a better companion source because it discusses local row crops and agricultural services. The map supplies the surface pattern; the agricultural source supplies subject-specific local information.
Lake Chicot and the Mississippi River side explain why wetlands matter so much
A single county percentage can hide where a class is actually located. Chicot County’s 18.72% wetland share is concentrated enough to change the appearance of the eastern side of every cover map. Around Lake Chicot and along the Mississippi River edge, wetland colors frequently sit next to open water. Farmland reaches close to many of those wet areas, creating sharp transitions between large field blocks and irregular aquatic margins.
Arkansas State Parks describes Lake Chicot as an oxbow lake associated with an older Mississippi River channel and highlights its cypress environment. That official description provides useful local context for the wetland pattern visible around the lake. It does not mean every mapped wetland belongs to the state park, however. Park boundaries, regulated wetlands, flood zones, and land-cover classes are separate datasets and should not be substituted for one another.
For environmental education, the combination of farmland, wetlands, and open water makes this map set useful for discussing edge relationships. A student can compare where fields stop, where wetland cover becomes more frequent, and where open water forms a continuous feature. Those observations are supported by the map. Claims about why a particular field was drained, protected, flooded, or converted would require additional historical or local records.
The 1985–2025 comparison shows scattered class differences rather than one sweeping conversion front
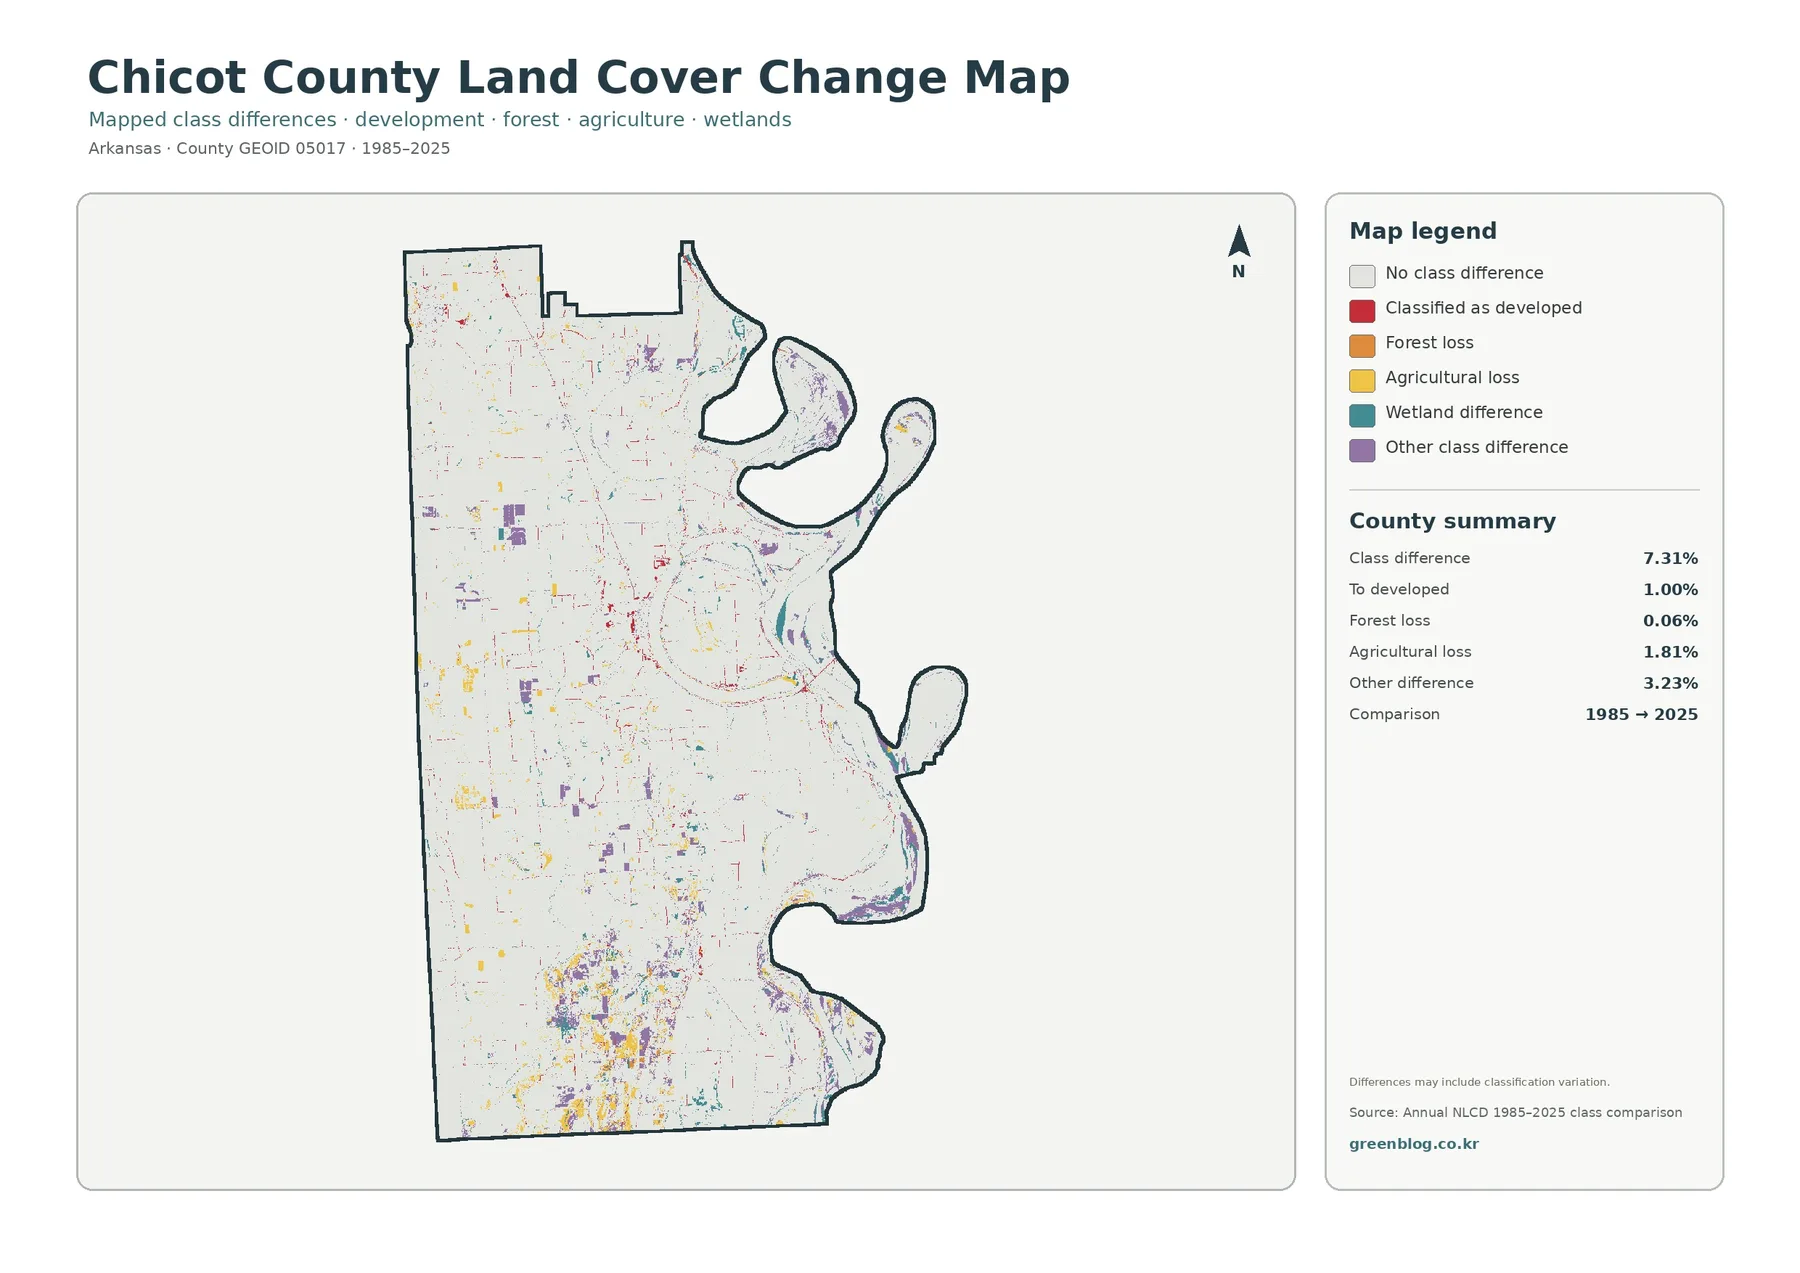
The change summary reports class differences across 7.31% of Chicot County between 1985 and 2025. It lists 1.00% as changed to developed, 1.81% as agricultural loss, 0.06% as forest loss, and 3.23% as other difference; wetland difference is also represented in the legend. These values describe cells whose classifications differ between the two comparison years. They are not the same as the 2025 share of each land-cover class.
Most of the map is the pale no-difference background. Colored changes appear as small patches, narrow lines, and clusters in several parts of the county. The south contains a noticeable mix of change colors, while the eastern river-and-wetland margin also has scattered differences. Agricultural interior areas contain smaller change patches as well. There is no single broad band that suggests the whole county changed in one direction at the same time.
Agricultural loss is particularly easy to misread. The 1.81% figure should not be subtracted directly from the 2025 agriculture share of 69.50%. One number describes a class-difference category between two dates, while the other describes the mapped condition in 2025. The same caution applies to the 1.00% changed-to-developed figure and the current developed share of 3.86%.
The map itself notes that differences may include classification variation. A colored cell can represent real land-cover change, but image conditions, classification decisions, and mixed surfaces within a raster cell can also affect the result. If the question concerns a particular tract or a specific development event, this county map should be used as a screening reference and followed by historical aerial imagery, local records, or field information.
Frequently Asked Questions
What is the dominant land cover in Chicot County in 2025?
Agriculture is dominant at 69.50% in the supplied 2025 county summary. Wetlands account for 18.72%, water 6.65%, and developed land 3.86%. The agricultural cover is widespread across the interior, while wetlands and open water are much more prominent along the Mississippi River side and around Lake Chicot.
Why is developed land 3.86% when mean impervious surface is only 0.89%?
They measure different things. Developed land is a land-cover class that can include vegetation or soil mixed with buildings and roads. Impervious surface measures the fraction covered by hard materials such as pavement and rooftops. Low-density developed areas can therefore increase the developed-land total without producing a high average impervious percentage.
Does the 7.31% change figure mean 7.31% of Chicot County was developed?
No. The 7.31% value is the total share of cells with a mapped class difference between 1985 and 2025. The summary separately identifies 1.00% as changed to developed and also includes agricultural loss, forest loss, wetland differences, and other differences. The map warns that classification variation can contribute to the comparison. Map File Information The ZIP contains the four original JPG maps discussed on this page: 2025 land cover, forest and farmland, impervious/developed land, and the 1985–2025 land-cover change comparison.
Thirty-meter raster cells are useful for patterns, not parcel decisions
Annual NLCD is a raster product derived from satellite imagery. USGS states that Annual NLCD is produced at 30-meter spatial resolution, meaning the landscape is generalized into grid cells rather than surveyed as individual property polygons. Narrow roads, small buildings, drainage ditches, field edges, and thin wetland strips can fall within mixed pixels where more than one real surface occurs inside the same cell.
The 2025 land-cover map describes the mapped condition for that observation year. Later construction, crop changes, flooding, restoration work, or other recent events may not appear. Agricultural surfaces can also look different through the growing season. For current site-level work, a user should combine these county maps with newer imagery or local data instead of assuming that every cell still represents present-day conditions.
Neither the wetland color nor the developed color is a legal designation. The map does not establish a regulated wetland boundary, floodplain, zoning district, ownership line, development permit area, or property boundary. It is best used to understand broad county patterns and to identify places that may deserve closer study with the appropriate official dataset.
Map File Information
Download the map files associated with this page for reference, printing, and compatible visual projects.
- Included Files: Use only the versions confirmed in the article and supplied images
- File Type: Use the confirmed download contents
- Intended Use: Printing, education, presentations, and map-based projects
Related Maps
- Arkansas County Arkansas Land Cover Map
- Ashley County Arkansas Land Cover Map
- Baxter County Arkansas Land Cover Map
Sources and References
- MRLC Annual NLCD Data — Annual NLCD product access and data information
- USGS Annual NLCD Collection 1.2 Land Cover — 2025 coverage, 30-meter resolution, and product documentation
- U.S. Census Bureau TIGER/Line Shapefiles — county boundary reference
- University of Arkansas Division of Agriculture – Chicot County — county-specific commercial agriculture and Extension programs
- Arkansas State Parks – Lake Chicot — official context for the oxbow lake and cypress environment
- Association of Arkansas Counties – Chicot — county seat and local government reference
Green Map creates custom-edited map images using open geographic data sources such as geoBoundaries, Natural Earth, OpenStreetMap, and government open data.
These maps are edited visual materials, not raw data files, and are provided for education, documents, presentations, and graphic reference.