Benton County has a balanced land-cover mix rather than one class covering most of the county. The 2025 summary places forest first at 39.09%, closely followed by agriculture at 35.45%, with developed cover at 19.66% and water at 4.22%. The map reflects those numbers clearly: agriculture is strongest in the west, forest and water become more prominent in the east, and a large developed concentration fills the Bentonville–Rogers area between them.
This page compares current land cover, forest and farmland, fractional impervious surface, and change from 1985 to 2025. The article uses WebP previews, while the four original JPG maps are available together in one ZIP download. They are useful for county-scale reference, classroom work, presentation graphics, and comparing where development, agriculture, forest, and water meet.
Table of Contents
The 2025 map shows the full land-cover mix
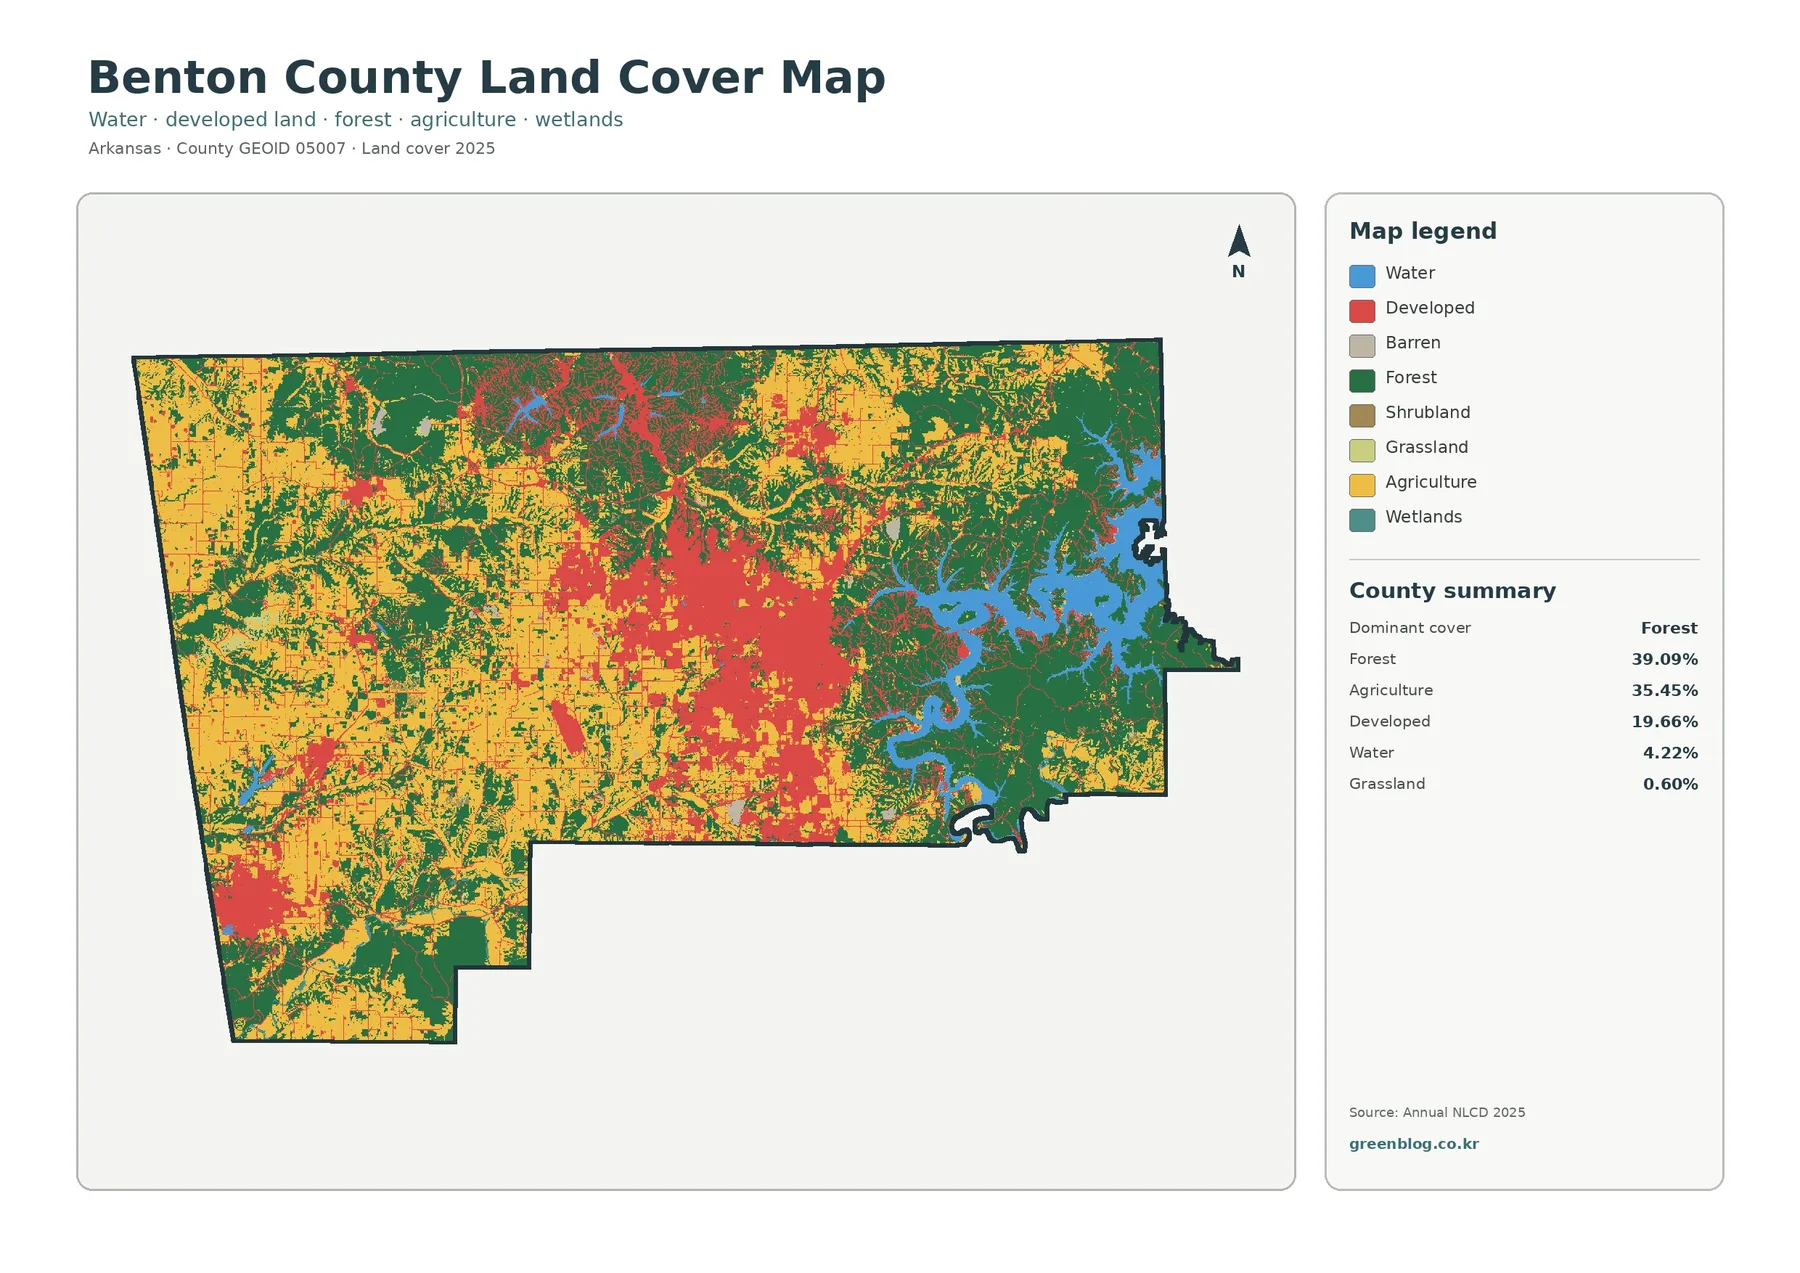
The current-cover map is the broadest view. Western agriculture appears in large blocks broken by forest patches and smaller developed areas. Near Bentonville and Rogers, red developed cover becomes much larger and more continuous, although forest and agricultural cells remain around its edges. In the east, green forest takes over again and blue water reaches into it through long coves and narrow arms.
The eastern water pattern is easier to understand with regional context from the U.S. Army Corps of Engineers, which manages Beaver Lake on the White River in northwest Arkansas. The preview does not label every cove, so it is safer to use that source for orientation rather than assign a name to each blue feature. The forest-and-farmland summary also reports smaller shares of grassland at 0.60%, shrubland at 0.38%, and wetlands at 0.15%.
Forest and farmland are clearer in the simplified view
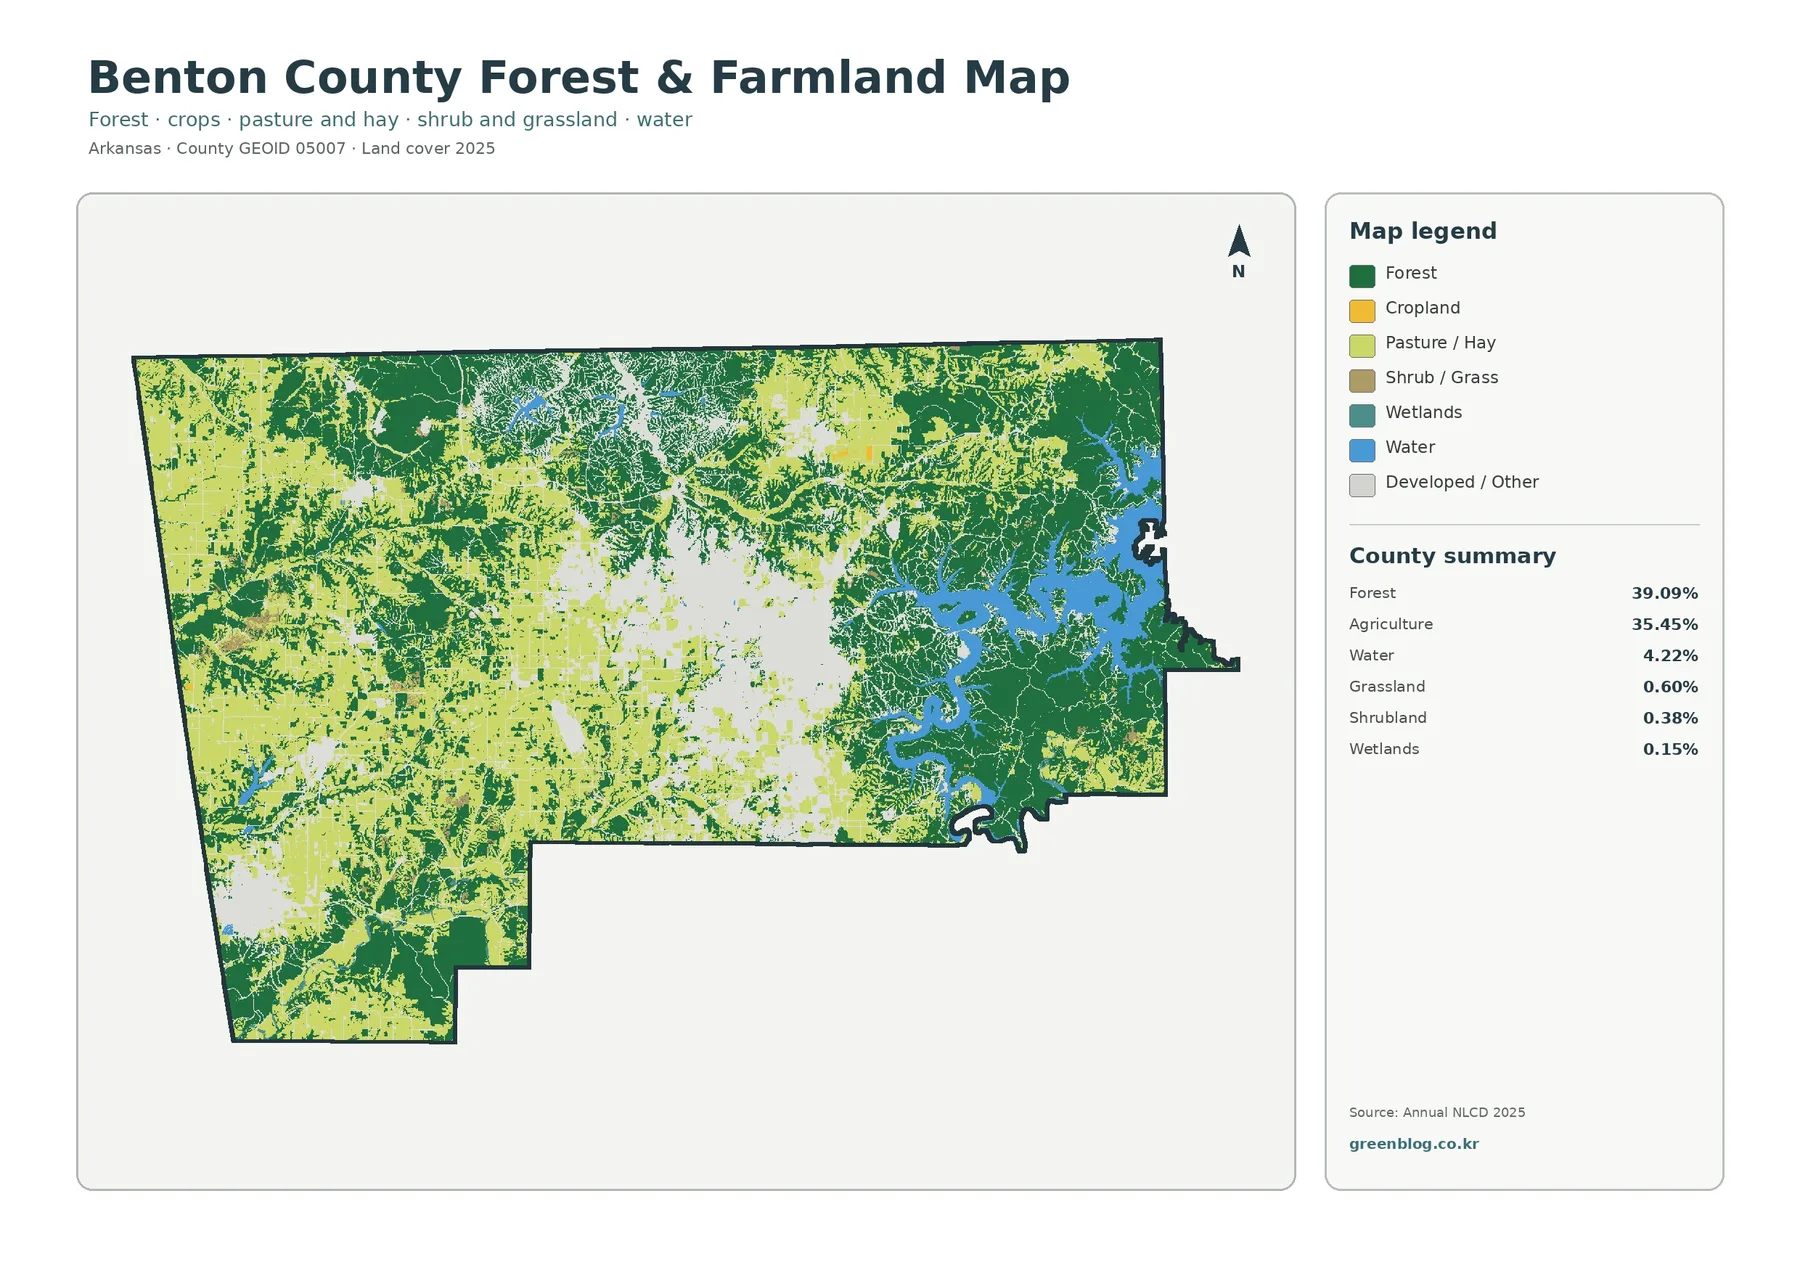
With fewer competing classes, the west-to-east contrast is easier to see. Agriculture at 35.45% dominates much of the west, while forest at 39.09% becomes broader and more connected toward the east. The central developed area separates the two strongest vegetated patterns. Forest also remains extensive around the lake shoreline, and Benton County’s official basemap places Hobbs State Park–Conservation Management Area in this eastern landscape.
Land cover should not be confused with legal land use. Agricultural colors represent mapped ground cover such as cropland and pasture or hay, not farm ownership or parcel boundaries. Forest is a physical cover class, not a park or conservation boundary. Benton County Planning publishes subdivision, site-plan, stormwater, and floodplain information separately, which should be used when the question concerns permits or development rules rather than what covers the ground.
Impervious surface isolates the hard-built urban footprint
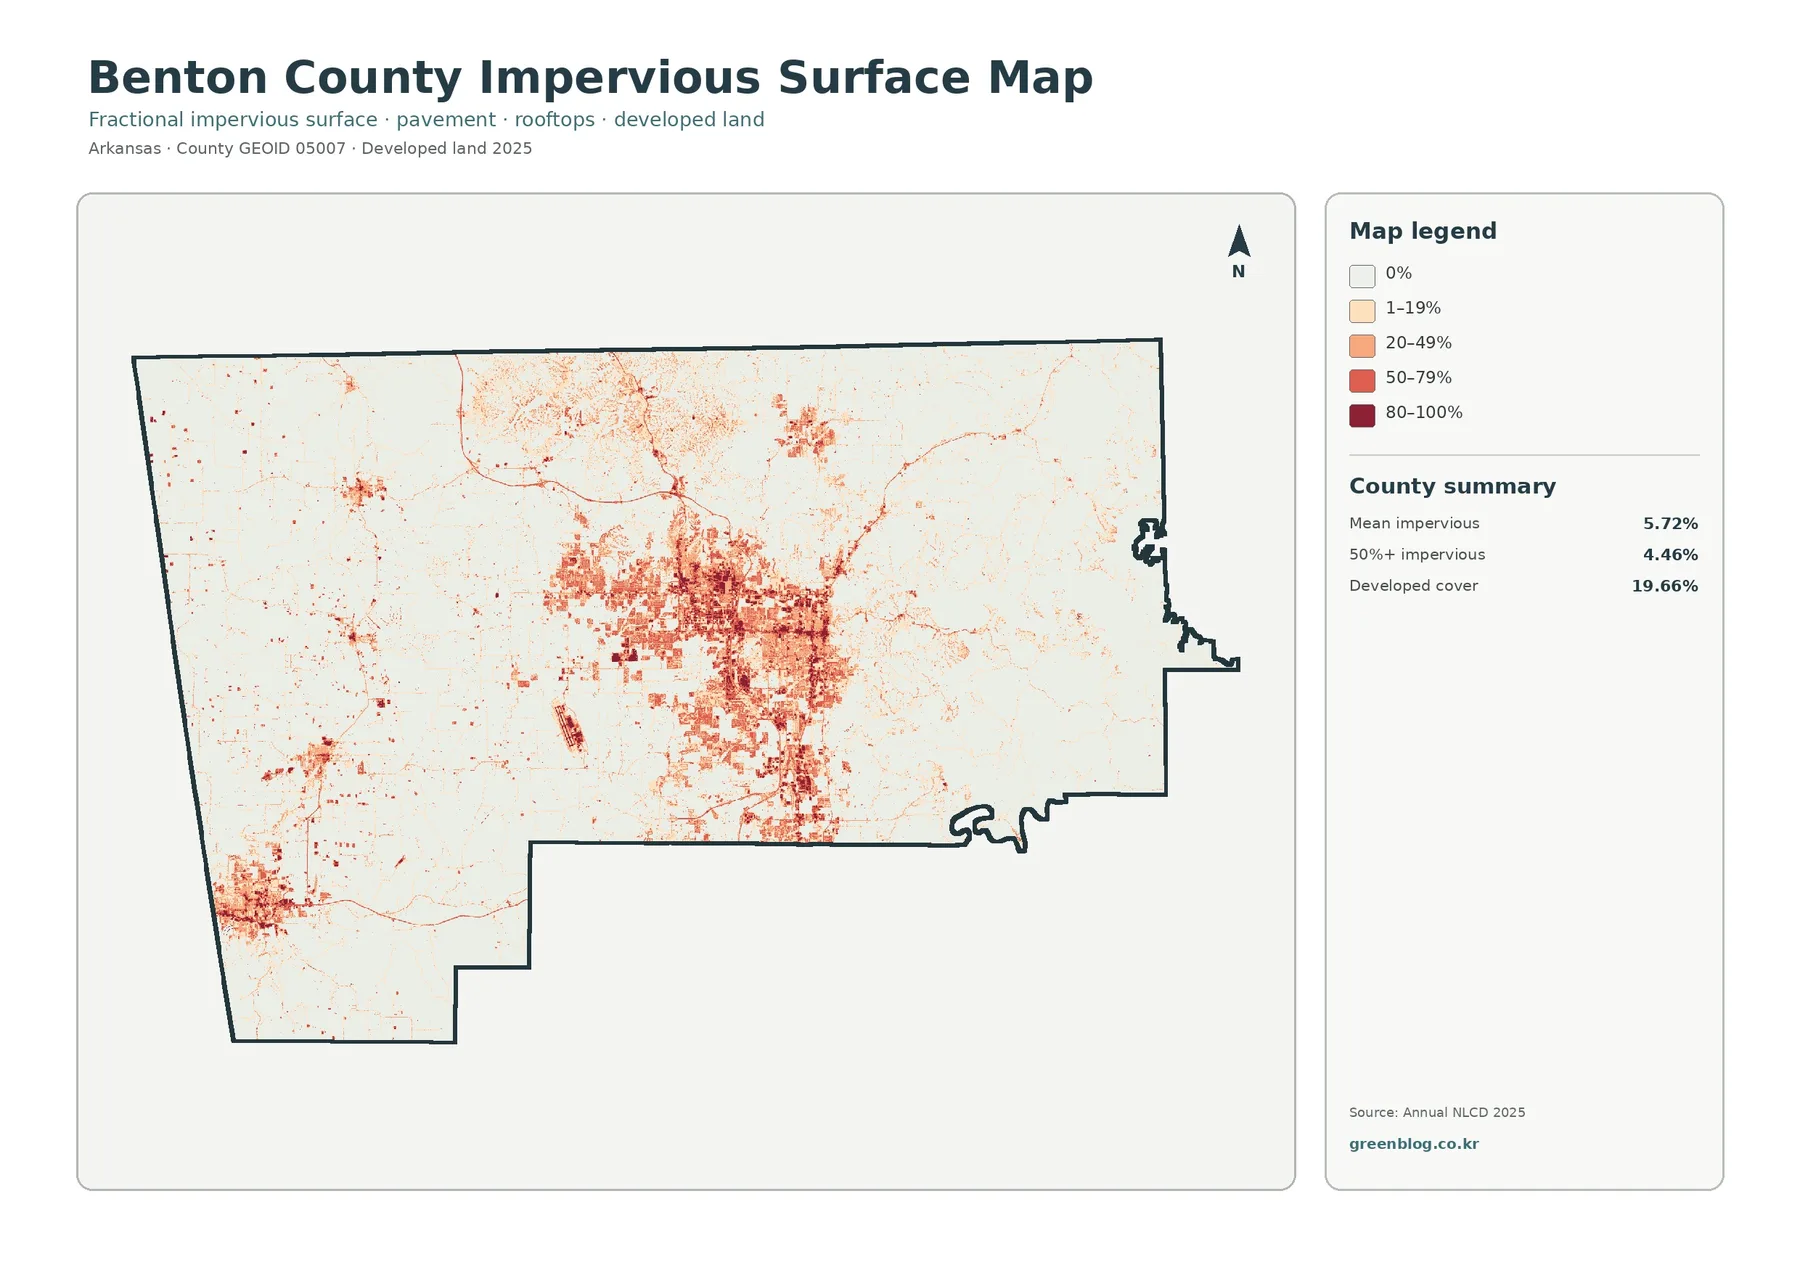
Impervious surface means pavement, parking areas, rooftops, and other hard cover that absorbs less water than soil or vegetation. Benton County’s mean impervious value is 5.72%, and 4.46% of the county is mapped at 50% or greater imperviousness. The highest values cluster around Bentonville and Rogers, while most western farmland and eastern forest remain light. Smaller hard-surface concentrations appear around other communities, including the southwest.
The 19.66% developed share is larger because developed land and impervious percentage are different measures. A low-density neighborhood can be classified as developed even when lawns and trees occupy much of a 30-meter cell. Imperviousness measures the hard-surface fraction inside the cell, so the darkest values are more concentrated around dense built areas and major facilities. Reading both maps prevents the mistake of treating every developed cell as fully paved.
The 1985–2025 comparison highlights change to developed
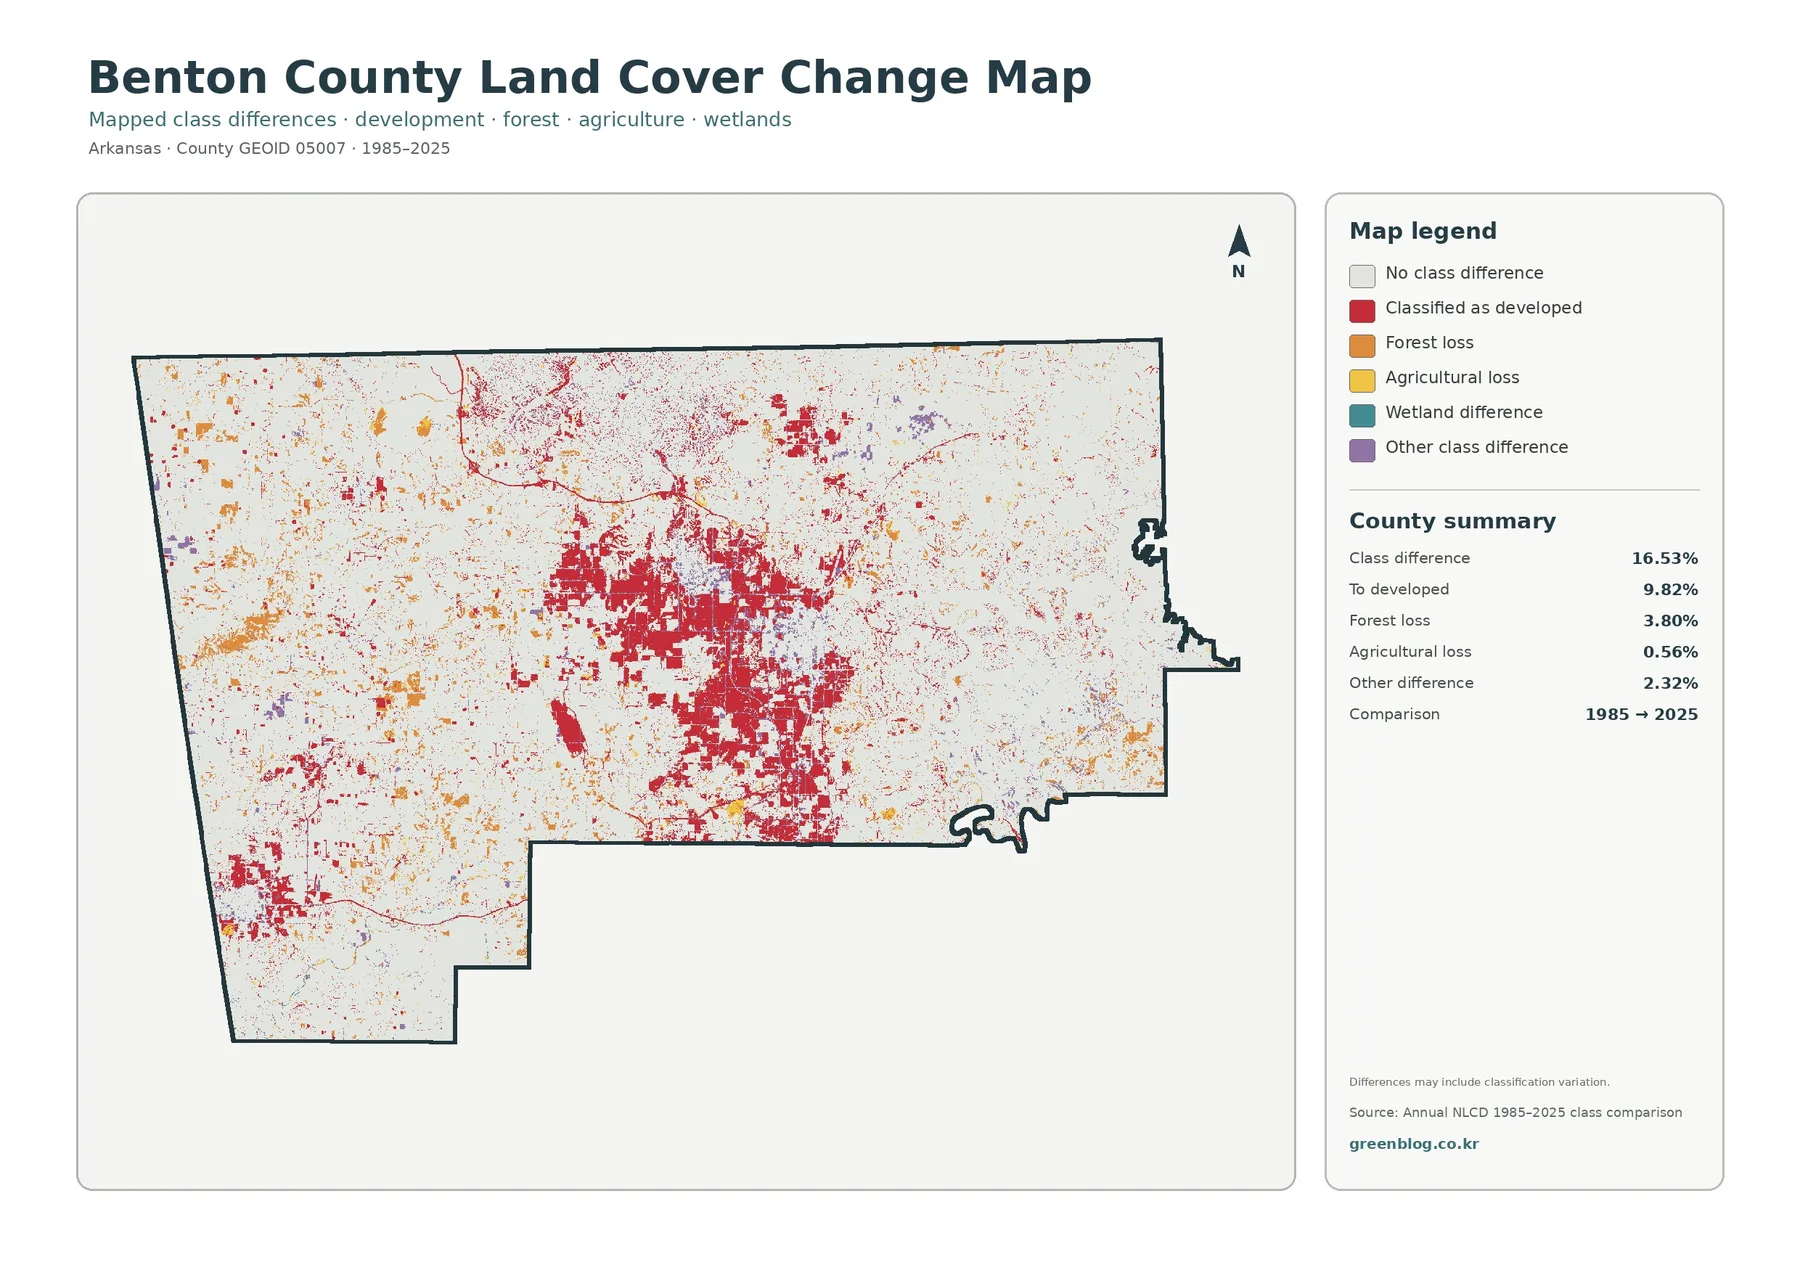
The change map marks grid cells whose representative class differs between 1985 and 2025. The total class difference is 16.53%. Change to developed is the largest named component at 9.82%, followed by forest loss at 3.80%, other difference at 2.32%, and agricultural loss at 0.56%. A wetland-difference class appears in the legend, but the supplied summary does not provide a separate percentage for it.
Red development-change cells are concentrated around today’s Bentonville–Rogers urban area and extend north and south of that core. A separate southwest cluster is visible around Siloam Springs. Large parts of western farmland and eastern forest remain in the no-class-difference category. The 16.53% figure therefore does not mean the whole county changed; it identifies the share of cells whose endpoint classification is different.
Forest loss should also be read cautiously. An endpoint class change does not automatically prove permanent clearing. Harvest and regrowth, true conversion to development or agriculture, boundary shifts, and classification differences can all contribute. The same limitation applies to agricultural loss. A good workflow is to use this map to locate areas of interest, then compare intermediate imagery, local planning records, or newer aerial photography before drawing conclusions about causes.
A 30-meter raster is useful at county scale, not parcel scale
Annual NLCD is a Landsat-based raster dataset with a typical 30-meter spatial resolution. The landscape is divided into grid cells about 30 meters across, and each cell receives a representative land-cover class or a fractional value such as imperviousness. This scale is useful for broad patterns, but narrow roads, small buildings, tiny ponds, and thin streams can be simplified or mixed with surrounding cover.
A mixed pixel contains more than one real-world surface. Mixed cells are common around city edges, farm-forest boundaries, and complex shorelines such as Beaver Lake. A sharp color boundary on the screen is therefore not a surveyed property line. The current products are labeled 2025 and the change map compares 1985 with 2025, so newer construction or vegetation changes are not represented. Parcel decisions require local GIS, surveys, or field information.
Choosing the right map for a report or class project
Use the current land-cover map when one image needs to explain the entire county. The forest-and-farmland view is better for comparing western agricultural areas with eastern forest. Impervious surface is the clearest choice for locating concentrated hard-built surfaces, while the change map directs attention to places whose classification differs between 1985 and 2025. Matching the map to the question keeps the explanation focused and avoids forcing one product to answer everything.
Download the four Benton County JPG maps
The ZIP contains four original JPG files: the 2025 land-cover map, forest and farmland map, impervious surface and developed-land map, and the 1985–2025 land-cover change map. Each JPG is 2480×1754 pixels, larger than the 1800-pixel-wide WebP previews used in the article. The originals are suitable for documents, slides, handouts, and saved county references where a larger image is helpful.
Keep the legend, title, and year visible when possible. The change map depends on its 1985 and 2025 endpoints, while the impervious map measures hard-surface fraction rather than the broader developed class. These files are designed for county-scale interpretation and presentation and should not be treated as parcel surveys, engineering plans, or legal boundary documents.
Frequently Asked Questions
What is the dominant land cover in Benton County?
Forest is the largest 2025 class at 39.09%, with agriculture close behind at 35.45%. Agriculture is strongest in the west, while forest becomes more extensive toward the east. Developed cover accounts for 19.66% and is concentrated around the Bentonville–Rogers area, while water at 4.22% is most prominent in the east.
Why is developed cover 19.66% when mean imperviousness is 5.72%?
They measure different things. Developed cover is a land-cover class and can include lower-density areas with substantial grass and trees. Imperviousness measures the fraction of pavement, rooftops, and other hard surfaces within each grid cell. A location can therefore be classified as developed while still having a relatively low impervious percentage.
Does the 16.53% class difference mean that much of Benton County became urban?
No. The 16.53% figure includes all endpoint class differences between 1985 and 2025. The summary reports 9.82% as change to developed, 3.80% as forest loss, 0.56% as agricultural loss, and 2.32% as other difference. A wetland-difference category is also mapped without a separate percentage. Causes require additional imagery and local records.
Map File Information
Benton County Land Cover Maps — 4 JPG Files
- Included Files: Use only the versions confirmed in the article and supplied images
- File Type: Use the confirmed download contents
- Intended Use: Printing, education, presentations, and map-based projects
Related Maps
- Arkansas County Arkansas Land Cover Map
- Ashley County Arkansas Land Cover Map
- Baxter County Arkansas Land Cover Map
Sources and references
Land-cover data and annual products are available from MRLC Annual NLCD Data, and class definitions are documented by the USGS Annual NLCD Land Cover Classification.
City, road, park, and county mapping context can be checked through Benton County Government GIS. Development, stormwater, and floodplain information is published by the Benton County Planning Department.
Regional lake information is available from the U.S. Army Corps of Engineers Beaver Lake project, and official county boundary data are available through U.S. Census Bureau TIGER/Line Shapefiles.
Green Map creates custom-edited map images using open geographic data sources such as geoBoundaries, Natural Earth, OpenStreetMap, and government open data.
These maps are edited visual materials, not raw data files, and are provided for education, documents, presentations, and graphic reference.