Forest is the dominant 2025 land-cover class in Oswego County, accounting for 51.14% of the mapped area. Wetlands add another 16.83%, agriculture 15.01%, developed land 9.77%, and water 6.26%. Together, those values match the map’s broad visual pattern. Wooded country is extensive across the north and east, while larger farm patches, wet ground, and compact developed centers stand out elsewhere.
Four map views are provided here so the county can be examined from different angles rather than reduced to one percentage. The set covers current land cover, forest and farmland, impervious/developed surfaces, and mapped class differences between 1985 and 2025. The four original JPG files are also available together in one ZIP download for printing, reports, presentations, classroom use, or side-by-side comparison.
Table of Contents
Hard surfaces are concentrated even though developed land covers nearly one tenth of the county
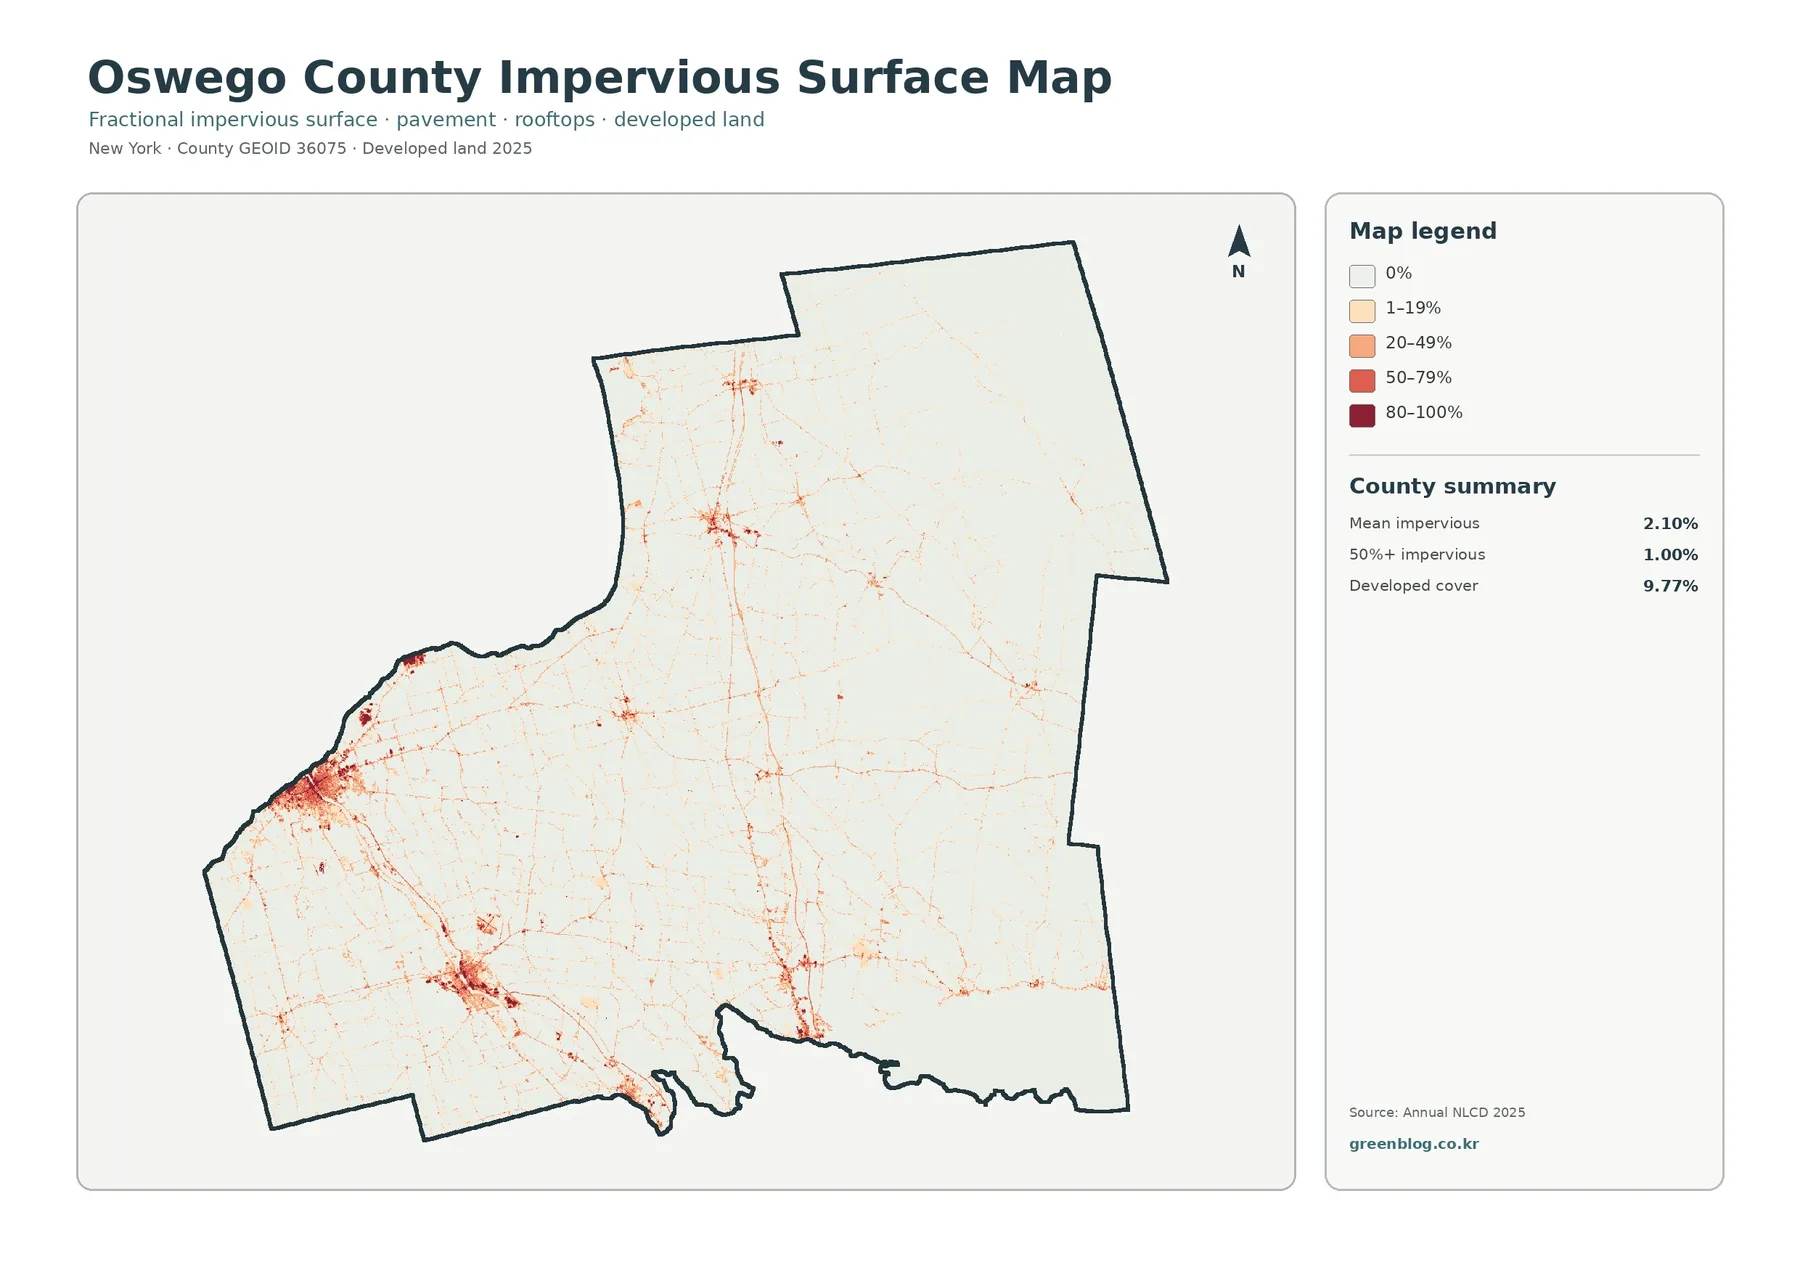
Hard-surface percentages make the county’s settled footprint much easier to separate from its forested and rural surroundings. Mean impervious surface is 2.10%, while only 1.00% of the county is mapped at 50% impervious or higher. Those figures are well below the 9.77% developed-land share because a developed land-cover class can include lawns, trees, gardens, and other permeable surfaces around buildings and roads.
The strongest cluster appears near the Lake Ontario shore around the City of Oswego. Another band of higher values extends southward toward Fulton, while smaller concentrations appear at other settlement centers and along connecting routes. Most of the county remains very light on this map, showing that hard surfaces are not distributed at the same intensity across the large forest and wetland areas.
Oswego County planning documents describe the Oswego River corridor as a link between the inland waterways and Lake Ontario, passing through the urban areas of Fulton and Oswego. That geographic setting helps explain why several of the most visible hard-surface concentrations sit in the same broad corridor. Nothing in this layer establishes that a river or road caused development; it only shows that built surfaces and established settlement areas occur close together.
Imperviousness is particularly useful when a general developed class is too broad for the question at hand. A suburban or low-density residential cell may be classified as developed while still containing a large share of grass and tree cover. A compact block with parking, rooftops, and streets can occupy less land but appear much darker. Reading both layers prevents the mistake of treating developed acreage and hard-surface intensity as the same measure.
This layer can support watershed lessons and planning discussions, but it is not a flood-risk map. Runoff depends on rainfall, slope, soil, drainage systems, stream conditions, and other factors in addition to the amount of pavement or roofing. For hazard work, this layer is best treated as one piece of surface information rather than a stand-alone assessment.
The 2025 land-cover map shows a forest county with a large wetland component
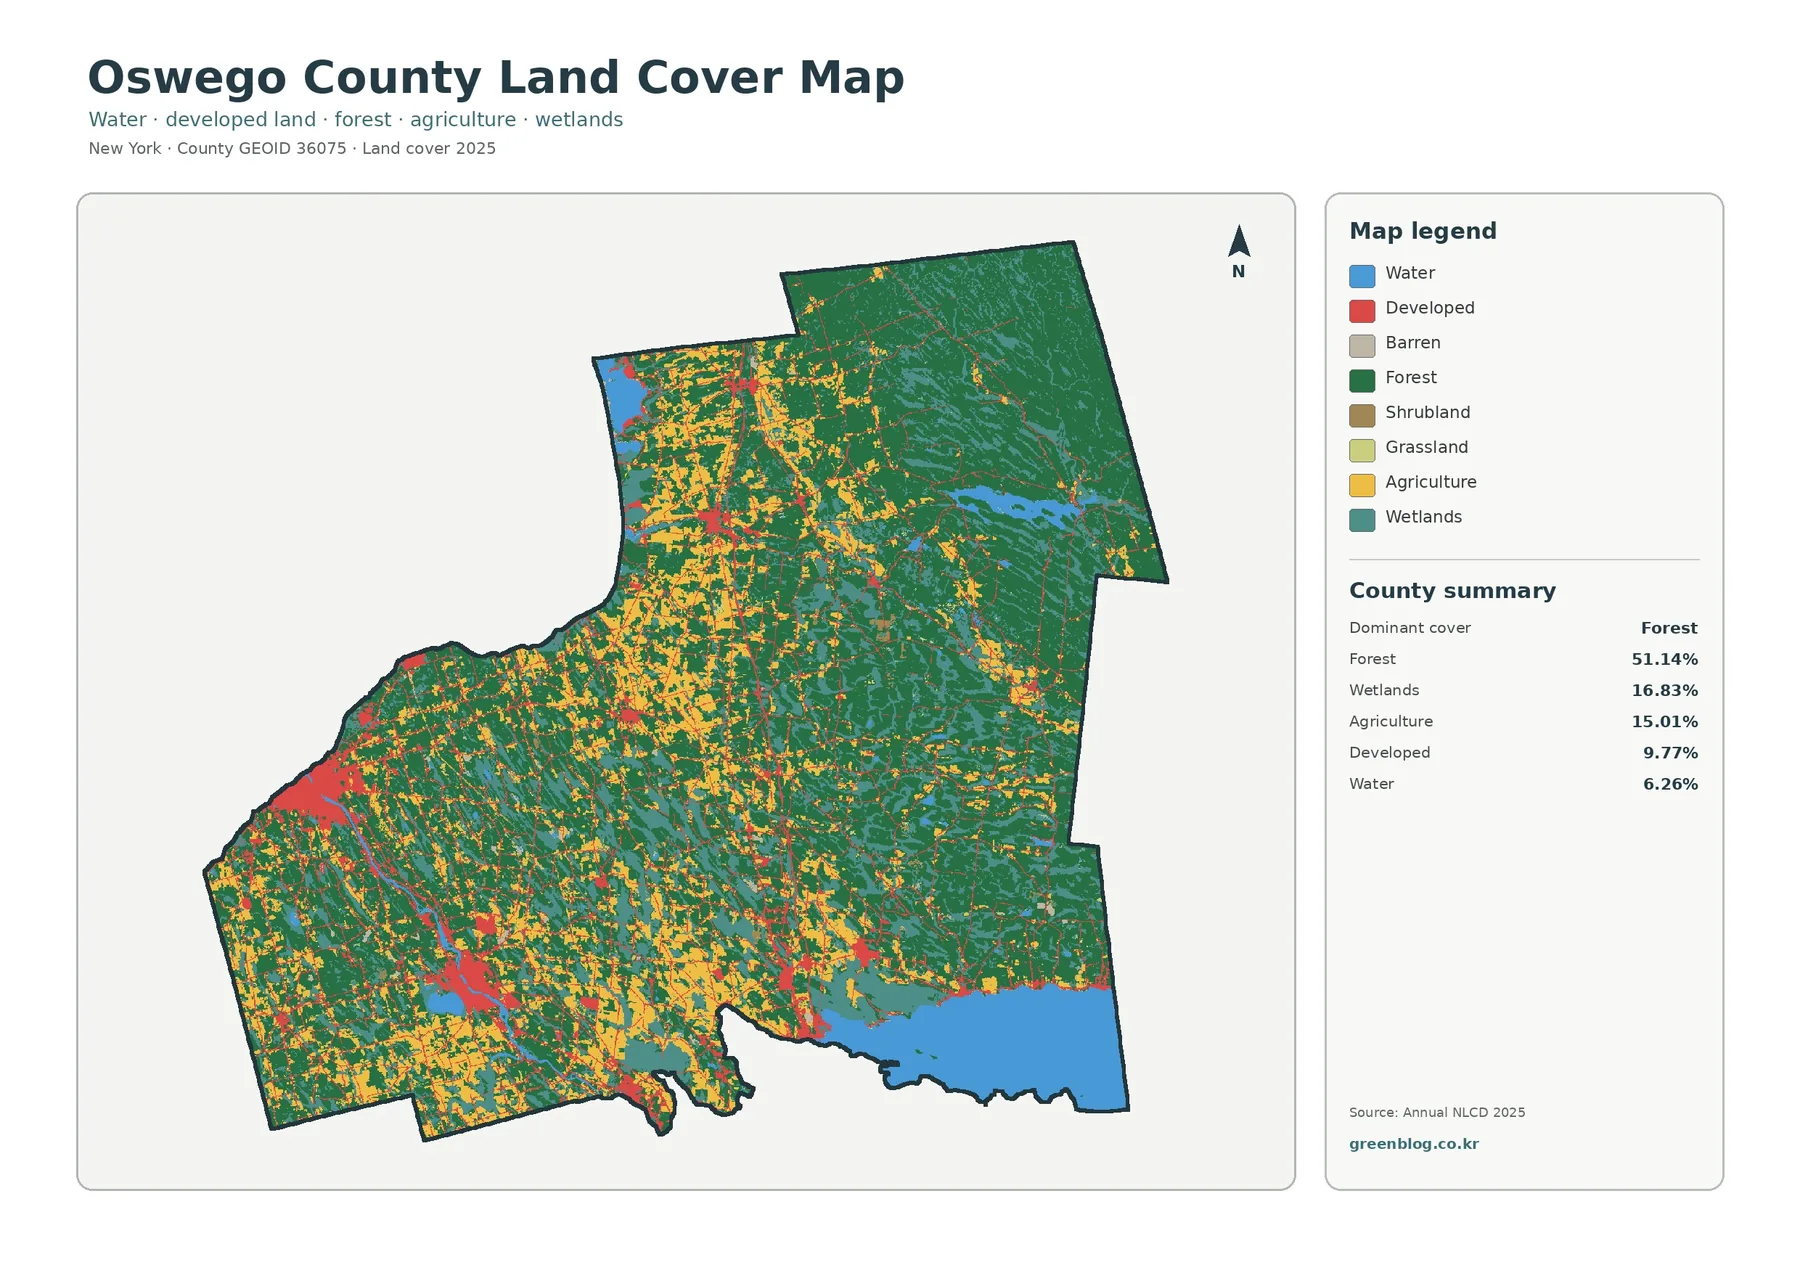
Green forest classes form the broad background of the current map, especially in the northern and eastern parts of the county. Yellow agricultural patches become more frequent across the west, southwest, and portions of the central area. Red developed cover is comparatively compact. Teal wetlands weave through the forest and expand into larger patches in several central and eastern areas, while blue water creates some of the map’s strongest geographic anchors.
The summary numbers reinforce that first impression. Forest at 51.14% is more than three times the agricultural share and more than five times the developed share. Wetlands at 16.83% are slightly more extensive than agriculture at 15.01%, an important detail that is easy to miss if the county is described simply as wooded and rural. Water at 6.26% also has a substantial presence compared with many inland counties.
County sources place Oswego County along eastern Lake Ontario and western Oneida Lake and also identify the Oswego and Oneida Rivers among its major waters. Those features provide useful geographic context for the large blue areas and water-linked landscapes visible in the county map. Open water, wetlands, and forest frequently sit near one another, so the county’s natural cover is better understood as a mixture of wooded and wet environments than as a single continuous forest.
Developed cover appears around the same western and southern settlement areas that stand out on the impervious map. The general land-cover layer adds lawns, lower-density development, and nearby surface classes to that broader picture. It is therefore better for asking where developed land fits within the county’s overall surface pattern. By contrast, the impervious view is better for asking where the hardest, most built-up surfaces are concentrated.
Barren, shrub, and grass classes are present in the legend but do not define the county at this scale. A reader can understand the map more quickly by first comparing forest, wetlands, agriculture, developed land, and water, then looking for the smaller classes where local detail matters. That approach keeps the legend useful without turning the article into a list of every possible category.
Forest and farmland become clearer once developed and miscellaneous classes are muted
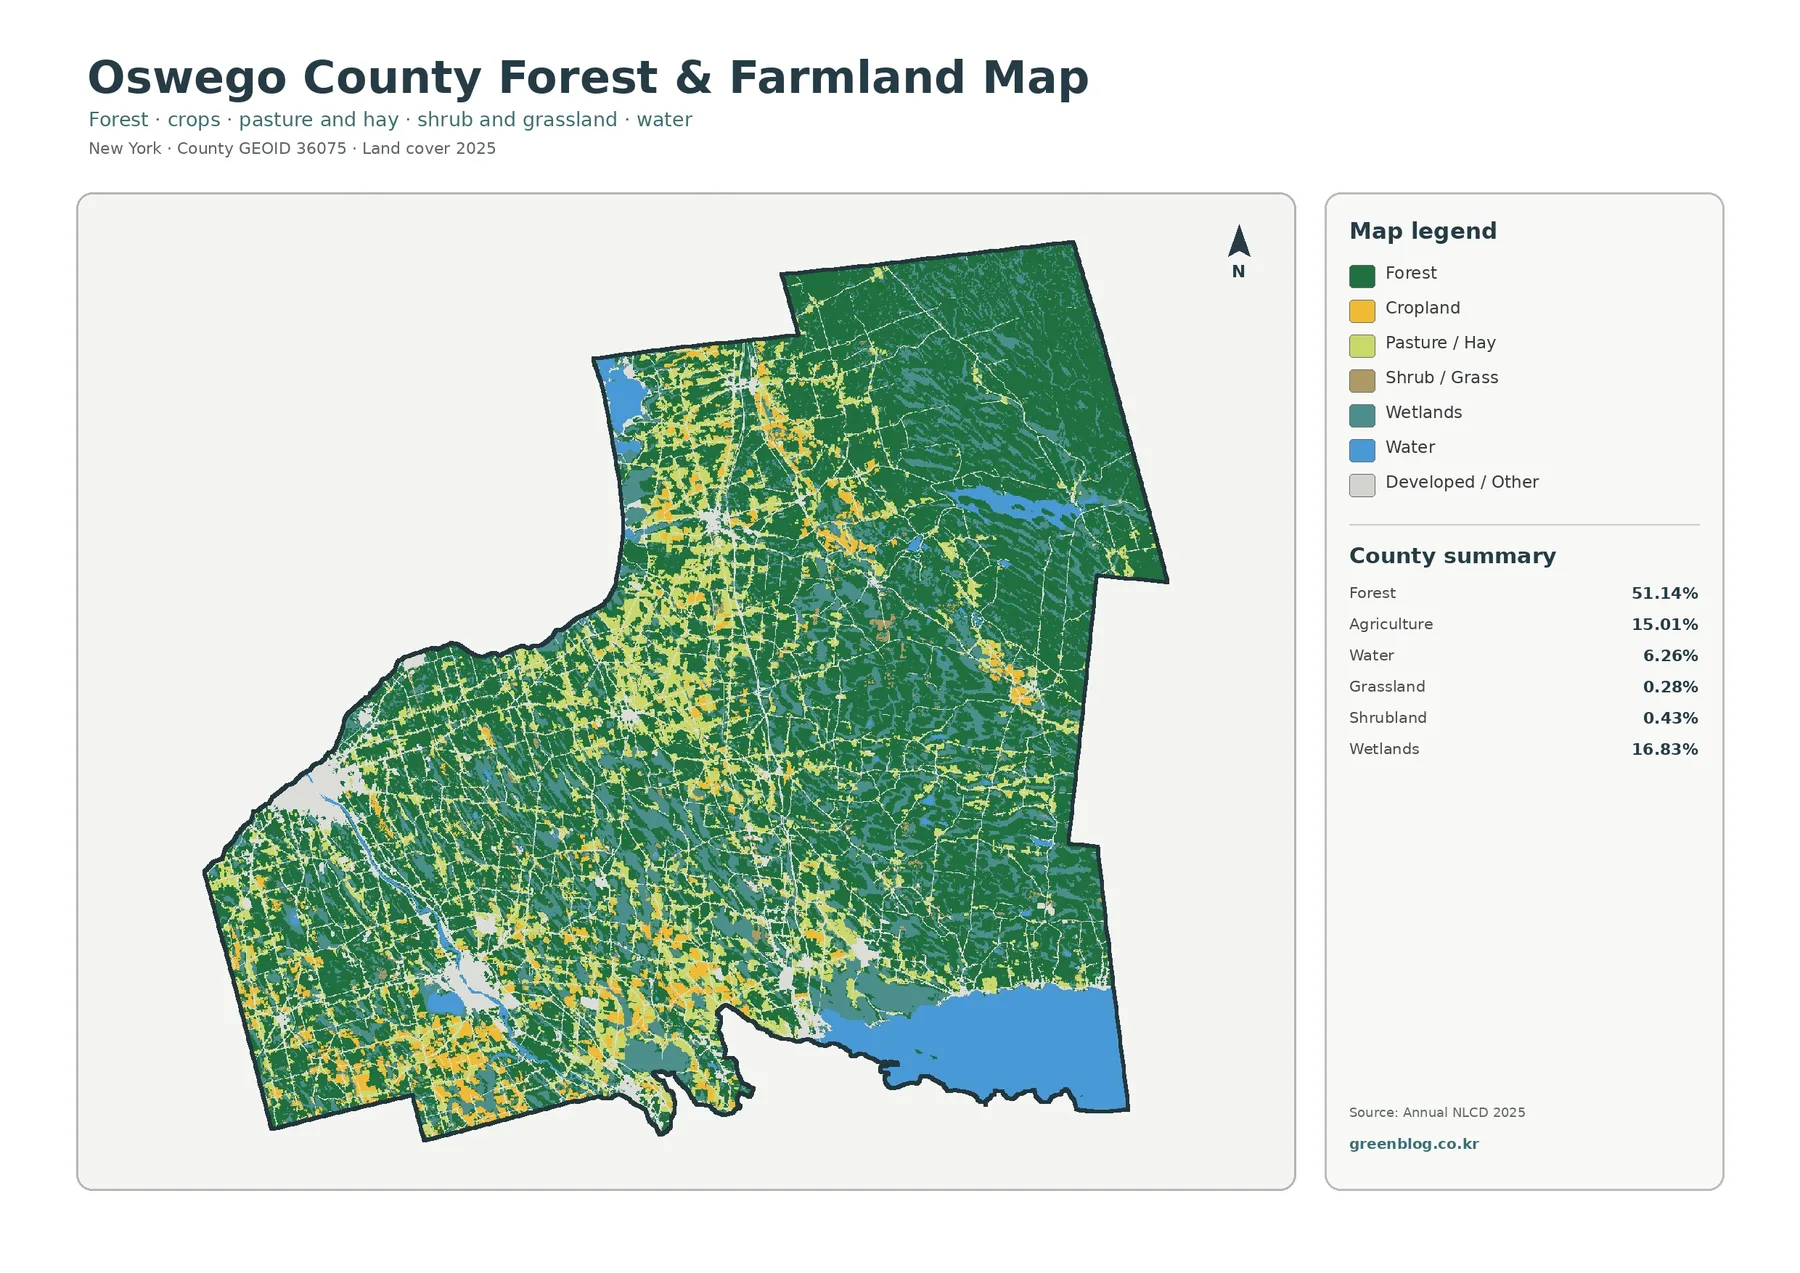
The forest-and-farmland view strips away much of the visual competition from developed and miscellaneous classes. Forest remains 51.14% of the county, agriculture 15.01%, wetlands 16.83%, and water 6.26%. Grassland is 0.28% and shrubland 0.43%, so the most informative comparison is between the large forest matrix, the agricultural blocks, and the wet areas that interrupt both.
The northern and eastern sections contain the most continuous stretches of forest. Farmland becomes more common in the west and southwest, and additional agricultural blocks appear through parts of the center. The transition is not a clean north-south or east-west dividing line. Forest, fields, and wetlands repeatedly meet one another, producing a patchwork that changes over relatively short distances.
Agriculture should be interpreted as mapped surface cover rather than a legal or ownership category. A yellow cell does not identify an agricultural district boundary, a particular farm, a crop type, or a conservation agreement. It says that the surface was classified in an agricultural land-cover category for the mapped year. Parcel records, agricultural district maps, or farm-specific data are needed for those other questions.
The same limitation applies to forest. A green area does not indicate who owns the land, whether it is managed for timber, or what tree species dominate. What the map does very well is show how much of the county is wooded and where large forested areas remain comparatively continuous. For regional comparison, habitat context, or a classroom exercise about rural landscapes, that distinction is often exactly what is needed.
Water and wetlands are central to the county’s map, not minor background features
Oswego County’s mapped water share is 6.26%, and wetlands account for 16.83%. Those two classes together occupy a large enough portion of the county to shape how the entire map reads. Large water bodies appear at the county edge and in the interior, while wetland colors spread through forested country and around portions of the river and lake system.
The county’s official hazard and planning documents provide several useful reference points. They describe floodplain areas along the Salmon River between the Salmon River Reservoir and Lake Ontario, along the Oswego River, and along the Oneida River from Oneida Lake toward the Oswego River. These documents are not the source of the land-cover percentages, but they confirm that a dense network of lakes, reservoirs, rivers, and wet environments is part of the county’s physical geography.
A town plan for Schroeppel in southern Oswego County also describes extensive wetlands and the Oneida–Oswego river system as important environmental features. That local example helps explain why broad teal areas appear in parts of the south and interior. It should not be used to convert the countywide 16.83% wetland share into a regulatory wetland acreage, because the land-cover classification and legal wetland inventories have different purposes and boundaries.
Blue water and teal wetlands should also be read as different types of surface information. Water represents open water surfaces in the classification, while wetlands may include vegetated areas that are saturated or seasonally wet without looking like an open lake. A place can therefore have a strong water-related landscape even when the open-water percentage alone seems modest.
For environmental education, the pairing of forest and wetlands is especially useful. Students can follow how wet areas sit inside large forest tracts, then compare those same places with the general map to see nearby agriculture or development. For field planning, the map can help identify broad areas that deserve closer review, but it cannot replace official wetland delineations, stream data, or on-site investigation.
Only 8.29% of cells differ between the 1985 and 2025 class maps
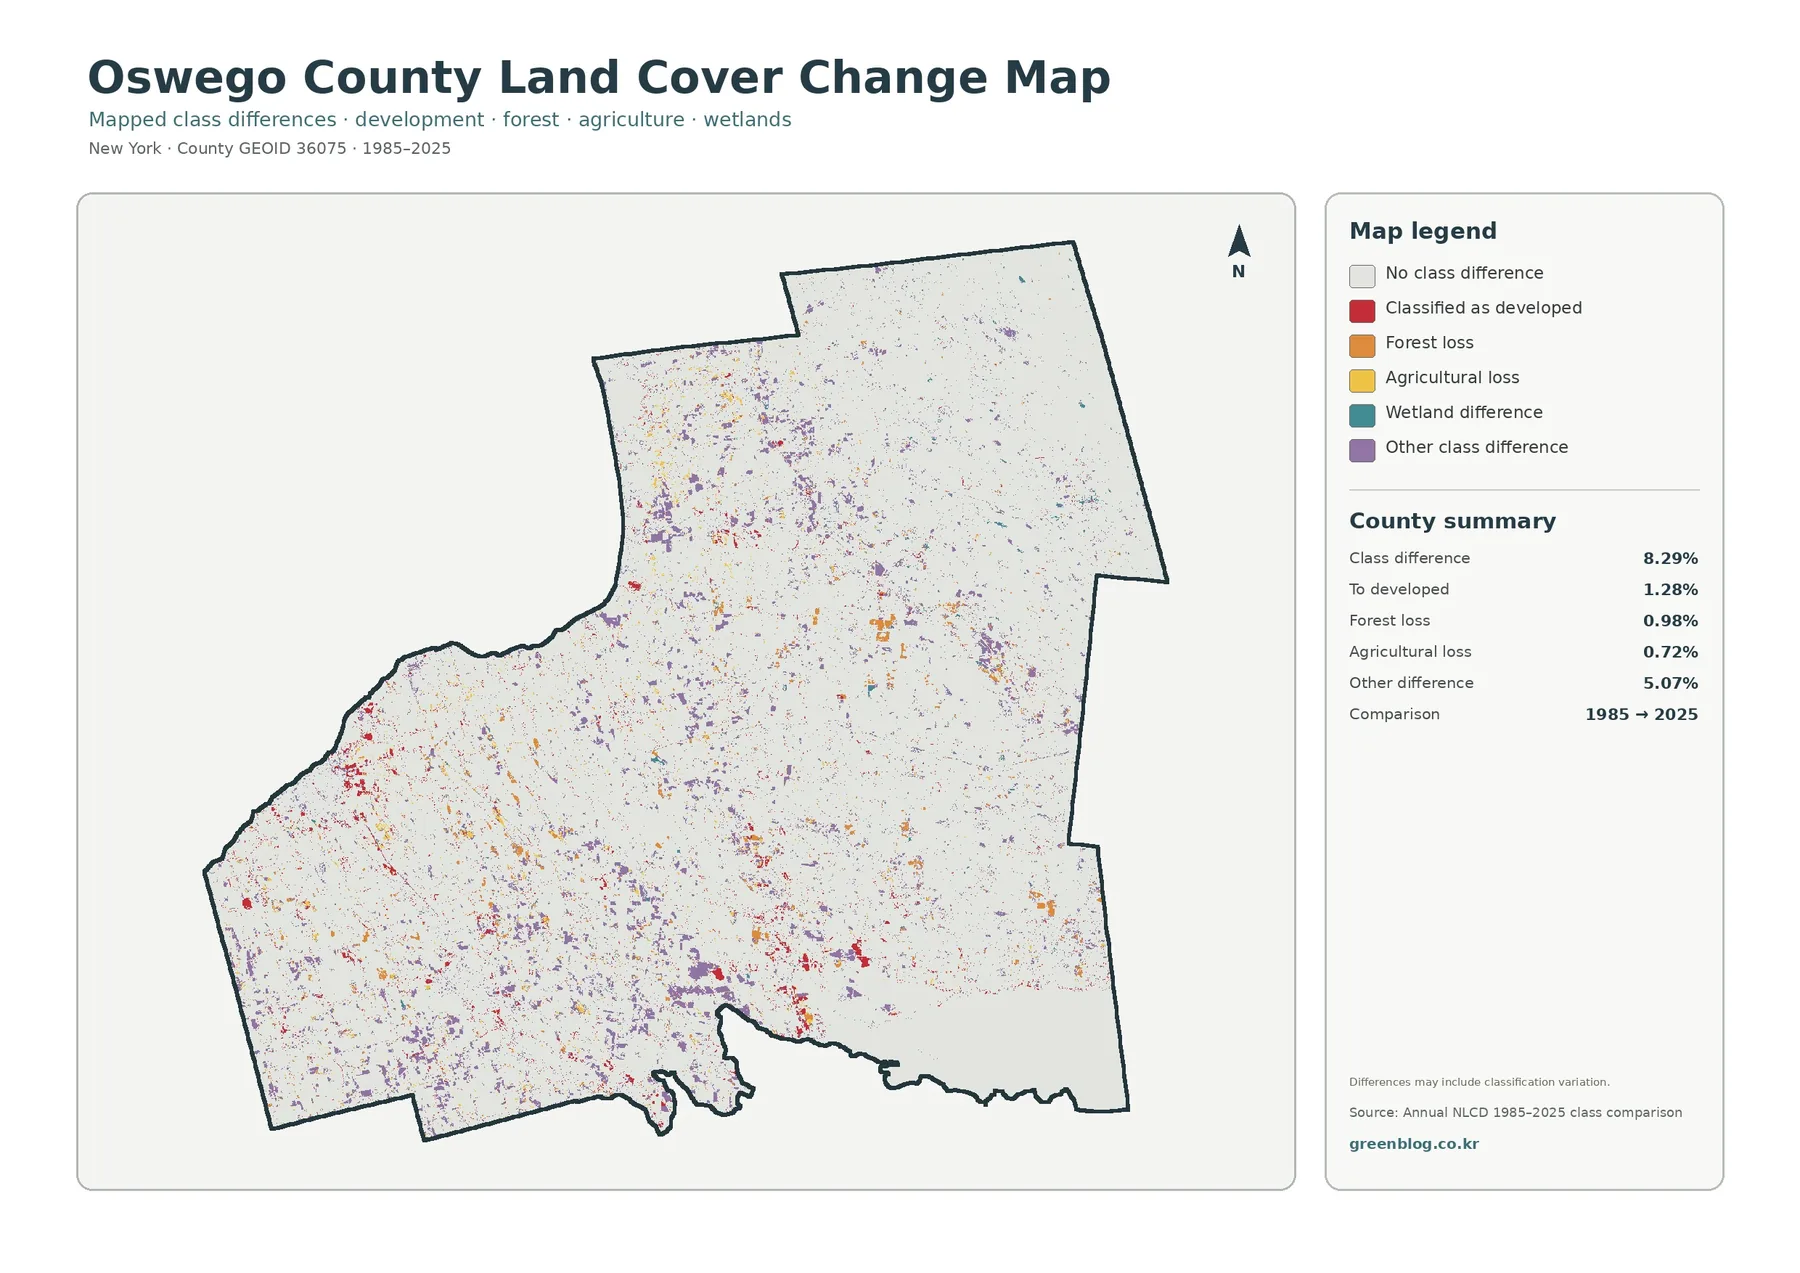
The long-term comparison reports a class difference across 8.29% of the mapped county. Within that total, 1.28% is shown as classified to developed, 0.98% as forest loss, 0.72% as agricultural loss, and 5.07% as other class difference. Most of the map remains in the pale no-difference category, so the colored change cells should be viewed as selected areas of contrast rather than evidence that the whole county was transformed.
Red cells associated with classification to developed land are most noticeable near existing settlement areas and along some of the same corridors that stand out on the current impervious map. Forest-loss and agricultural-loss colors are scattered across the county in smaller groups. The largest summary category is the 5.07% labeled as other difference, which appears as many small patches rather than one dominant zone.
That wording matters. The 8.29% figure is a mapped class-difference rate, not a direct measurement of land-use conversion. Annual NLCD is produced from satellite information and modeling at 30-meter resolution. Along forest edges, narrow roads, small wetlands, mixed agricultural fields, or shorelines, more than one surface type can fall inside a single cell, and the representative class can differ between years.
A note on the change figure says that classification variation may be included in the observed differences. For that reason, a colored cell should be treated as a prompt for closer investigation. Historical aerial imagery, newer orthophotos, parcel records, local planning files, or field observations are better tools for deciding whether a particular site was actually developed, cleared, abandoned, restored, or otherwise changed.
This caution does not make the change map less useful. It makes the proper use clearer. At county scale, the map can identify where differences cluster, show whether development-related changes are widespread or localized, and provide a quick way to compare a 1985 baseline with the 2025 classification. It is a screening and comparison layer rather than a parcel-level history.
Choosing the right map for printing, teaching, or regional reference
For a general county overview, start with the 2025 land-cover map. It puts the 51.14% forest share, the extensive wetlands, the agricultural patches, water, and developed centers on one page. A presentation about rural land patterns can then move to the forest-and-farmland version, where the relationship between the large forest matrix and agricultural openings is easier to see.
When the subject is settlement intensity, pavement, rooftops, or the contrast between compact centers and surrounding rural land, choose the impervious view. It can also help explain why 9.77% developed land does not mean that nearly one tenth of the county is paved. Pairing the 2.10% mean impervious value with the broader developed class makes that distinction understandable without technical GIS language.
For a discussion of long-term change, place the 1985–2025 comparison beside the current map rather than showing it alone. The current layer answers what the surface is classified as now; the change layer identifies cells whose class differs from the older baseline. Using both prevents a reader from mistaking a change category for a current land-cover class.
Keep the legends and titles visible when these maps are printed or placed into a slide deck. Similar colors can carry different meanings from one product to another, and the change map uses categories such as classified to developed or forest loss rather than the current land-cover legend. Cropping away the legend may save space but makes interpretation much less reliable.
The download package contains the original JPG versions of all four maps: 2025 land cover, forest and farmland, impervious/developed land, and the 1985–2025 class-difference map. Keeping the set together makes it easy to reuse the same county at a consistent size and to compare two or more views without relying on screenshots.
What the 30-meter raster can and cannot tell you
Annual NLCD is a raster dataset, meaning the landscape is represented by a grid of cells rather than parcel boundaries. The science products use 30-meter spatial resolution. A single cell can contain more than one real-world surface, such as tree canopy, a narrow road, a yard, and a small wet area. The classification assigns a representative value to the cell, which is why tiny features may disappear or edges may look blocky.
A cell containing several surface types is often described as a mixed pixel. Mixed pixels are especially relevant in Oswego County where forest, wetlands, fields, roads, and water often meet along irregular boundaries. A narrow stream or a thin strip of trees may be smaller than the cell size. For that reason, broad clusters and repeated patterns are more dependable at county scale than a single isolated pixel.
The 2025 map is also a snapshot of the mapped year. Construction, timber harvest, restoration, agricultural changes, shoreline work, or other events occurring afterward may not appear. Anyone who needs the present condition of a specific property should add recent aerial imagery, local records, or field verification rather than treating this page as a current parcel survey.
Land cover must also be separated from zoning and legal land use. A forest cell does not define a protected forest tract. A wetland cell is not an official regulatory wetland boundary. Agricultural cover does not prove that a parcel is in an agricultural district, and developed cover does not distinguish residential, commercial, industrial, or institutional zoning. Those questions require the appropriate local or state records.
Used at the scale for which it was designed, however, the dataset is highly practical. It gives a consistent countywide view that can be compared with neighboring counties or with another year, and the four map versions emphasize different aspects without changing the basic geographic extent. That makes the set useful for regional orientation, teaching, preliminary planning context, and presentation graphics.
Frequently Asked Questions
What is the largest land-cover class in Oswego County in 2025?
Forest is the largest class at 51.14%. Wetlands account for 16.83%, agriculture 15.01%, developed land 9.77%, and water 6.26%. Overall, the county reads as primarily forested, but the wetland and water shares are large enough to be major parts of the landscape rather than minor exceptions.
Why is mean impervious surface only 2.10% when developed land is 9.77%?
Developed land is a broad cover category that may contain houses, roads, lawns, trees, and other permeable ground. Hard-surface percentages measure features such as pavement and rooftops within each cell. Only 1.00% of the county is mapped at 50% impervious or higher, so the hard-surface footprint is much more concentrated than the full developed class.
Does the 8.29% class difference mean that 8.29% of the county was physically converted?
No. It means that 8.29% of mapped cells have a different land-cover classification in the 1985 and 2025 comparison used for this map. Real change can be part of that total, but classification variation, mixed pixels, and the 30-meter raster structure can also contribute. Site-specific change should be checked with additional imagery or records.
What files are included in the download?
The ZIP contains four original JPG maps: the 2025 general land-cover map, the forest-and-farmland map, the impervious/developed-surface map, and the 1985–2025 land-cover class-difference map. They can be used separately or placed side by side for a consistent county comparison.
Map File Information
Oswego County Land Cover Maps The ZIP includes the four original JPG maps for current land cover, forest and farmland, impervious/developed surfaces, and 1985–2025 class differences.
- Included Files: Use only the versions confirmed in the article and supplied images
- File Type: Use the confirmed download contents
- Intended Use: Printing, education, presentations, and map-based projects
Related Maps
- Albany County Land Cover Map
- Allegany County New York Land Cover Map
- Bronx County New York Land Cover Map
Sources and references
- MRLC Annual NLCD Data – access to Annual NLCD land-cover and related products
- USGS About Annual NLCD – background on 30-meter annual land-cover and impervious products
- U.S. Census Bureau TIGER/Line Shapefiles – county boundary and geographic reference data
- Oswego County – Oswego Canal Corridor BOA – county planning information on Lake Ontario, the Oswego River, and local natural resources
- Oswego County Multi-Jurisdictional Hazard Mitigation Plan – geographic context for the Salmon River, Oneida Lake, the Oswego River, and associated waterways
Green Map creates custom-edited map images using open geographic data sources such as geoBoundaries, Natural Earth, OpenStreetMap, and government open data.
These maps are edited visual materials, not raw data files, and are provided for education, documents, presentations, and graphic reference.