Genesee County is one of the places in western New York where agriculture defines much of the visible landscape. On the 2025 land-cover map, cropland and other agricultural cover spread across broad sections of the county, while wetlands and forest break that pattern into smaller blocks and corridors. Developed land is much more concentrated. Batavia forms the clearest urban center, with narrower traces of development extending along roads and around smaller communities. The four maps on this page separate those patterns so they can be read without treating land cover, legal land use, and property boundaries as the same thing.
The map summary places agriculture at 52.90% of the county. Wetlands account for 19.86%, forest for 15.24%, developed cover for 11.13%, and mapped water for 0.44%. Those values describe classified surface cover rather than zoning or ownership. Annual NLCD is raster data, meaning the landscape is divided into grid cells and each cell receives a class. Small features and mixed landscapes can therefore be generalized.
Table of Contents
A county shaped by working farmland
Agricultural cover dominates the general map, especially through the northern, central, and eastern portions of Genesee County. Large farmed areas also continue across much of the south. Forest does not form one continuous upland block. Instead, wooded areas appear around the county edges, beside wetlands, and in irregular patches between fields. This produces a landscape where open agricultural ground is extensive but rarely isolated from other cover types.
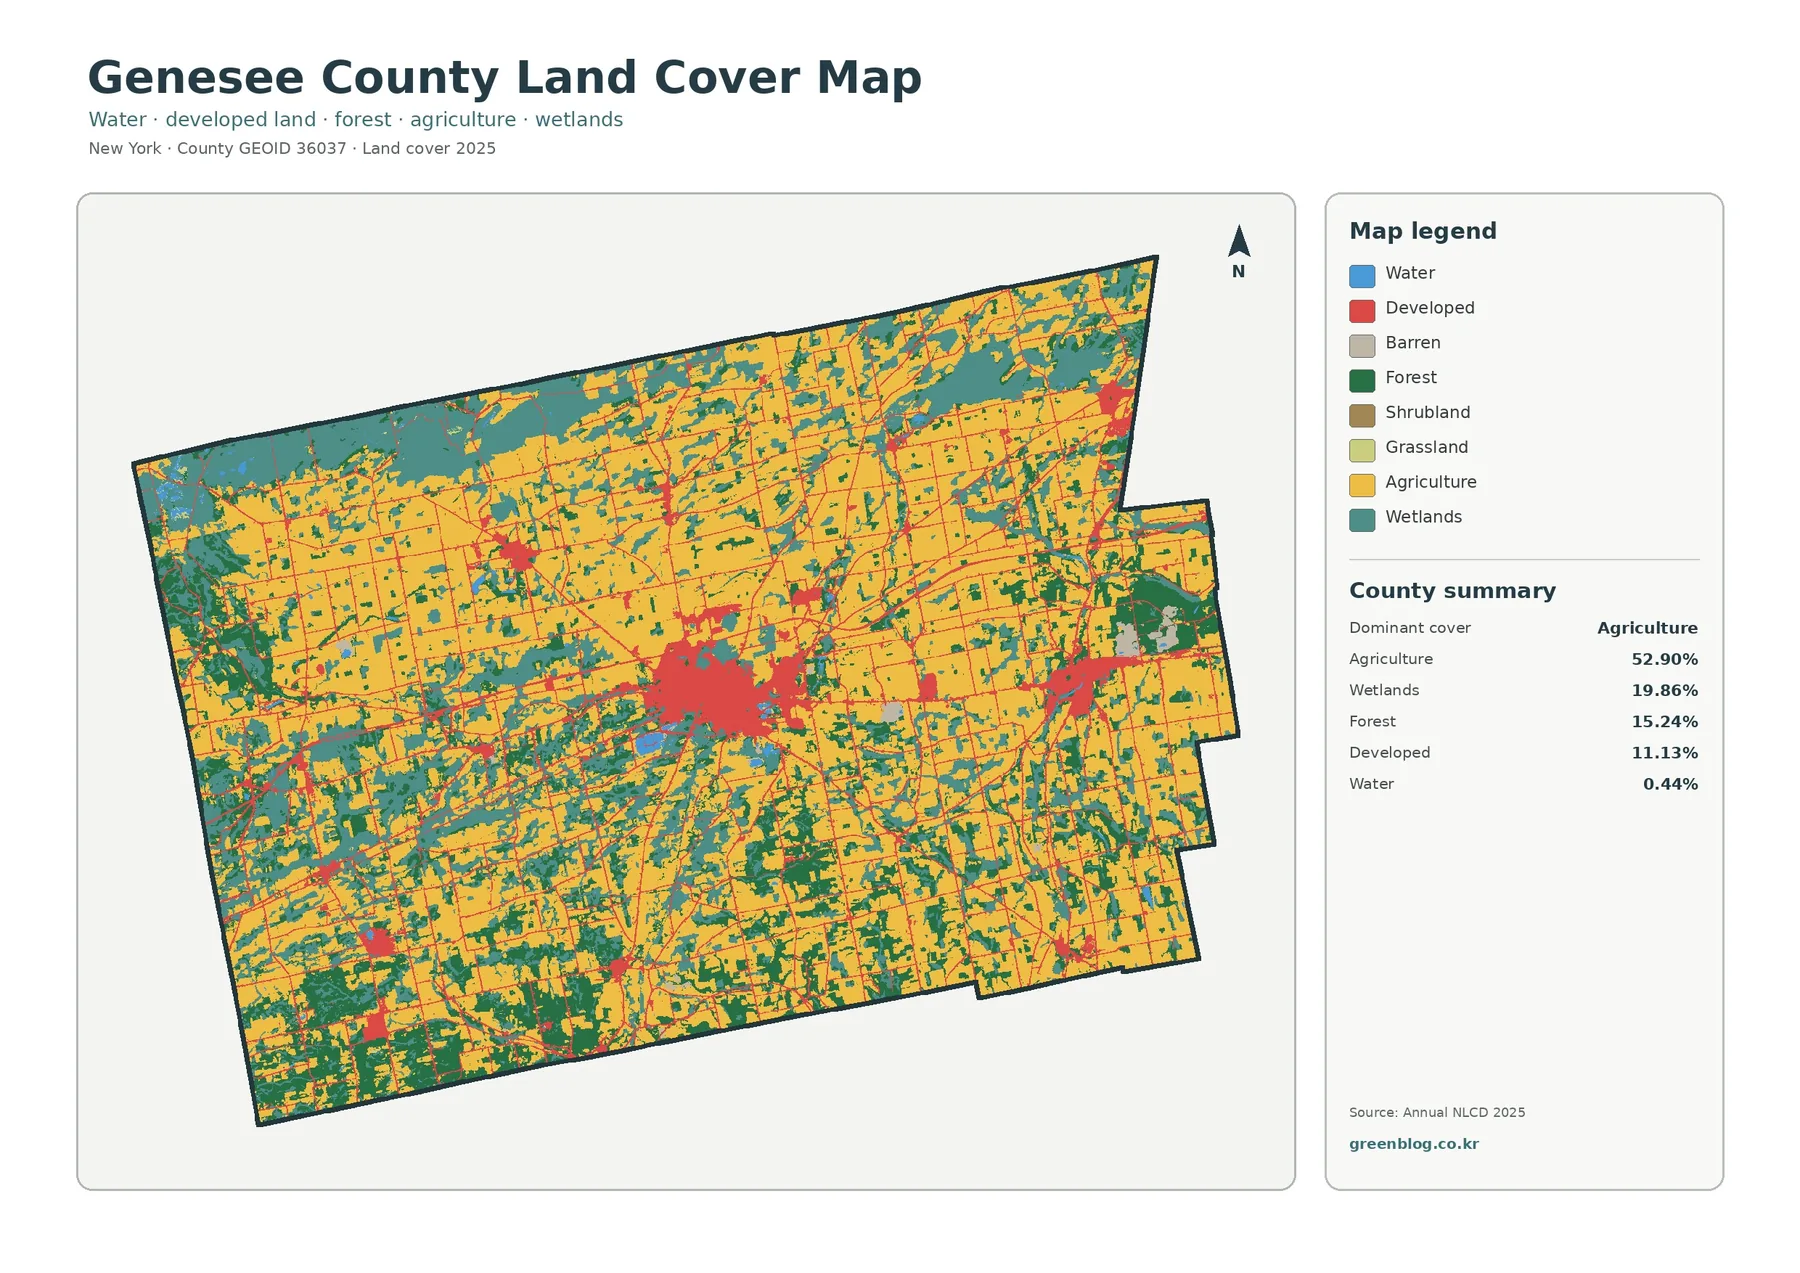
Wetlands are unusually easy to notice because they occupy many separate areas rather than a single isolated basin. Broad wetland patches are visible toward the west and north, with additional areas scattered through the county interior. Their boundaries often meet farmland directly. For watershed or habitat work, those edges may be more informative than the countywide percentage because they show where different surface conditions sit next to each other.
Developed cover is visually different. The largest red concentration lies around Batavia near the center of the county. Smaller settlement clusters appear to the east, northwest, and in other rural locations, while roads create thin connecting traces. The pattern makes it possible to locate the county’s main built-up areas quickly even though development covers far less land than agriculture.
Forest and farmland at a closer scale
The forest-and-farmland map removes some of the visual competition found in the full land-cover legend. Cropland remains the dominant color across large, connected areas. Forest becomes more prominent in the southwest and south, where several larger wooded patches stand out, and it also appears in smaller pieces across the north and east. Wetlands remain an important part of the map because many of them cut into or border farmed ground.
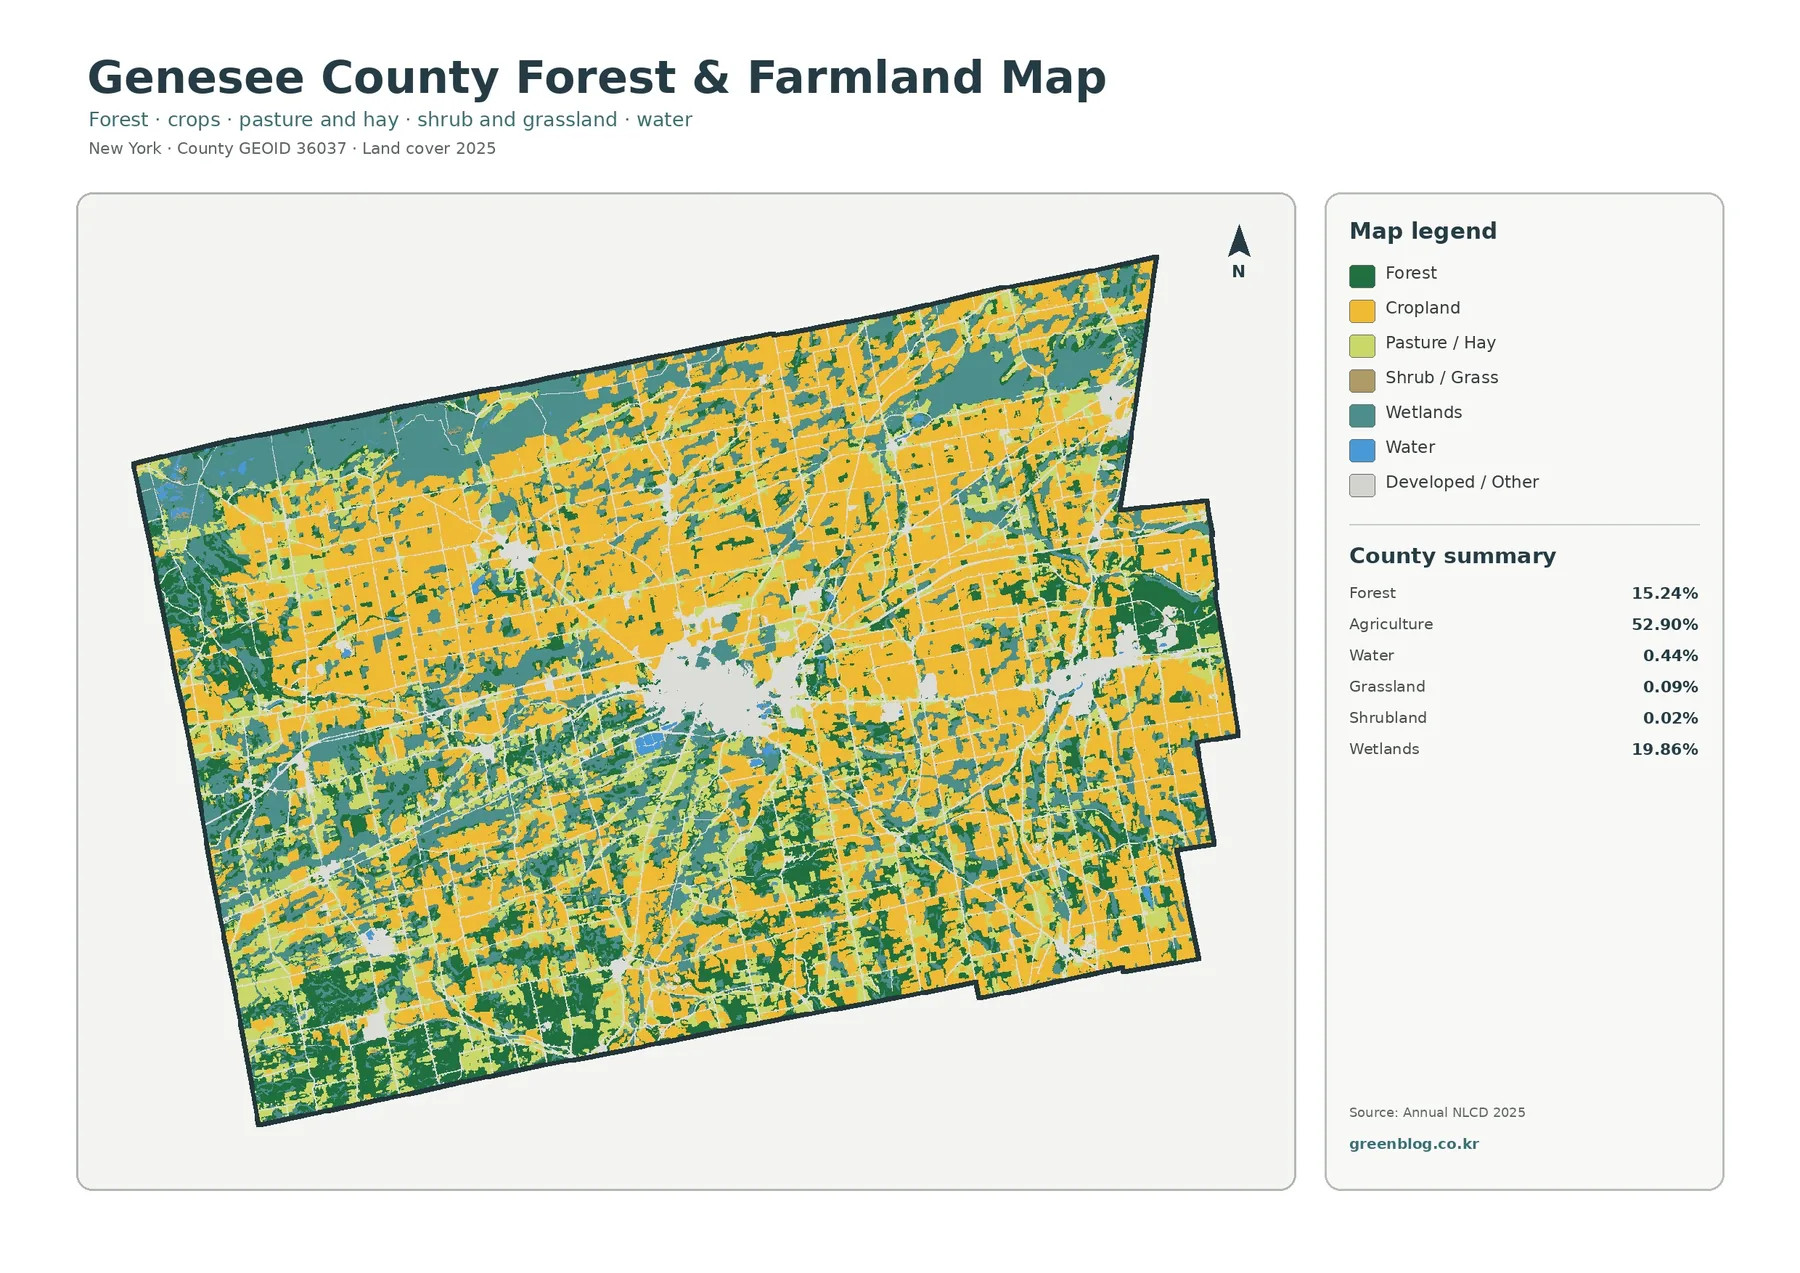
Genesee County treats agriculture as a major planning concern, not merely as a visual characteristic of the map. The county maintains an Agricultural and Farmland Protection program, and its Smart Growth Plan links community growth with the protection of agricultural resources. That local planning context is consistent with the broad agricultural footprint visible here. The map, however, does not identify agricultural districts or protected parcels. Those legal boundaries must be checked in county or state records.
For environmental education, this map is useful because it shows that an agricultural county can still contain substantial wetland and forest cover. A classroom exercise could compare the broad farm blocks with the more fragmented woods and then ask where wetlands create breaks in that pattern. A habitat study could use the same view to select places where wooded cover, fields, and wet ground meet within a short distance.
Impervious surfaces reveal the Batavia core
Impervious surface means ground that resists infiltration, such as pavement, rooftops, and many parking areas. The countywide mean shown on this map is 3.15%, while 1.47% of the county is mapped at 50% impervious or greater. A low county average does not mean the built environment is evenly sparse. The strongest values are tightly clustered, which is exactly why an impervious-surface map adds information that the general land-cover view cannot show as clearly.
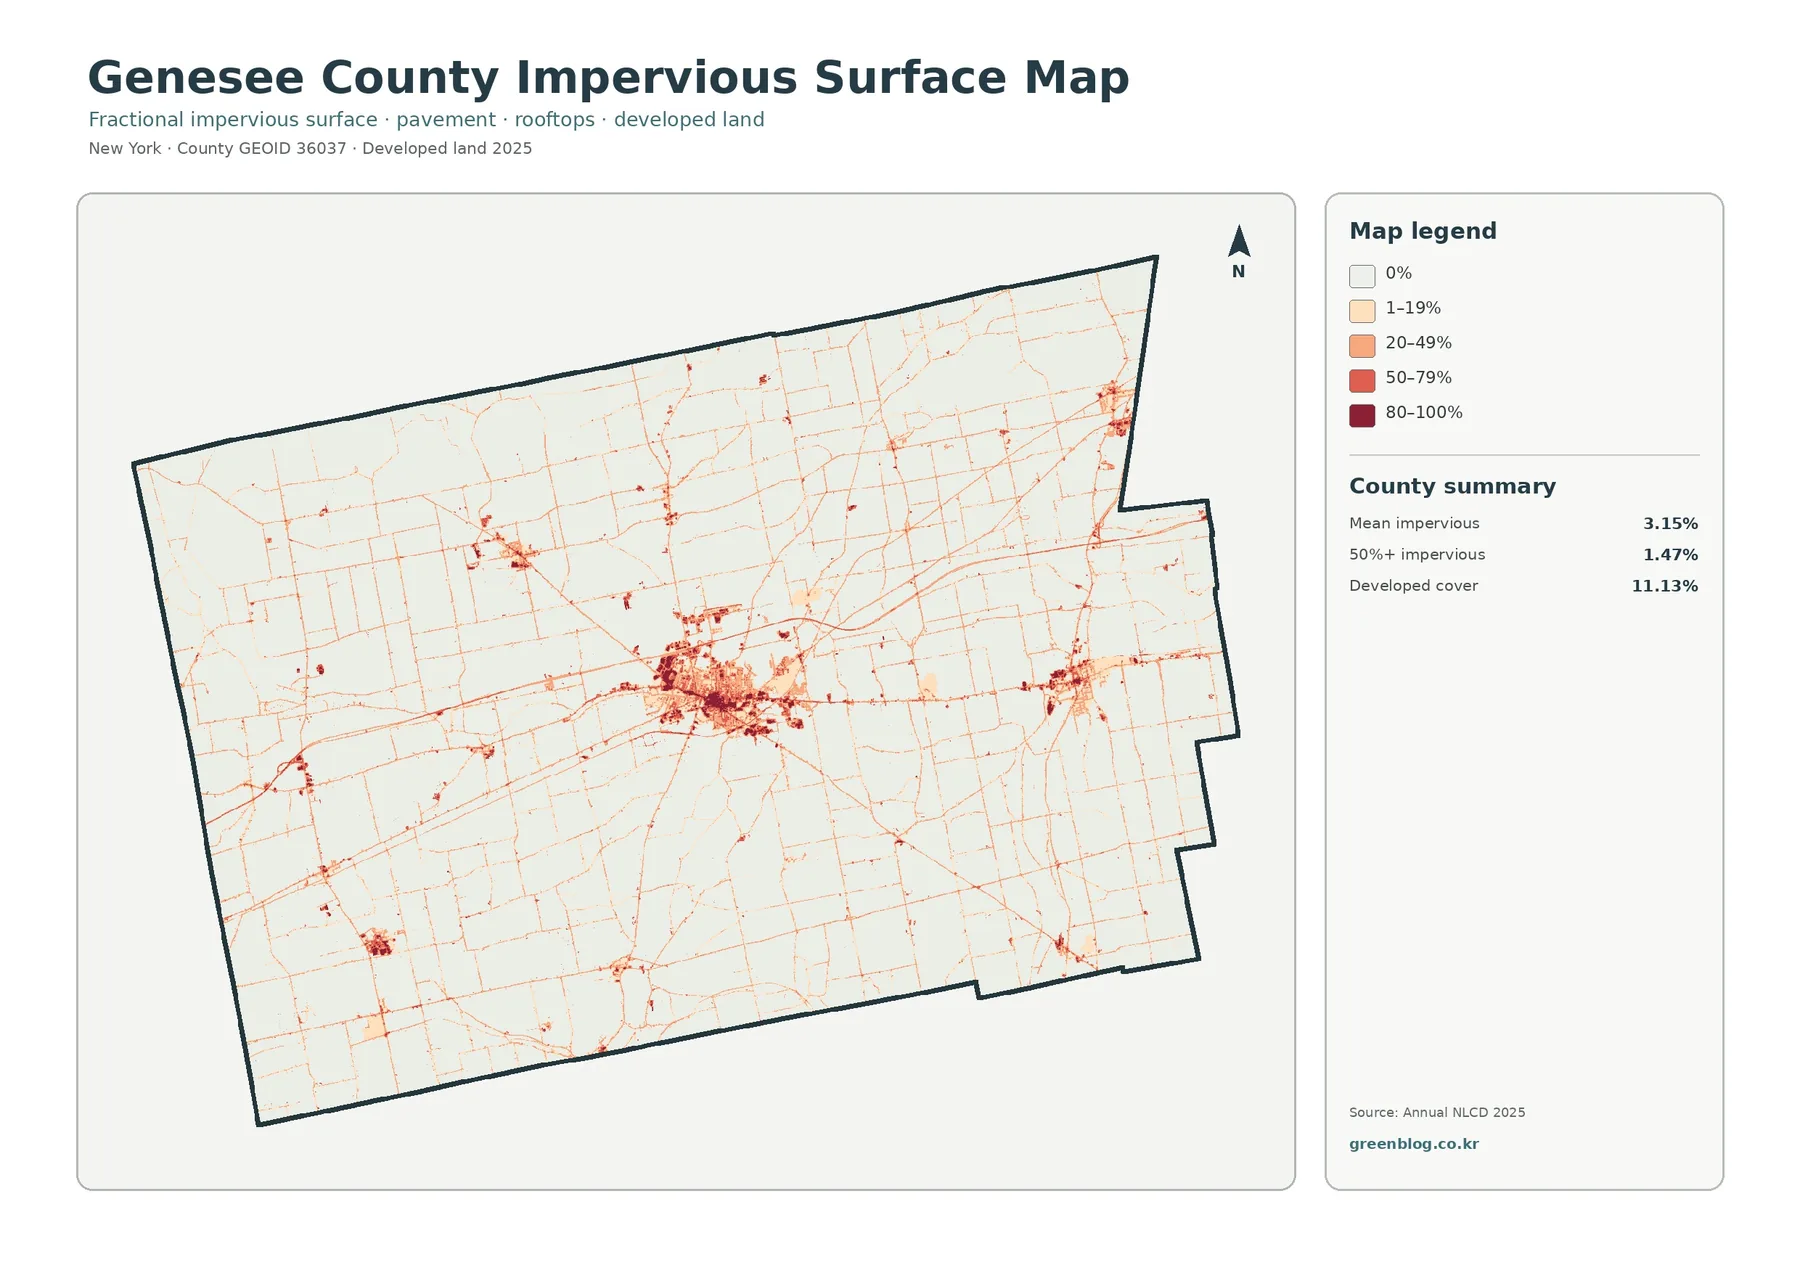
Batavia is the main concentration on the map. Dense red and dark-red cells form a compact core, and lighter impervious traces extend outward along the road network. Smaller clusters are visible east of Batavia and near several other settlements. Rural roads remain visible as fine lines, but the surrounding agricultural landscape generally stays in the lowest impervious categories.
This distinction is useful for stormwater and watershed discussions. A planner can compare the location of built surfaces with nearby wetlands or farmed land, while an educator can illustrate why a county with extensive agriculture still has localized areas where runoff behavior may be very different. The map should not be used to measure individual rooftops, driveways, or road widths. Those tasks require finer imagery or local GIS layers.
What the 1985–2025 comparison does and does not show
The change map compares classifications from 1985 and 2025. It reports a class difference across 13.72% of the county. Areas classified as developed in the comparison account for 1.63%, mapped forest loss for 0.40%, and agricultural loss for 1.28%. Another 10.04% falls into the broader “other class difference” category. That last value is important because a changed class is not automatically evidence of construction, clearing, or another single physical process.
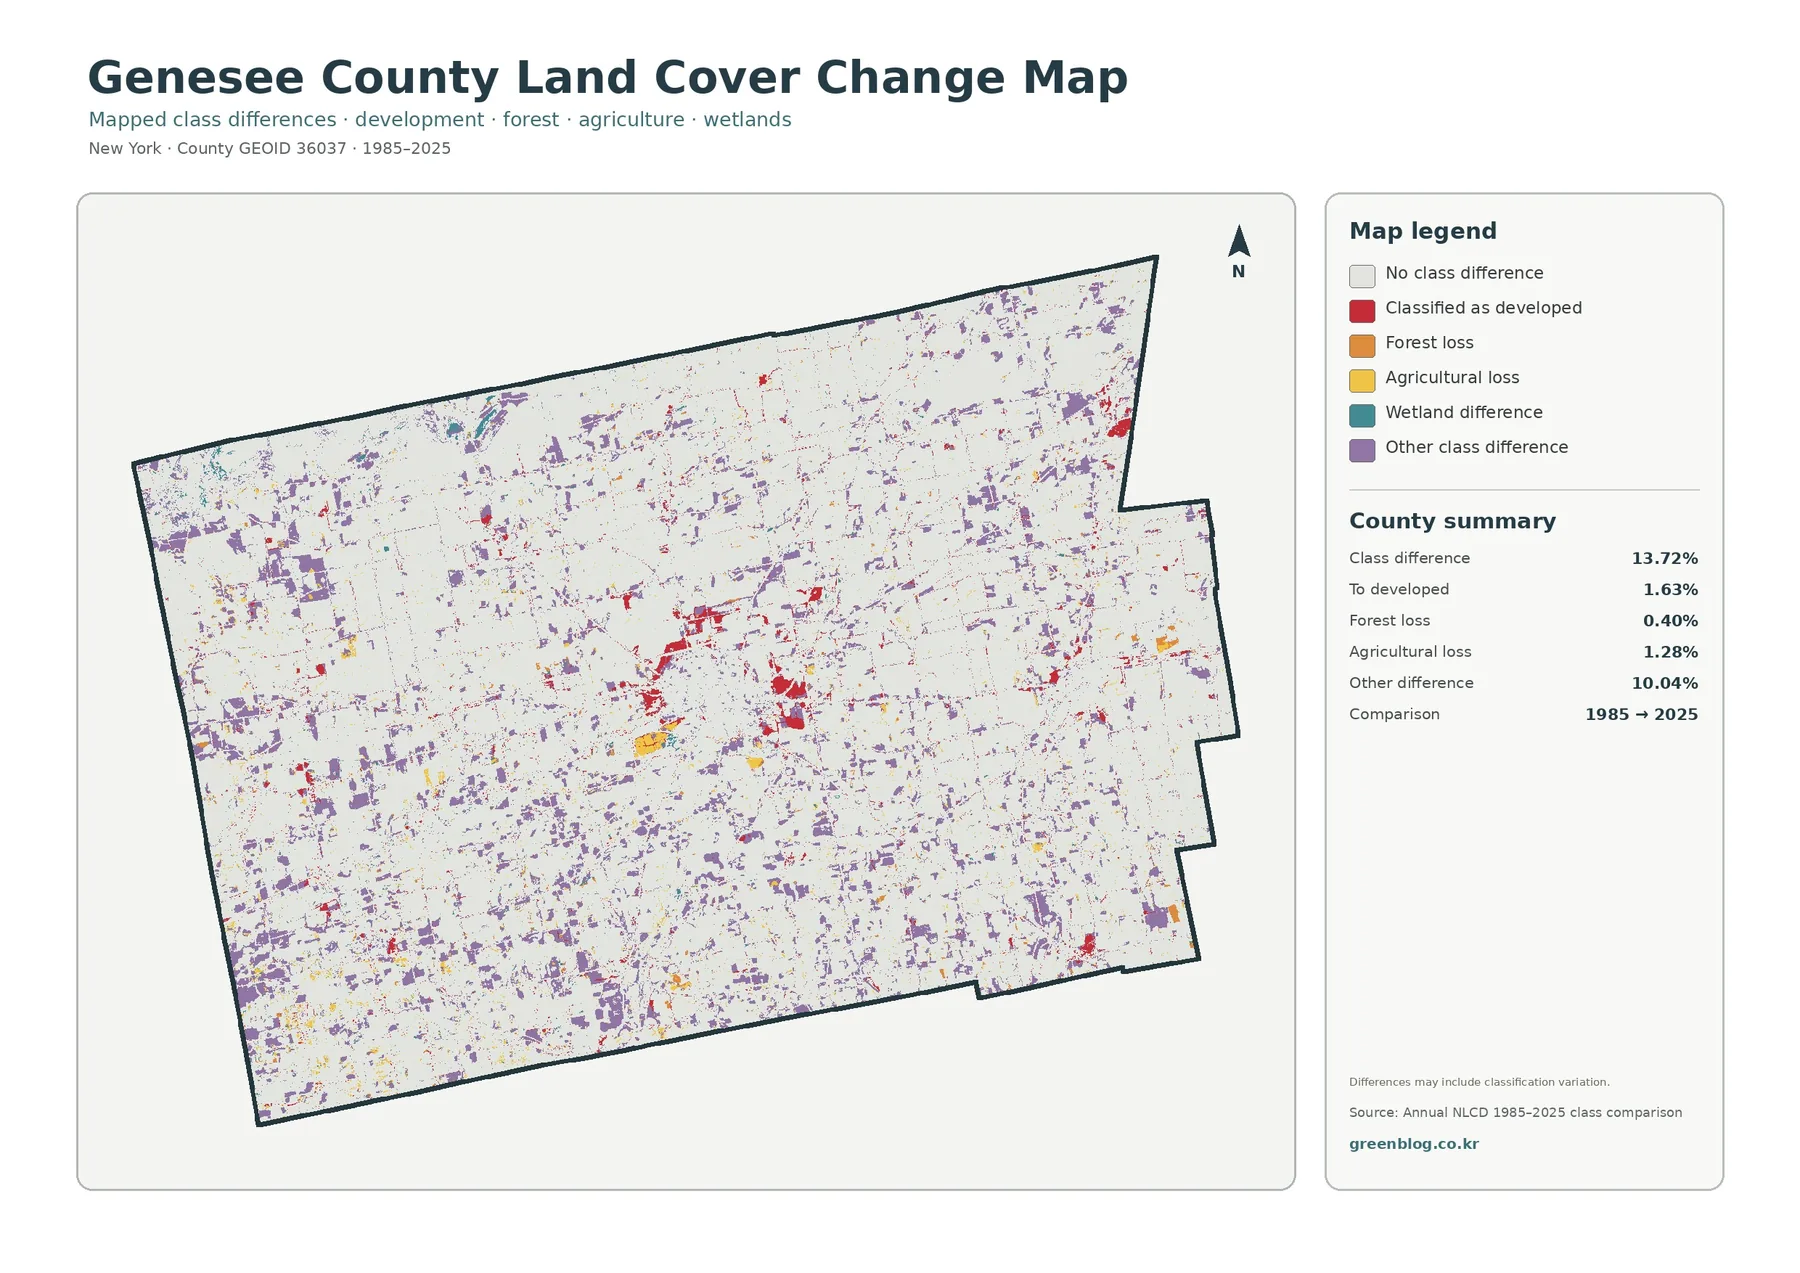
Red developed differences are most noticeable around Batavia and at several smaller settlement locations. Agricultural-loss colors appear in scattered groups, while mapped forest loss is more limited. Purple “other difference” cells are distributed much more widely. The spatial pattern suggests where a reader might investigate further, but the map alone cannot establish the reason a cell changed class.
Long comparisons can be influenced by changes in sensors, classification methods, seasonal conditions, and mixed pixels. A mixed pixel is a grid cell containing more than one real surface type even though the dataset must assign a representative class. If a specific site matters, compare aerial photography, local records, and intermediate-year land-cover products before drawing a conclusion about what happened there.
Using the four maps together
Each map answers a different question. The general land-cover map provides the broad inventory. The forest-and-farmland view makes the county’s agricultural structure easier to read. The impervious map identifies where built surfaces are concentrated, and the change map points to locations where two years do not share the same classification. Reading them as a set prevents one theme from being mistaken for the whole landscape.
For planning context, begin with the general map and then use the impervious view to locate the main built-up concentrations. If the question concerns farmland, compare those locations with the agricultural pattern and consult Genesee County’s farmland-protection materials. For watershed work, wetlands and impervious surfaces can be examined together to identify areas worth closer field review. None of these steps replaces site-level engineering, parcel research, or regulatory mapping.
The maps also work well in presentations because the visual emphasis changes from one sheet to the next. The farmland map is the clearest choice for an agriculture-focused slide. The impervious map is more effective for development and runoff discussions. The change map can support a time-comparison section, provided the caption explains that classification difference and confirmed land-use change are not identical concepts.
Important limits of land-cover data
- Land cover describes the physical surface. It does not define zoning, ownership, easements, or the legal use of a parcel.
- Raster classification generalizes the landscape into grid cells, so narrow streams, small buildings, field edges, and minor wetlands can be simplified.
- Mixed pixels can contain several surface types even though one class is displayed on the map.
- The 1985–2025 map is best treated as a screening tool. Confirm important locations with aerial imagery, local GIS, or other year-by-year sources.
Download the four map files
The downloadable ZIP contains four original JPG maps for Genesee County: general land cover, forest and farmland, impervious and developed land, and the 1985–2025 land-cover comparison. The article uses WebP previews for on-page viewing, while the archive provides the JPG versions for saving and presentation use.
Frequently Asked Questions
What is the dominant mapped land cover in Genesee County?
Agriculture is the largest 2025 class in the supplied map summary at 52.90%. Wetlands follow at 19.86%, with forest at 15.24% and developed cover at 11.13%.
Does every colored cell on the change map represent confirmed land conversion?
No. The map identifies differences between classifications for two years. Some differences may reflect real landscape change, while others can be influenced by classification methods, mixed pixels, or observation conditions.
Why use the impervious-surface map if developed land is already on the main map?
The impervious map shows intensity. It makes the Batavia core, road traces, and smaller built-up clusters much easier to distinguish than a single developed-land class can.
Map File Information
Download the map files associated with this page for reference, printing, and compatible visual projects.
- Included Files: Use only the versions confirmed in the article and supplied images
- File Type: Use the confirmed download contents
- Intended Use: Printing, education, presentations, and map-based projects
Related Maps
- Albany County Land Cover Map
- Bronx County New York Land Cover Map
- Cattaraugus County New York Land Cover Map
Sources and references
- MRLC Annual NLCD Data — official access point for Annual NLCD land-cover and related datasets.
- USGS Annual NLCD Land Cover Classification — background on land-cover classes and interpretation.
- Genesee County Agricultural and Farmland Protection — county information on agricultural districts and farmland-protection planning.
- Genesee County Soil and Water Conservation District — local soil, water, agriculture, and conservation programs.
Green Map creates custom-edited map images using open geographic data sources such as geoBoundaries, Natural Earth, OpenStreetMap, and government open data.
These maps are edited visual materials, not raw data files, and are provided for education, documents, presentations, and graphic reference.