Fulton County has a pronounced north-to-south contrast that is easy to read in the 2025 land-cover data. Forest is the dominant class at 61.41%. Wetlands account for 12.82%, agriculture for 10.31%, developed land for 7.46%, and water for 6.75%. The percentages tell only part of the story, because the categories are not evenly distributed across the county.
Great Sacandaga Lake forms the most obvious water feature in the northeast. Large forest blocks extend westward and northward from the lake into the Adirondack landscape, with wetlands and smaller lakes scattered through the interior. South of that heavily wooded area, the map becomes more varied. Farm fields, roads, and developed areas are more common, especially around the Gloversville–Johnstown area and the county’s southern edge.
The four maps on this page separate those patterns into different questions. The first establishes the full 2025 land-cover mix. The forest-and-farmland map makes the rural pattern easier to follow. The impervious-surface map isolates pavement, rooftops, and other hard surfaces. The final layer compares mapped classes in 1985 and 2025 to show where the classification differs.
Land cover is not a zoning map or a property map. It describes how the ground surface is classified from remotely sensed data. These images are useful for countywide context, environmental education, agricultural discussion, and presentation graphics, but they should not be used to define parcel boundaries or legal land use.
Table of Contents
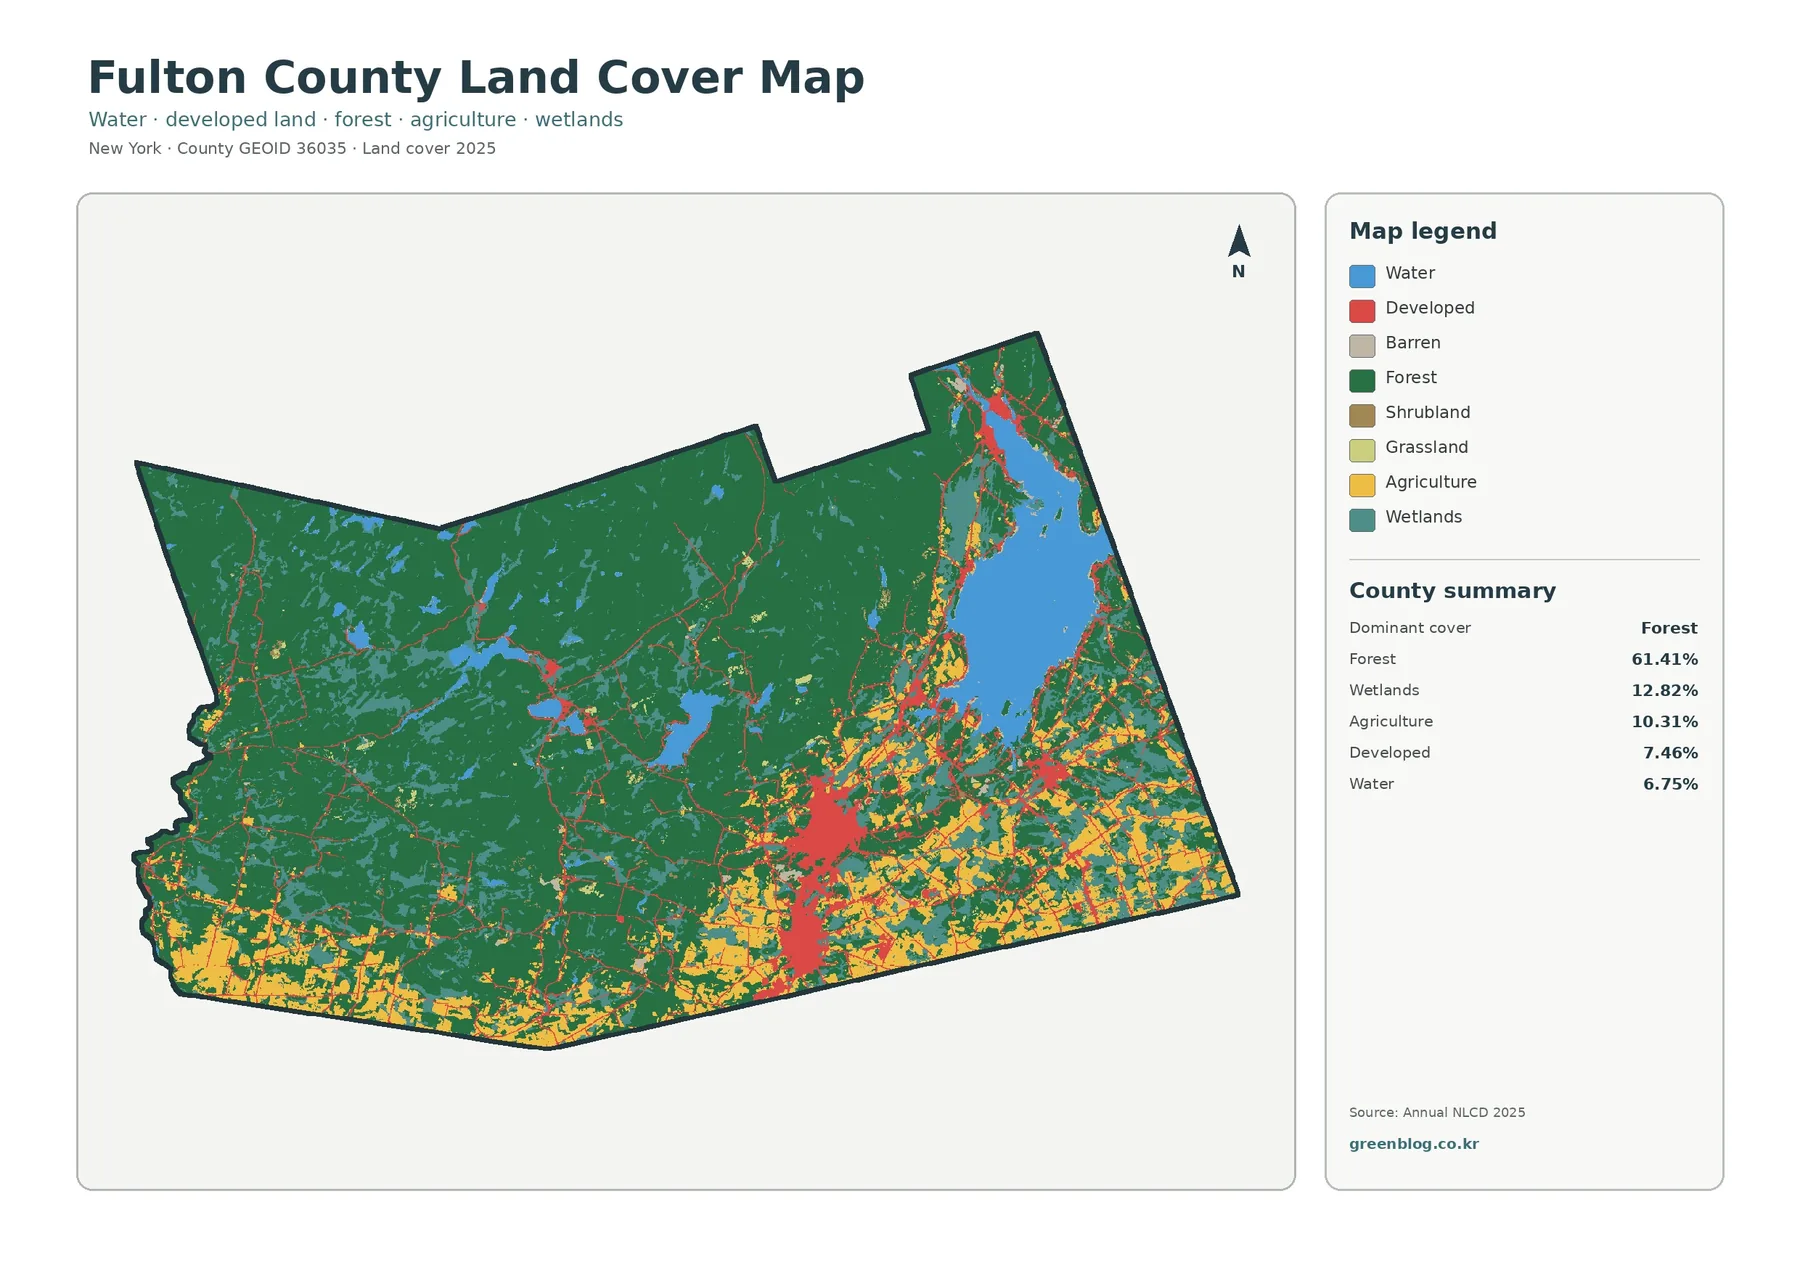
Forest and water shape the northern half
Dark green covers much of the western and northern map. That broad area is consistent with the countywide forest share of 61.41%. Small lakes, wetland patches, and narrow developed corridors interrupt the forest, but there is no continuous metropolitan footprint across this part of Fulton County.
Great Sacandaga Lake creates a very different visual feature in the northeast. Its large blue surface is surrounded by forest, wetland, roads, and pockets of development. Smaller lakes are visible farther west and near the county’s interior. Water represents 6.75% of the mapped area, a meaningful share for a county of this size.
Wetlands are even more extensive at 12.82%. They appear throughout the forested interior and around many water features. Rather than forming one single wetland zone, they are distributed in numerous patches and corridors. That pattern matters when reading the map because some areas that initially look like continuous forest contain a substantial wetland component.
The southern part of the county is noticeably more mixed. Yellow agricultural classes are common near the southern boundary and around developed communities. Red developed areas are concentrated in the south-central section and extend outward along roads. The map therefore presents a clear transition from forest-and-water landscapes to a more settled and agricultural south.
Farmland is concentrated toward the southern edge
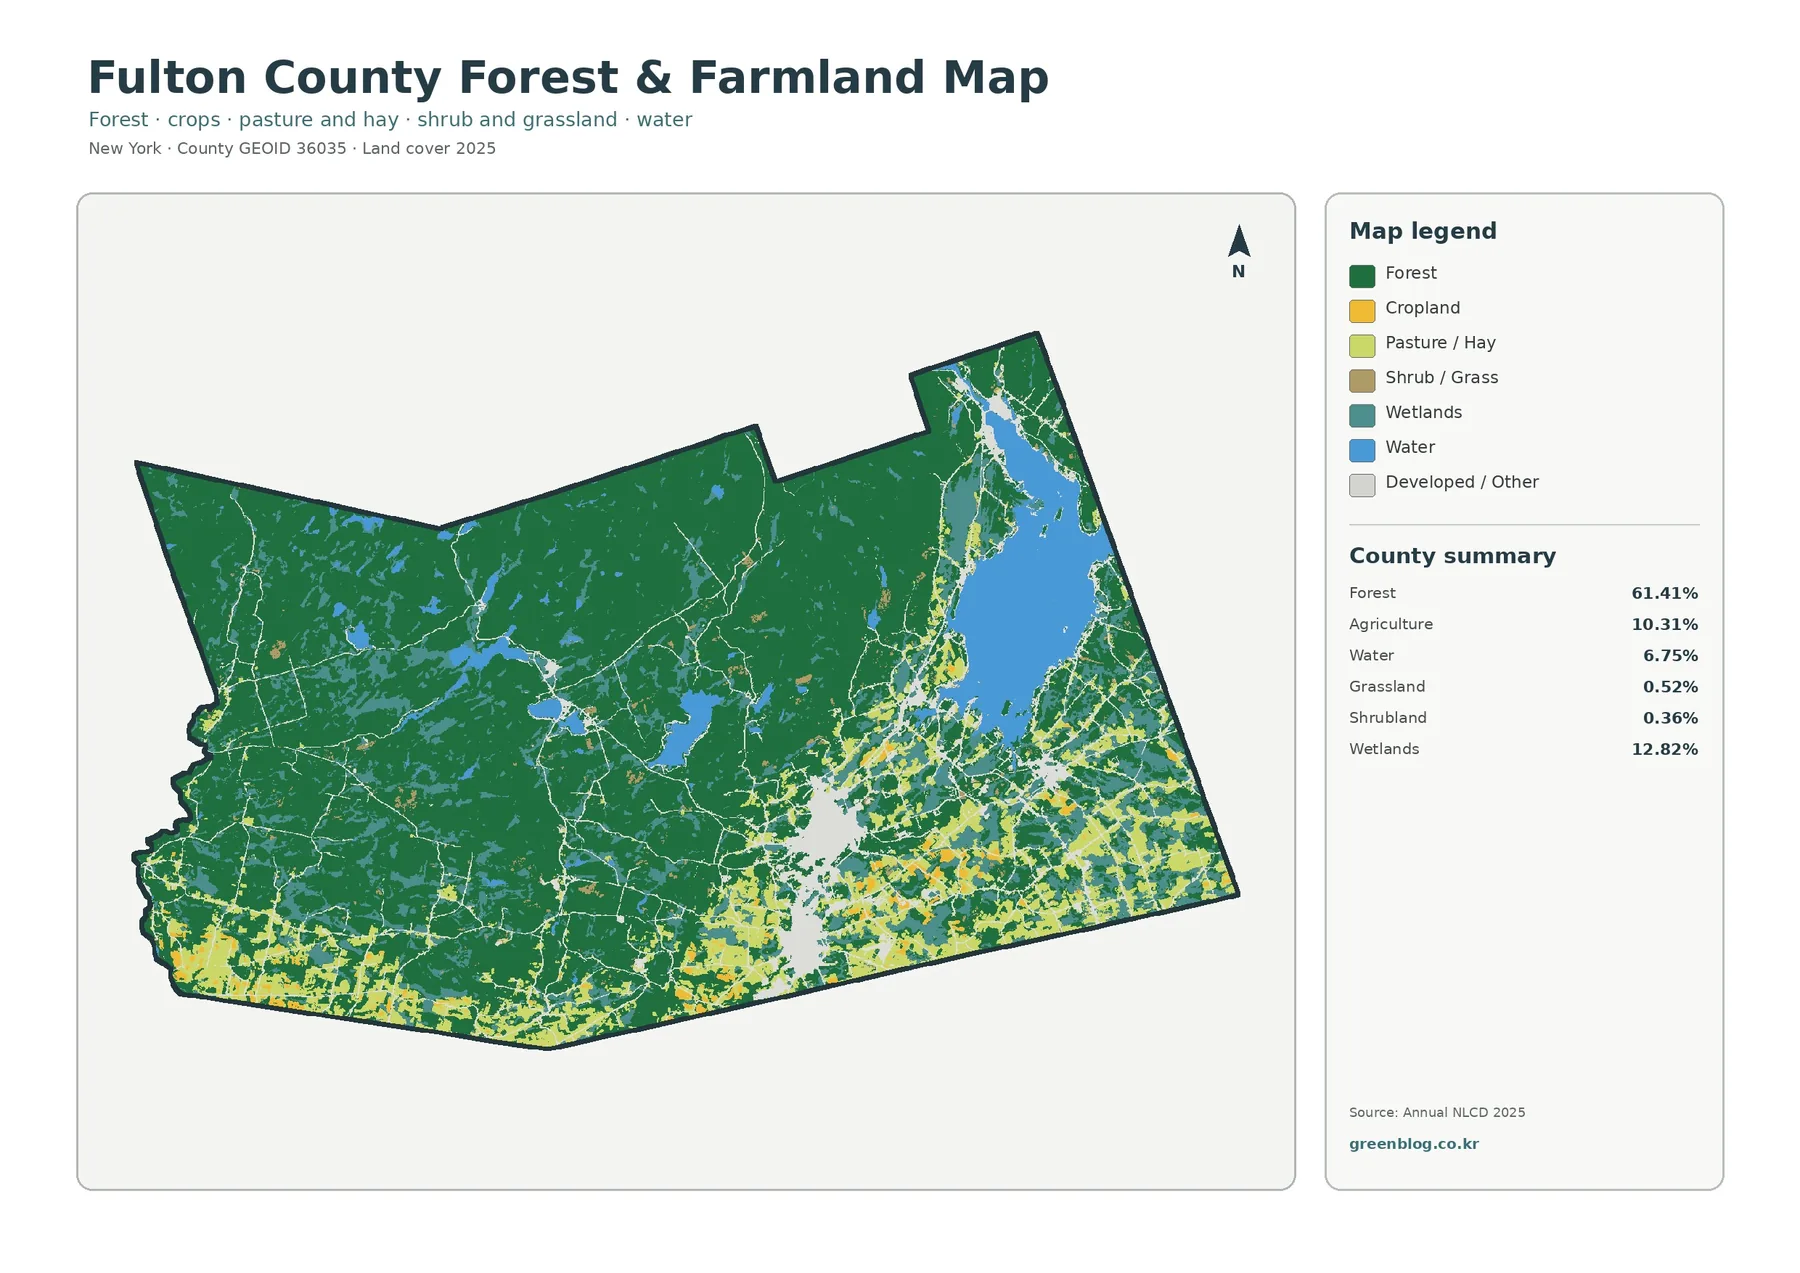
The forest-and-farmland view removes much of the visual detail from developed classes and makes the county’s rural structure easier to understand. Forest remains the dominant class at 61.41%. Agriculture accounts for 10.31%, but its location is more informative than the countywide percentage alone.
Most agricultural cover lies in the southern third of Fulton County. Cropland and pasture or hay form irregular patches close to the southern boundary and around the more settled south-central landscape. Farther north and west, farm classes become sparse as forest, wetlands, and water occupy larger shares of the map.
The eastern side near Great Sacandaga Lake contains a mixture of rural and developed cover. Some farm areas lie south and east of the lake, while the lake’s western side is much more heavily wooded. This difference makes the reservoir a useful reference point when comparing the county’s rural geography.
The legend distinguishes cropland from pasture or hay and also keeps shrub or grass cover separate. That distinction prevents every open area from being interpreted as active farmland. A satellite-derived land-cover class also does not identify farm ownership, crop type, or agricultural district boundaries.
Fulton County maintains an agricultural district and an Agricultural and Farmland Protection Board through its planning program. Those local resources provide policy and program context that the land-cover layer cannot supply. The map is best used to show where agricultural surfaces are concentrated before consulting the county’s more detailed agricultural information.
Hard surfaces cluster around the southern cities and road network
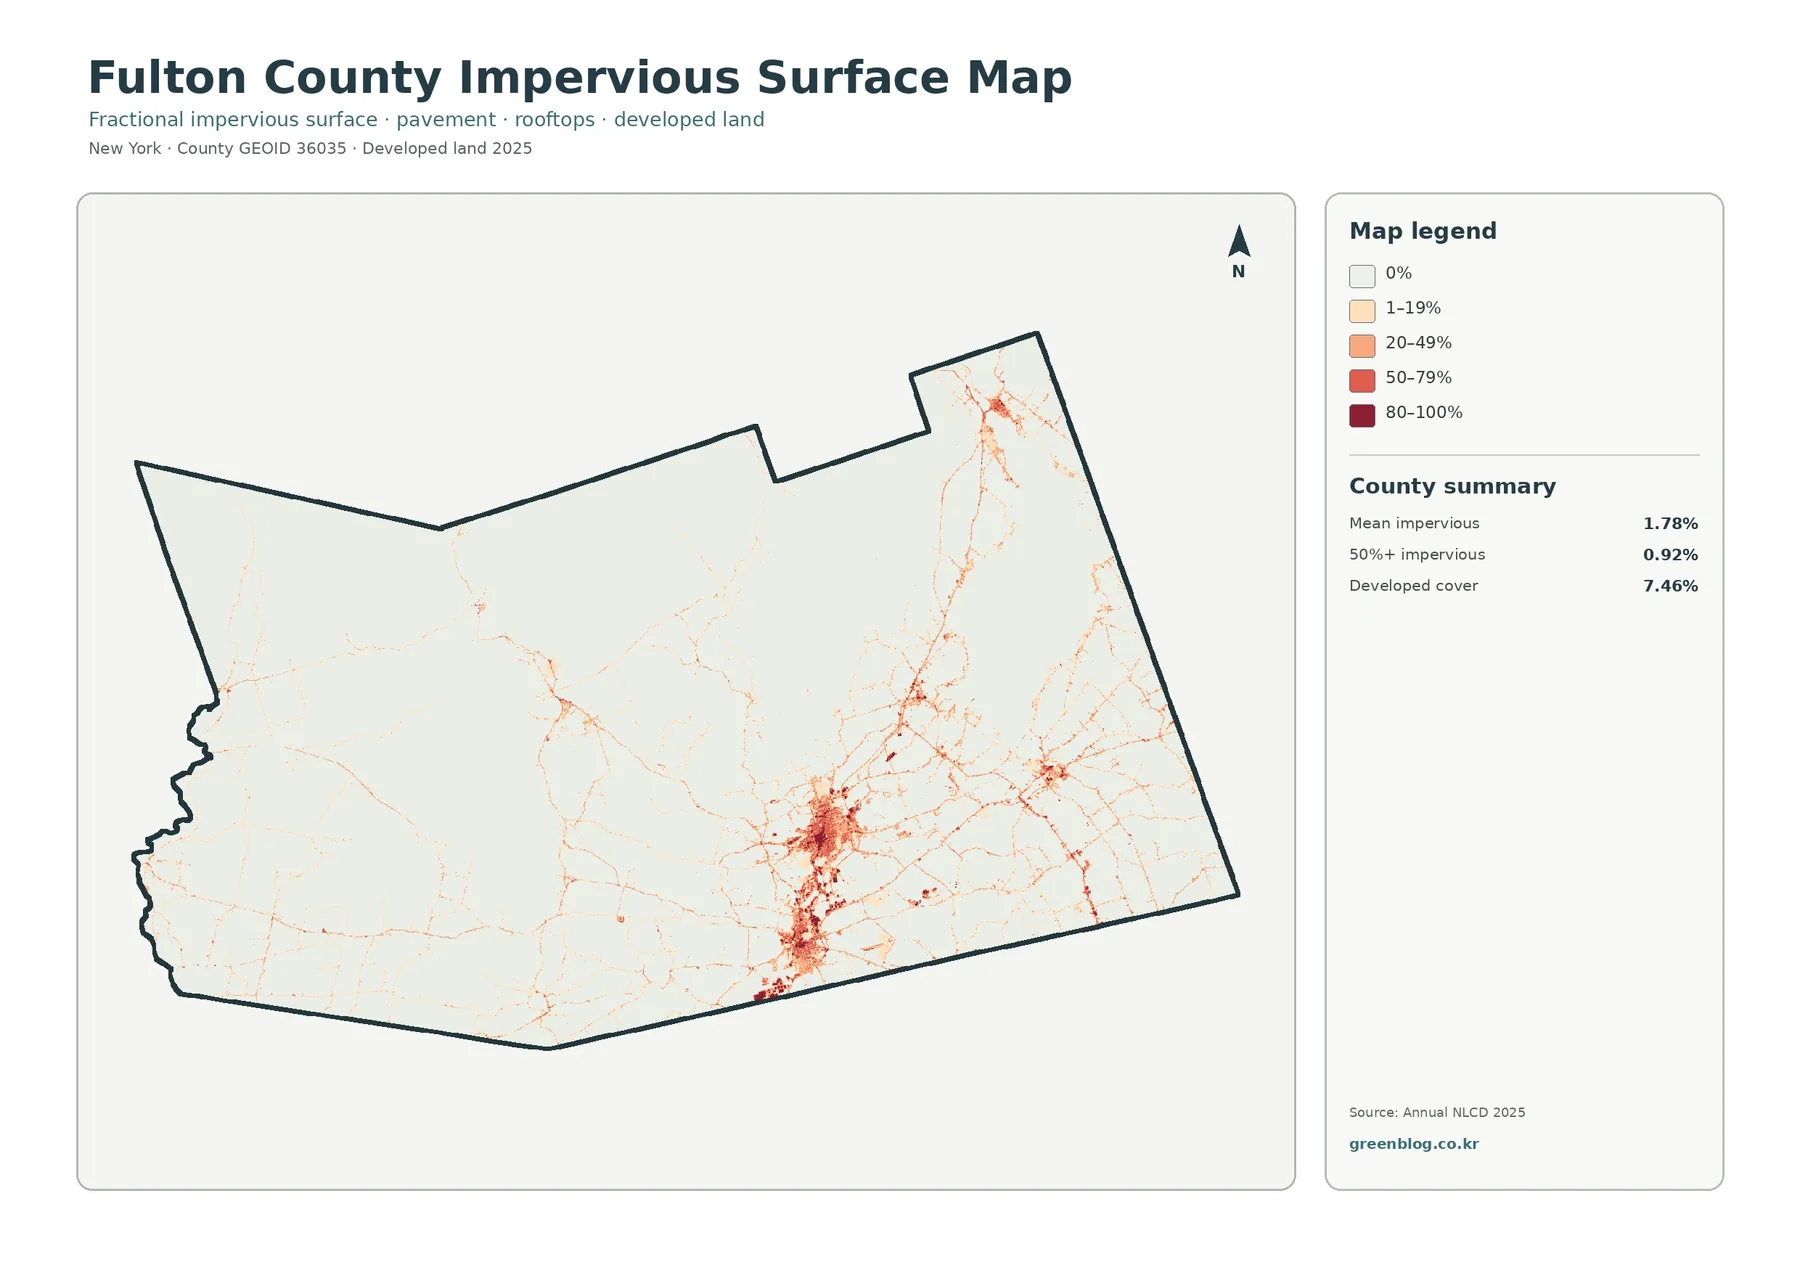
Impervious surface measures pavement, rooftops, parking areas, and other surfaces that limit infiltration. Fulton County’s mean impervious value is 1.78%, and 0.92% of the county is mapped at 50% impervious or greater. Both figures are well below the 7.46% developed-cover share because developed classes can include lawns, trees, and other permeable surfaces.
Most of the impervious map is pale. Across the forested north and west, roads appear as thin lines with small higher-value spots around settlements. Great Sacandaga Lake is not shown as a developed surface, so the surrounding road pattern stands out against a mostly low-impervious background.
The strongest concentration is in the south-central part of the county. The Gloversville–Johnstown area forms a compact cluster of orange and dark red values, with additional linear development following roads outward from the cities. Several smaller settlements in the southeast and northeast create secondary clusters.
This map helps distinguish a broad developed class from actual hard-surface intensity. A low-density residential area may appear developed on the land-cover map but still contain considerable vegetation and lawn. A commercial block or dense street network can have a much higher impervious percentage even if its mapped footprint is relatively small.
Impervious cover is useful background for discussions of stormwater and watershed conditions. It should not be treated as a flood-risk map, however. Runoff also depends on slope, soil, rainfall, drainage infrastructure, stream channels, and other factors that are not represented here.
Mapped change between 1985 and 2025 is widely scattered
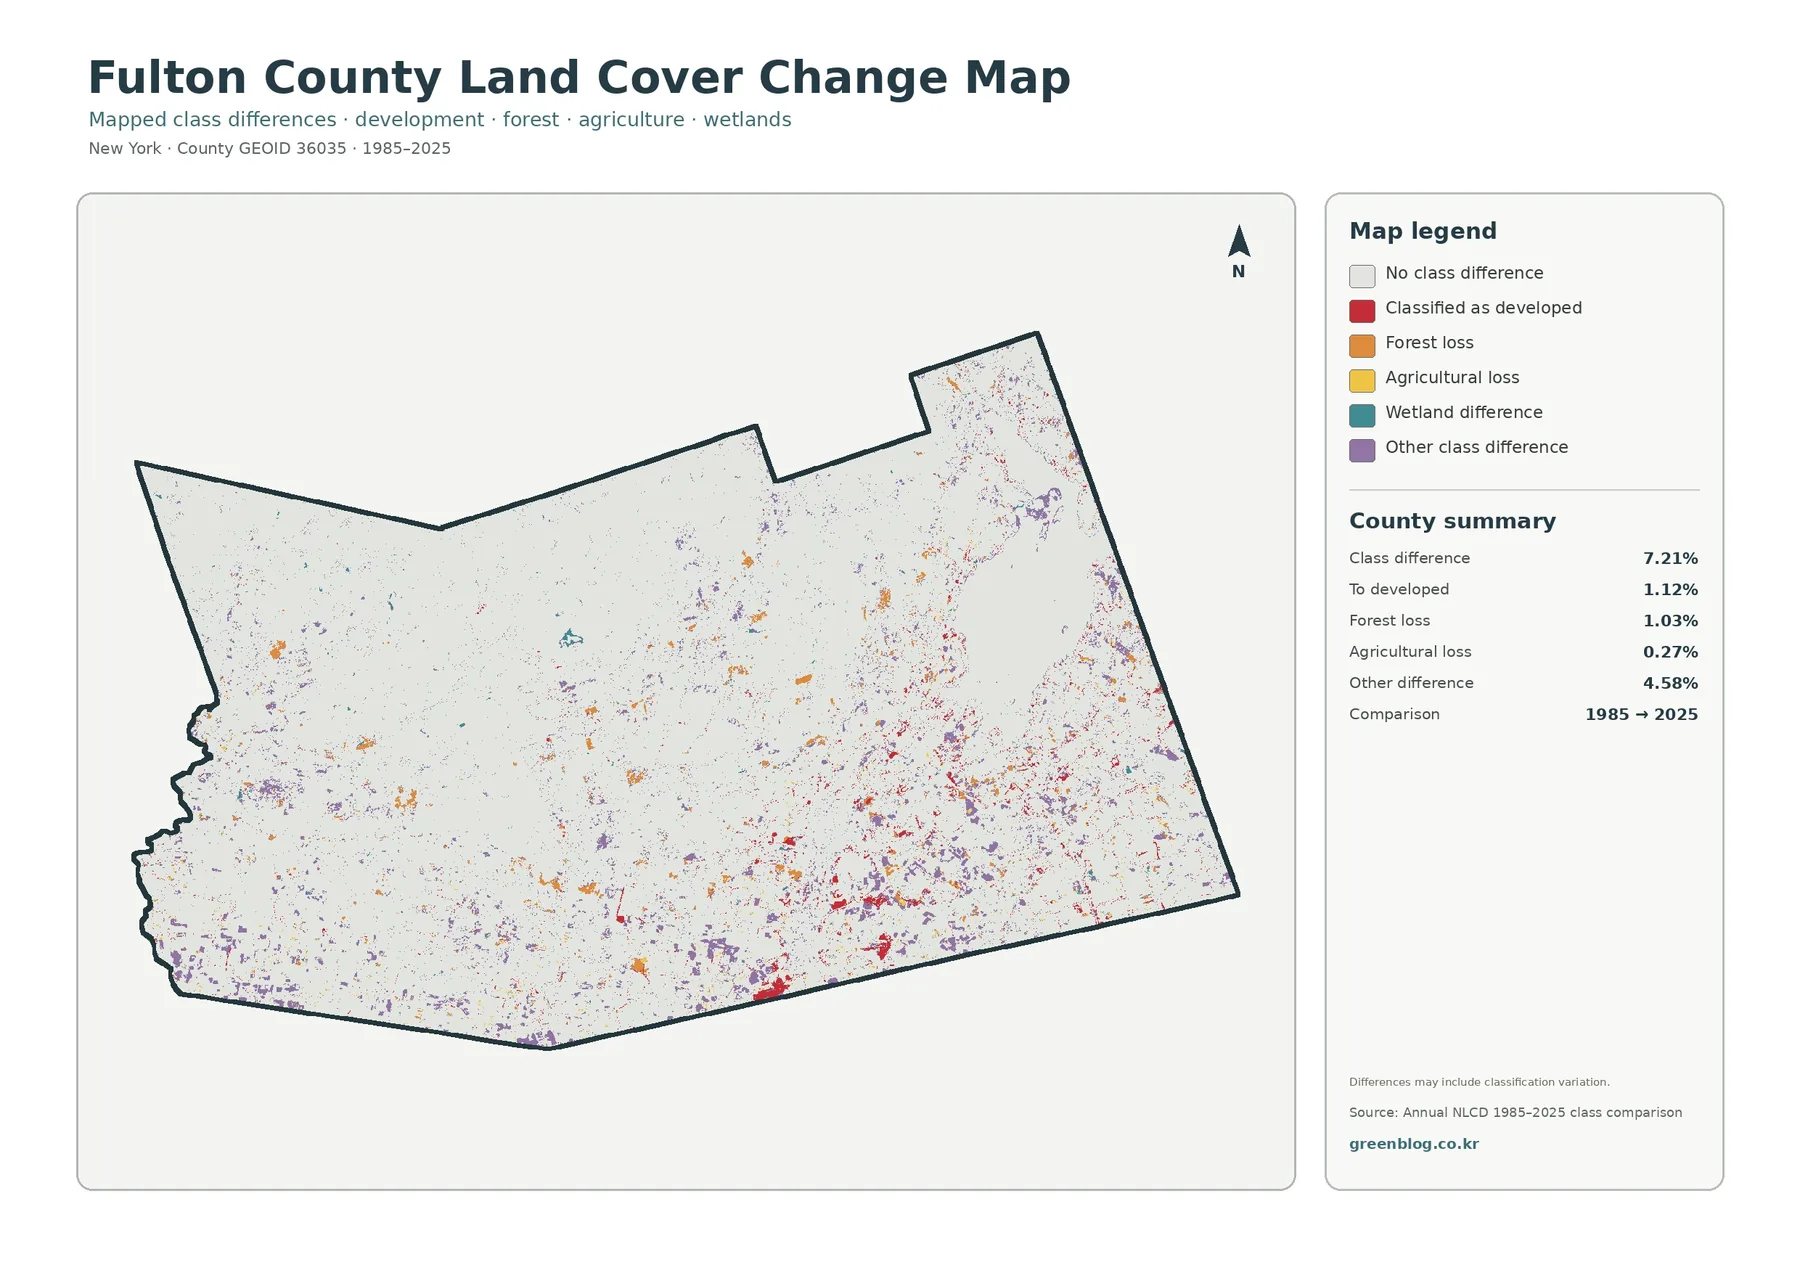
The historical layer compares class assignments in 1985 and 2025. The total mapped class difference is 7.21%. Areas classified to developed account for 1.12%, forest loss for 1.03%, and agricultural loss for 0.27%. Other class differences make up 4.58%, the largest part of the summary.
Change is not concentrated in a single broad zone. Red developed-change cells are relatively common in the southern section, especially near existing developed areas and road corridors. Smaller red marks also appear farther north and east. The pattern suggests many localized differences rather than one continuous expansion front.
Orange forest-loss cells are dispersed through the wooded interior. Some form small patches that are easy to see, while others are isolated. A colored cell should not automatically be read as a confirmed logging or construction event. The change layer records a difference between two classifications, not a verified explanation for that difference.
Purple other-class differences are more numerous than any single named change type. Classification can vary because of real landscape change, seasonal imagery, mixed pixels, or differences in the way a cell is assigned to a class. The map itself notes that classification variation may be included.
For a site-specific investigation, the most useful next step is to compare the marked location with historical aerial photographs, recent imagery, local planning records, or field information. The countywide change map is best treated as a screening layer that identifies places worth a closer look.
Great Sacandaga Lake is a useful geographic reference
Great Sacandaga Lake is more than a large blue feature on the map. It provides a clear reference point for comparing the county’s landscapes. The west and northwest sides are dominated by forest and wetlands, while the southern and eastern approaches include more roads, farm cover, and developed areas.
Fulton County’s official profile describes Great Sacandaga Lake as one of the county’s major recreational resources and notes that a large share of the county lies within the Adirondack Park. Those regional characteristics are visible in the land-cover data as extensive forest, numerous water bodies, and a relatively low countywide impervious percentage.
The lake should not be interpreted as a boundary between completely separate land-cover systems. Forest, wetland, agriculture, and development all occur on both sides. The value of using the lake as a reference is that it helps readers orient themselves before examining smaller patterns.
Frequently Asked Questions
What is the dominant land-cover class in Fulton County?
Forest is the largest 2025 class at 61.41%. Wetlands account for 12.82%, agriculture for 10.31%, developed land for 7.46%, and water for 6.75%.
Why is developed cover 7.46% while mean impervious surface is only 1.78%?
Developed land is a broad class that can include lawns, trees, and other permeable surfaces. Impervious cover measures hard surfaces such as pavement and rooftops, so it represents a smaller share of the county.
Does the 7.21% class difference mean that all of that area definitely changed land use?
No. It means the mapped class differs between 1985 and 2025 at those cells. Real landscape change can contribute, but image conditions, mixed pixels, and classification variation can also produce differences.
Raster data and interpretation limits
These maps use raster data, which divide the landscape into small grid cells and assign a representative class or percentage to each cell. Narrow roads, small buildings, stream edges, and field boundaries can therefore be generalized. A crisp line between colors should not be treated as an exact property or ecological boundary.
A mixed pixel occurs when several surface types fall inside the same grid cell. A cell at the edge of a forest may also contain grass, pavement, or a building. The classification still has to choose a representative value, which is one reason small isolated patches deserve more caution than large continuous areas.
The observation year matters as well. The current land-cover, forest-and-farmland, and impervious layers use the supplied 2025 classification. Construction, vegetation change, or agricultural activity that occurred afterward will not be represented until a later dataset captures it.
The change layer compares two endpoints, 1985 and 2025. It does not provide a continuous year-by-year history. A location may have changed more than once between those dates, and the final comparison alone cannot reconstruct every intermediate step.
Download the map files
The downloadable ZIP contains four JPG maps for Fulton County: the 2025 general land-cover map, the forest-and-farmland map, the impervious-surface map, and the 1985–2025 land-cover comparison. The matching layouts make the set useful for reports, classroom handouts, and presentation slides.
Map File Information
Fulton County Land Cover Map Files
- Included Files: Use only the versions confirmed in the article and supplied images
- File Type: Use the confirmed download contents
- Intended Use: Printing, education, presentations, and map-based projects
Related Maps
- Albany County Land Cover Map
- Bronx County New York Land Cover Map
- Cattaraugus County New York Land Cover Map
Sources and references
- MRLC Annual NLCD Data — official access to Annual NLCD products and supporting data.
- USGS Annual NLCD Land Cover Classification — descriptions of the land-cover classes used in Annual NLCD.
- Fulton County Planning Department — county information on planning, agriculture, wetlands, flood hazards, and related programs.
- Fulton County Agriculture — local information on the agricultural district and farmland-protection work.
Green Map creates custom-edited map images using open geographic data sources such as geoBoundaries, Natural Earth, OpenStreetMap, and government open data.
These maps are edited visual materials, not raw data files, and are provided for education, documents, presentations, and graphic reference.