An Oregon Map becomes much easier to read when the state’s 36 counties are shown as separate shapes rather than hidden inside a general map of the Pacific Northwest. The three supplied views use the same county framework in different ways: a softly colored reference, a black-and-white labeled sheet, and an unlabeled outline. Together, they let readers study names, compare positions, print a low-ink copy, or build a labeling activity without changing the underlying geography.
The labeled versions place every county name inside or next to its boundary. They also show Washington above the state, Idaho to the east, and the Pacific Ocean along the west coast. Those surrounding labels give useful orientation, but this is not a complete border-state diagram: California and Nevada are not named on the artwork. Teachers, students, writers, and presentation designers should therefore treat the files as county-reference maps, not road maps or all-purpose regional atlases.
The archive information identifies an A3 layout and JPG, PNG, and ZIP delivery. That makes the set suitable for a full classroom sheet, a handout reduced to a smaller paper size, or an image placed in a document or slide. Because the three designs carry different amounts of visual information, choosing the right one before printing saves ink and leaves the right amount of space for notes.
Table of Contents
Printable Oregon Map Overview
Oregon lies on the Pacific coast, with Washington on the north, Idaho on the east, California on the south, and Nevada touching the southeast; the official Oregon Blue Book also counts the Pacific Ocean as the western edge. That broader setting explains the state outline, while the supplied maps concentrate on internal county divisions. The coast is immediately recognizable on the left, and the Columbia River portion of the northern boundary creates the irregular upper edge visible across much of the sheet.
Oregon has 36 counties. On the labeled artwork, they can be checked from Baker and Benton through Umatilla, Union, Wallowa, Wasco, Washington, Wheeler, and Yamhill. The compact northwestern counties require smaller labels, whereas Harney, Malheur, Lake, and Klamath occupy much broader spaces in the south and east. This contrast is one reason a county-level sheet communicates more than a plain state silhouette.
Oregon Map Styles Included
All three images share the same wide landscape composition and county geometry. The first adds muted fills and labels; the second retains labels but removes the county colors; the third removes both county names and surrounding geographic labels while keeping the boundary network. None is a separate thematic dataset, so the choice is about reading, printing, or adding information rather than selecting different geographic coverage.
- Color: fastest for distinguishing adjacent counties on a screen or projected slide.
- Black and white: labeled reference with minimal color dependence and room for pencil or pen marks.
- Outline: blank county interiors for quizzes, coloring, categories, or custom labels.
Color Oregon County Map
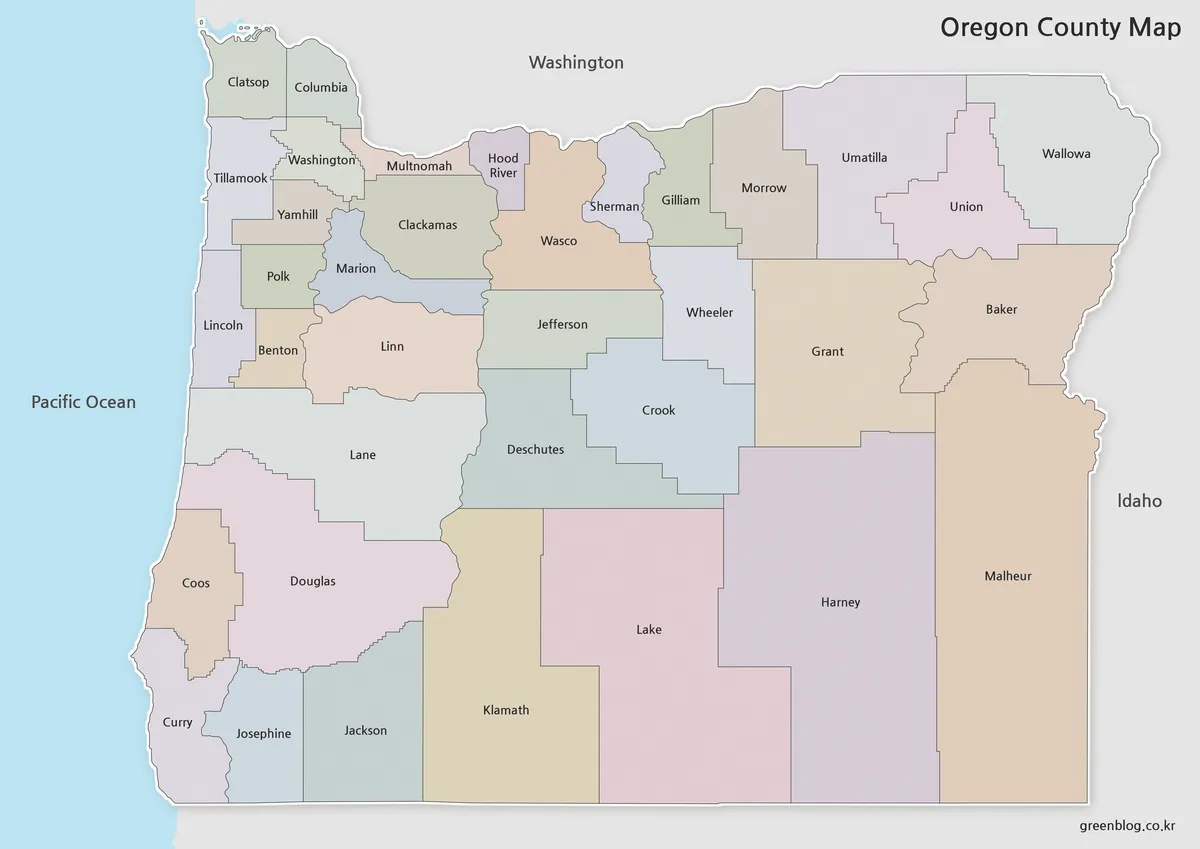
The color version uses pale alternating fills, not a legend or data scale. Color should therefore be read only as a device for separating neighboring shapes. It does not classify population, climate, politics, land ownership, or elevation. That distinction matters when the image is placed in a report: a reader should not be invited to infer meaning from the palette that the map never supplies.
This version is strongest when names need to remain legible during a quick visual explanation. The dense group around Washington, Multnomah, Clackamas, Yamhill, Polk, and Marion is easier to follow because touching counties do not merge into one white field. In eastern Oregon, the fills also help trace the stepped edges between Grant, Baker, Harney, and Malheur without adding heavy lines.
Black and White Printable Oregon Map
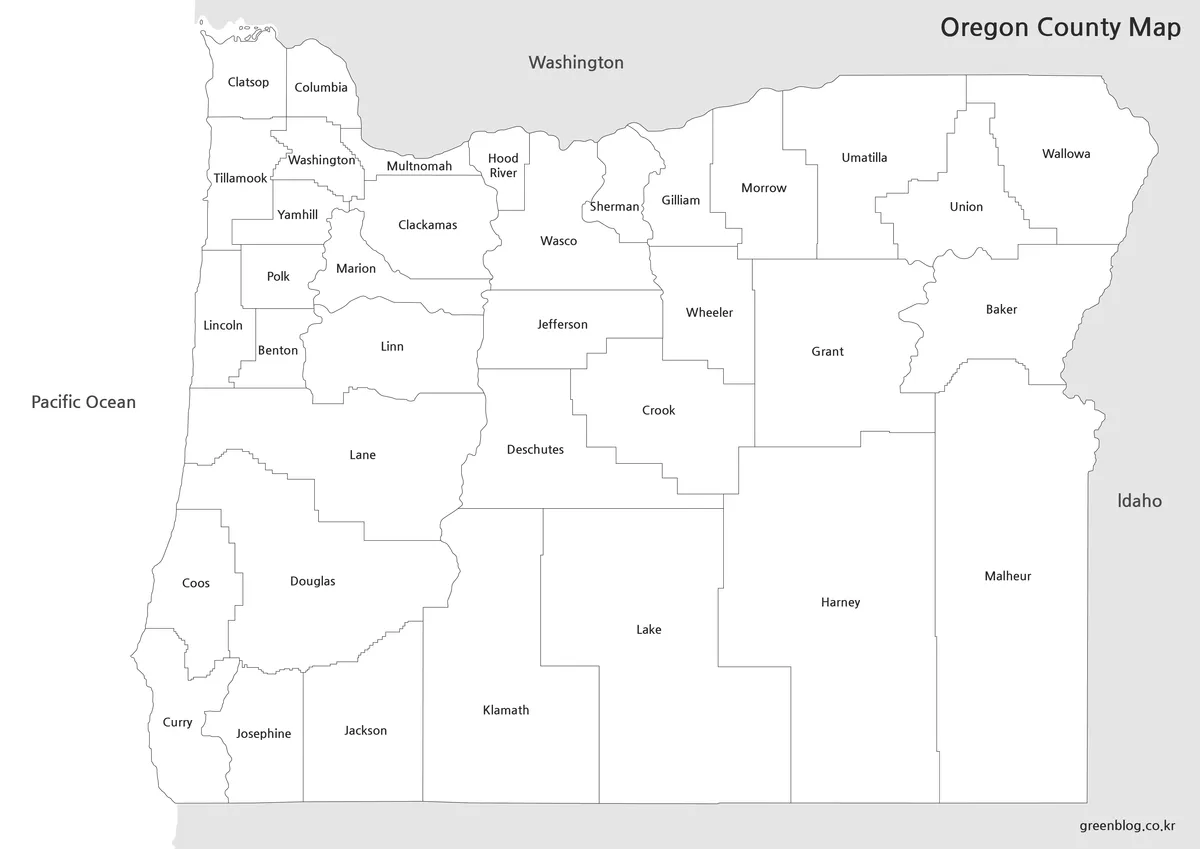
The monochrome sheet keeps the county names, state title, Washington and Idaho labels, and Pacific Ocean label while leaving county interiors white. Its light gray lines reduce visual weight but still separate all 36 units. It is the clearest choice when students need a named reference beside a worksheet or when a report needs a neutral graphic that will not compete with surrounding charts.
For smaller prints, check the northwest corner before producing a class set. County names such as Hood River, Sherman, and Gilliam occupy narrow spaces and will become harder to read as the entire landscape page is reduced. Printing at the confirmed A3 layout preserves more label room; selecting landscape orientation and avoiding aggressive “fit to narrow margin” settings also helps.
Blank Oregon Outline Map for Editing
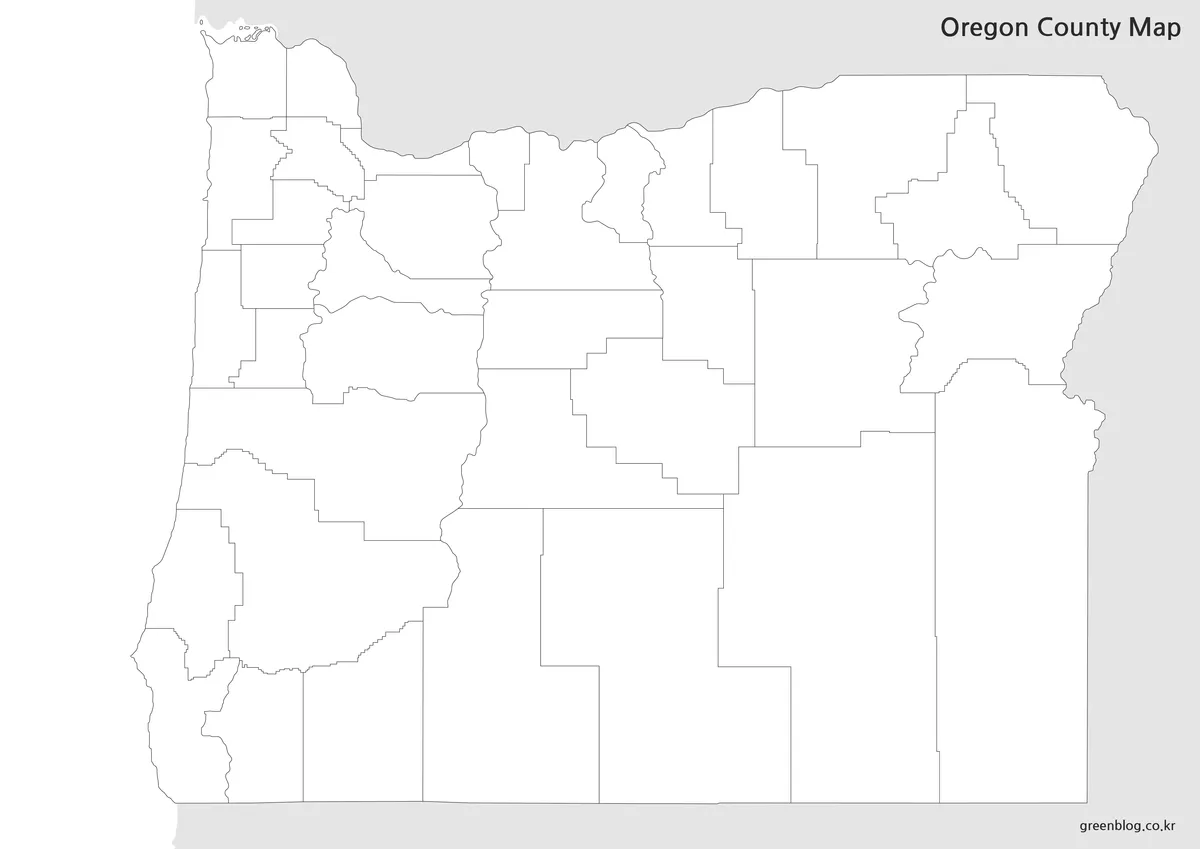
The outline edition removes all county names and the surrounding Washington, Idaho, and ocean labels. It retains the state silhouette, every county boundary, and the title printed above the map. This creates a controlled exercise: learners can supply names from memory, match a separate county list to shapes, or build their own legend without starting from an empty rectangle.
For a labeling task, begin with visually distinctive anchors. Clatsop sits at the northwestern tip; Curry reaches the southwestern corner; Wallowa fills the northeastern corner; and Malheur forms much of the southeastern edge. Large counties such as Harney and Lake can orient the southern interior, after which the smaller Willamette Valley and lower Columbia counties can be added.
Designers can use the empty spaces for qualitative categories, but they should add a legend and a source whenever colors represent real information. The supplied outline is a raster image rather than a claimed vector or GIS layer. It is appropriate for visual annotation and simple graphics, not for measuring area, drawing legal boundaries, or performing spatial analysis.
Why an Oregon County Map Is Helpful
The county pattern makes several Oregon-specific relationships visible. A narrow chain of coastal counties follows the Pacific side, a tight cluster appears around the lower Columbia and northern Willamette Valley, and much larger shapes dominate parts of the interior and southeast. Those are visual observations about this sheet, not formal regional boundaries, but they give readers a useful framework for asking where a county sits and which counties touch it.
The map also prevents a common scale problem. On a full United States page, Multnomah or Hood River County would be too small for a comfortable label, while Harney and Malheur would occupy visibly larger areas. Giving Oregon its own landscape page makes both extremes readable and shows why label placement is more difficult in the northwest than in the southeast.
Practical Uses for Oregon Map Files
For a classroom sequence, show the color reference first, distribute the black-and-white sheet for guided notes, and finish with the outline as a recall check. Students can identify corner counties, label the coast, compare compact and expansive county shapes, or explain which neighboring labels are present and absent. This progression changes the cognitive task without changing the boundary framework.
In presentations, use the color image when rapid separation matters and the monochrome image when another graphic supplies the main color scheme. For a custom infographic, the blank version provides the cleanest base, but add labels, a legend, a date, and a cited data source if the finished graphic makes factual claims. Keep sufficient resolution when resizing so the fine northwest boundaries do not soften.
Before printing a large batch, open the intended file, choose landscape orientation, and make one proof. Confirm that the page is not cropped, county names remain readable, and pale boundary lines survive the printer’s draft mode. When reducing from A3, preserve the aspect ratio rather than stretching the image to fill a different page shape.
FAQ
Does the Printable Oregon Map show county boundaries?
Yes. The map collection is designed around Oregon’s county-level administrative layout.
What size is the map prepared for?
The map files are prepared in an A3 high-resolution layout.
Which version is best for travel planning?
The black and white map is convenient for marking routes and planned stops. The color map is better when visual separation between counties is important.
Can I use the outline map for editing?
Yes. The outline version works well for adding colors, labels, routes, data points, and custom infographic elements.
What file formats are included?
The original download information mentions JPG, PNG, and ZIP files.
Map File Information
The archive provides three county-map views for reference, printing, annotation, and visual projects.
- Included Versions: Color, black and white, outline
- Printable Size: A3 layout
- File Type: JPG, PNG, ZIP
- Intended Use: Lessons, handouts, presentations, labeling, and simple infographic work
Related Maps
Additional Resources
- Oregon Counties — The State of Oregon’s county page confirms the statewide total and provides links to county governments.
Green Map creates custom-edited map images using open geographic data sources such as geoBoundaries, Natural Earth, OpenStreetMap, and government open data.
These maps are edited visual materials, not raw data files, and are provided for education, documents, presentations, and graphic reference.