An Oklahoma Map has to accommodate two very different visual forms: a long, narrow panhandle in the west and a broader main body that reaches the Arkansas border. The supplied set divides that shape into all 77 counties and presents the same boundary network in three treatments—a pastel labeled reference, a black-and-white labeled sheet, and an unlabeled outline for recall or custom annotation.
The panhandle begins with Cimarron, Texas, and Beaver counties. Farther east, rectangular areas give way to increasingly irregular county shapes, especially around Osage, Pawnee, Creek, Tulsa, Sequoyah, and the southern border. This changing pattern makes the county view more useful than a plain state silhouette for lessons, reports, and regional comparison.
These graphics are administrative references rather than city, road, or terrain maps. Oklahoma City and Tulsa are not plotted as cities; “Oklahoma” and “Tulsa” are county labels. No county seats, highways, rivers, lakes, elevation, scale bar, or compass are included, so the images should not be used for navigation or physical-geography measurement.
Table of Contents
Printable Oklahoma Map Overview
Oklahoma has 77 counties, a total confirmed by the Oklahoma State Election Board and the Oklahoma Historical Society. Both labeled images place a name in every county. The smallest or narrowest shapes require compact text, including Washington, Tulsa, Oklahoma, Coal, Murray, and Marshall, while larger counties such as Osage, Woodward, Caddo, Comanche, and McCurtain provide more room.
The state borders Colorado and New Mexico at the far western end, Kansas to the north, Missouri and Arkansas to the east, and Texas to the south and west. The artwork labels only Kansas, Arkansas, and Texas. It omits Colorado, New Mexico, and Missouri, so the frame is not a complete neighboring-state reference.
There are two uses of “Texas” in the color and monochrome views: Texas County is the middle panhandle county, while the larger word outside the state identifies neighboring Texas. Their placement distinguishes them, but a caption can prevent confusion for younger readers. The outline removes both names and all other labels.
The Oklahoma Map also shows why the panhandle should be read as part of the complete state rather than as an inset. Cimarron, Texas, and Beaver form a continuous west-to-east strip attached to Harper County and the main body. Their narrow placement creates a large area of empty page below the western extension, but that space is a consequence of preserving the statewide geometry. Cropping it too aggressively can remove the external Texas label or make the panhandle appear detached from the remainder of Oklahoma.
Available Oklahoma Map Versions
All three previews share a wide landscape canvas, the same county geometry, a location-pin icon, and the title area. The color version adds pastel county fills and names; the monochrome version keeps the names without color; and the outline removes the names and surrounding-state context. The consistent base makes it possible to move between reference, printing, and labeling tasks.
No version includes a statistical legend because the colors do not represent data. None identifies county seats or city locations, even when a county shares a familiar city name. Users adding population, election, energy, agriculture, or health information should supply a dated source and a new legend rather than treating the decorative fills as categories.
Color Oklahoma County Map
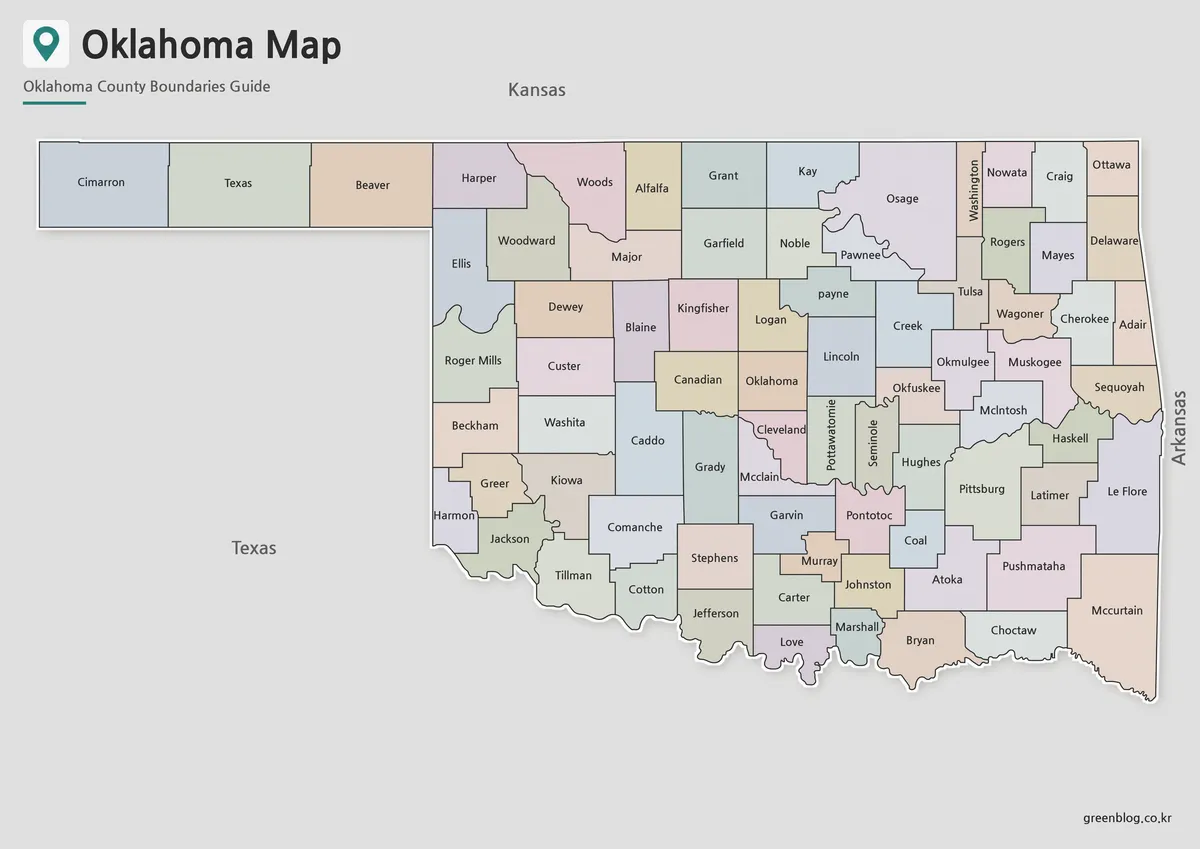
The color Oklahoma Map uses muted alternating fills to separate neighboring counties. This is especially helpful across the panhandle and northwestern blocks, where adjacent rectangular shapes can blend together in a monochrome view. The fills continue through the more irregular central, eastern, and southern counties without assigning regional meaning.
Readers can follow the northern edge from Cimarron through Texas, Beaver, Harper, Woods, Alfalfa, Grant, Kay, Osage, Washington, Nowata, Craig, and Ottawa. The southeast ends with Le Flore, Pushmataha, Choctaw, and McCurtain, while the curving southern edge passes counties such as Love, Marshall, Bryan, and Choctaw.
One label needs correction if the image is used as a spelling model: Payne appears as lowercase “payne” in both labeled editions. The county boundary is present, but editors preparing formal material should add a corrected caption or overlay rather than copying that capitalization.
Black and White Printable Oklahoma Map
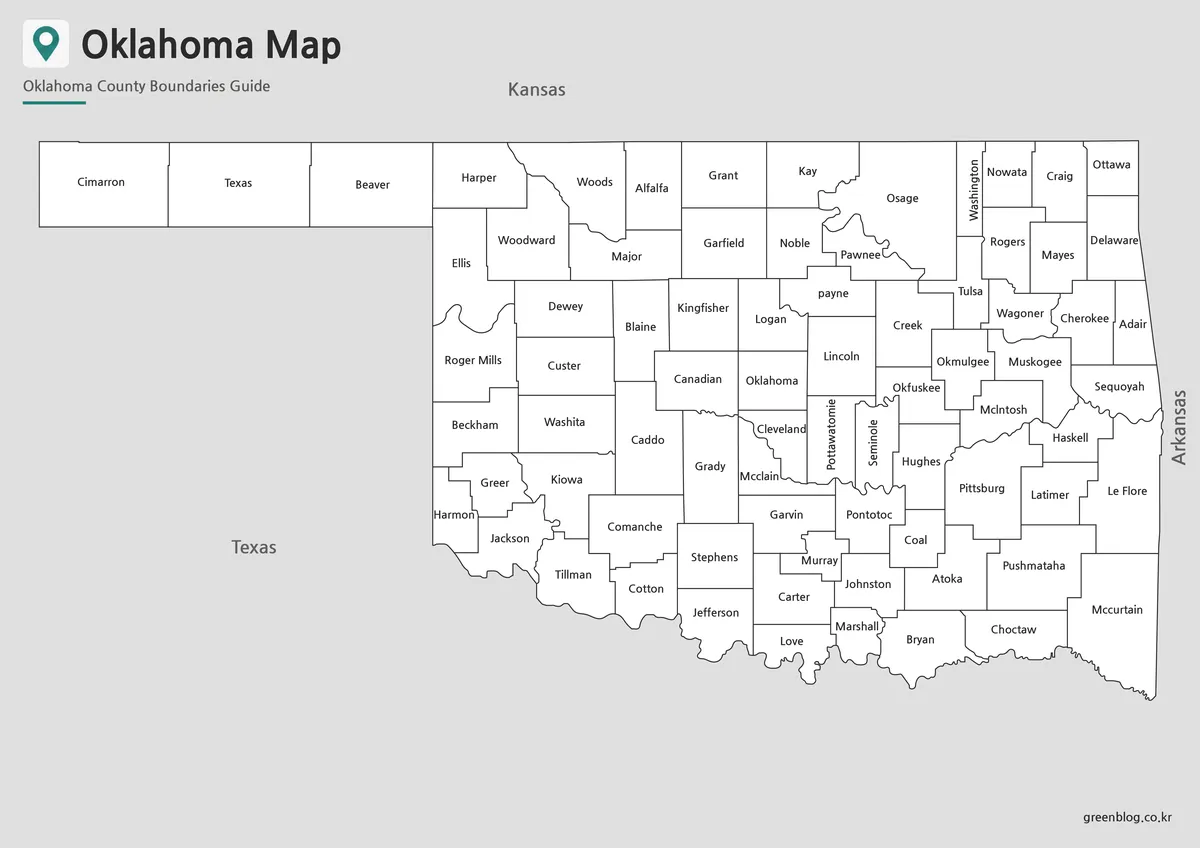
The monochrome edition retains all county names, internal boundaries, and the three printed neighboring-state labels. Removing the pastel fills reduces ink coverage and provides white interiors for light notes, symbols, or shading. It remains an answer reference rather than a blank exercise because the names are already visible.
This version suits a report appendix, a classroom review sheet, or a handout that will be photocopied. Test one copy at the intended size before producing a large batch. Vertical labels such as Washington and Pottawatomie, along with compact names around Tulsa and central Oklahoma, need enough width to remain legible.
The southern and eastern boundaries are visibly irregular, but the rivers associated with parts of those borders are not named. Do not describe the lines as a hydrology layer. A current physical or transportation source is required when the project concerns waterways, crossings, roads, or travel distances.
Blank Oklahoma Outline Map for Annotation
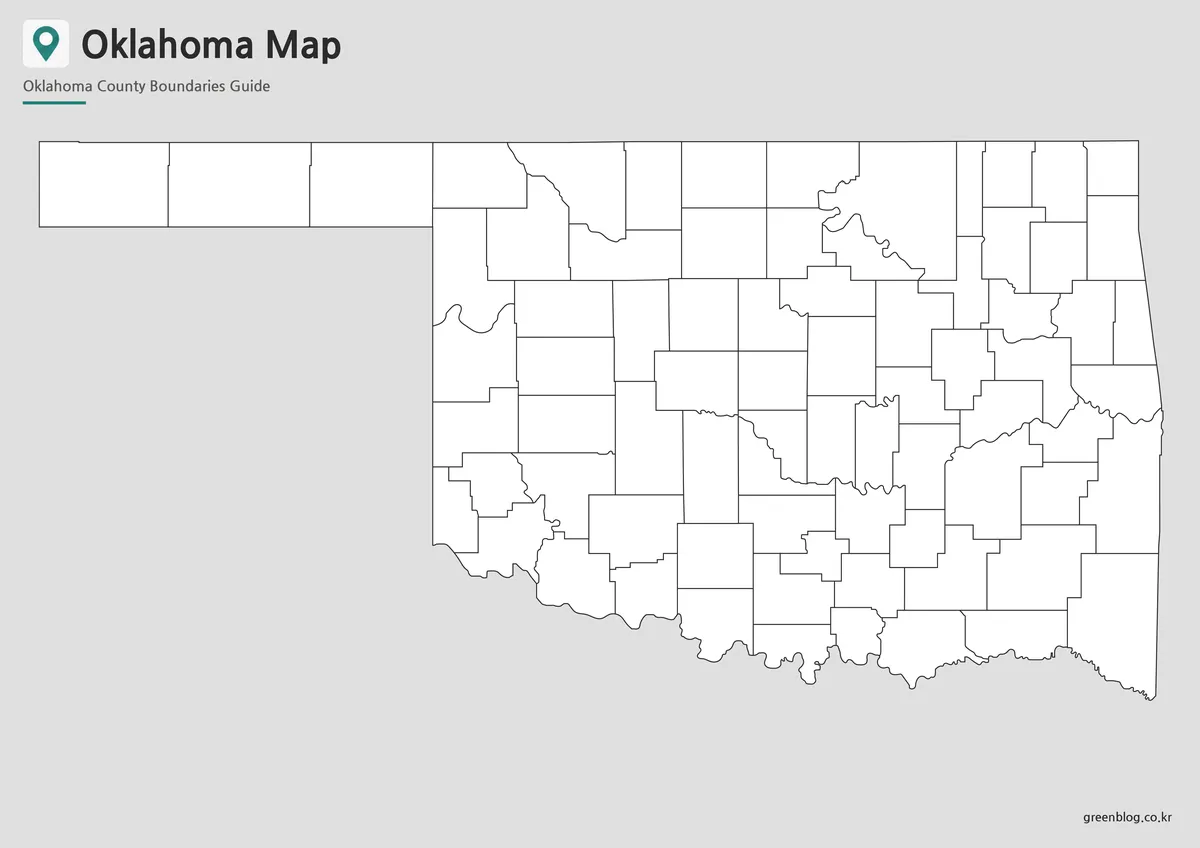
The blank Oklahoma Map removes county names, surrounding-state labels, and color while preserving all 77 county shapes. It is suitable for labeling practice, thematic coloring, selected-county highlights, and presentation overlays. The page title and “Oklahoma County Boundaries Guide” subtitle remain in the header.
A practical labeling sequence begins with the three panhandle counties, moves across the northern edge, and then works through the main body by rows or recognizable shapes. Keep the labeled edition nearby for checking difficult names such as Pottawatomie, Pushmataha, Okfuskee, Okmulgee, and McIntosh.
The preview is a raster image rather than a collection of individually selectable vector polygons. It can accept text, arrows, and light fills in common document or graphics software, but enlarging it far beyond its native dimensions may soften thin lines. Preserve an untouched master and edit a duplicate.
Best Uses for This Oklahoma Map Collection
A coordinated lesson can introduce the county pattern with the color image, use the outline for recall or categorization, and finish with the monochrome map for checking. Because every version shares the same geometry, learners can concentrate on names and positions rather than adjusting to a redesigned base.
For presentations, the color view provides the fastest visual separation. For printed reports, the monochrome edition keeps names without large color areas. The outline works best when only a limited set of counties needs highlighting; too many dark fills, icons, and labels will obscure the dense central and eastern boundaries.
County size should not be treated as population or importance. A large western polygon may have fewer residents than a compact metropolitan county, and the map provides no demographic evidence. Any county-level comparison requires sourced values, units, a reference date, and a legend created for that specific dataset.
Choosing the Right Version
Use the color edition for quick identification and broad regional orientation. Select the black-and-white version when county names must remain visible on a low-ink page. Use the outline for a quiz, restrained thematic overlay, or custom annotation. None should replace a road map, city map, topographic map, or official boundary dataset.
Before final export, verify the Payne capitalization, distinguish Texas County from the neighboring state, and explain that Oklahoma County is not a city marker. Also note that only three of Oklahoma’s six neighboring states are printed around the frame. These checks prevent the simplified layout from being interpreted more broadly than the artwork supports.
FAQ
Does the Oklahoma Map include every county?
Yes. The labeled versions name all 77 counties, and the outline retains the same county geometry without names. Payne County is included, although its supplied label begins with a lowercase letter.
Are Oklahoma City and Tulsa marked?
No. Oklahoma and Tulsa appear as county names only. The map contains no general city symbols or county-seat markers.
Does the Printable Oklahoma Map show county boundaries?
Yes. The map collection is designed around Oklahoma’s county-level administrative layout.
Which version should I use first?
The color map is the easiest version to view first because the counties are separated visually.
Is the black and white map good for printing?
Yes. The black and white version is designed for clean printing, worksheets, reports, and classroom handouts.
Can I edit the outline map?
Yes. The outline map is suitable for adding colors, labels, markers, data, and custom regional highlights.
What file formats are included?
The original download information mentions JPG, PNG, and ZIP files.
Map File Information
The archive groups the three Oklahoma county-map image versions shown on this page.
- Included Versions: Labeled color, labeled black-and-white, and blank outline
- File Type: Image files
- Intended Use: County reference, printing, lessons, annotation, and presentation layouts
Related Maps
Additional Resources
- Oklahoma Historical Society: Counties — Check the official list of all 77 counties and their county seats.
Green Map creates custom-edited map images using open geographic data sources such as geoBoundaries, Natural Earth, OpenStreetMap, and government open data.
These maps are edited visual materials, not raw data files, and are provided for education, documents, presentations, and graphic reference.