Kimble County is easiest to understand when Junction is used as the starting point. The county map shows Interstate 10 crossing the middle of the county, several numbered routes branching away from Junction, and smaller place labels such as London, Noxville, and Wilson Place. The water map adds the feature that gives this area much of its character: the North Llano River and South Llano River approach Junction from different directions and continue east as the Llano River. All four supplied maps are also available as high-resolution A3 JPG files in the download package.
The four views are useful for different reasons rather than being alternate versions of the same picture. The county map is the best overview for roads and place names. The city map deliberately reduces the settlement information and ranks Junction as the only major city shown. The terrain-and-water map makes the river network much clearer, while the elevation map reveals a county of higher western uplands cut by lower river valleys. Reading those layers together gives a more specific picture of Kimble County than a boundary outline alone.
Table of Contents
Junction at the Center of the Road Network
Junction sits close to the middle of the mapped county and is surrounded by the densest cluster of road connections. Interstate 10 crosses from west to east through the Junction area, while route 83 runs south from the city. Other route shields shown on the map include 23, 291, 275, 377, 112, 320, 370, 372, 443, 479, 290, and 385. The exact road class is less important for a first reading than the pattern: many routes converge near Junction and then spread toward the county edges.
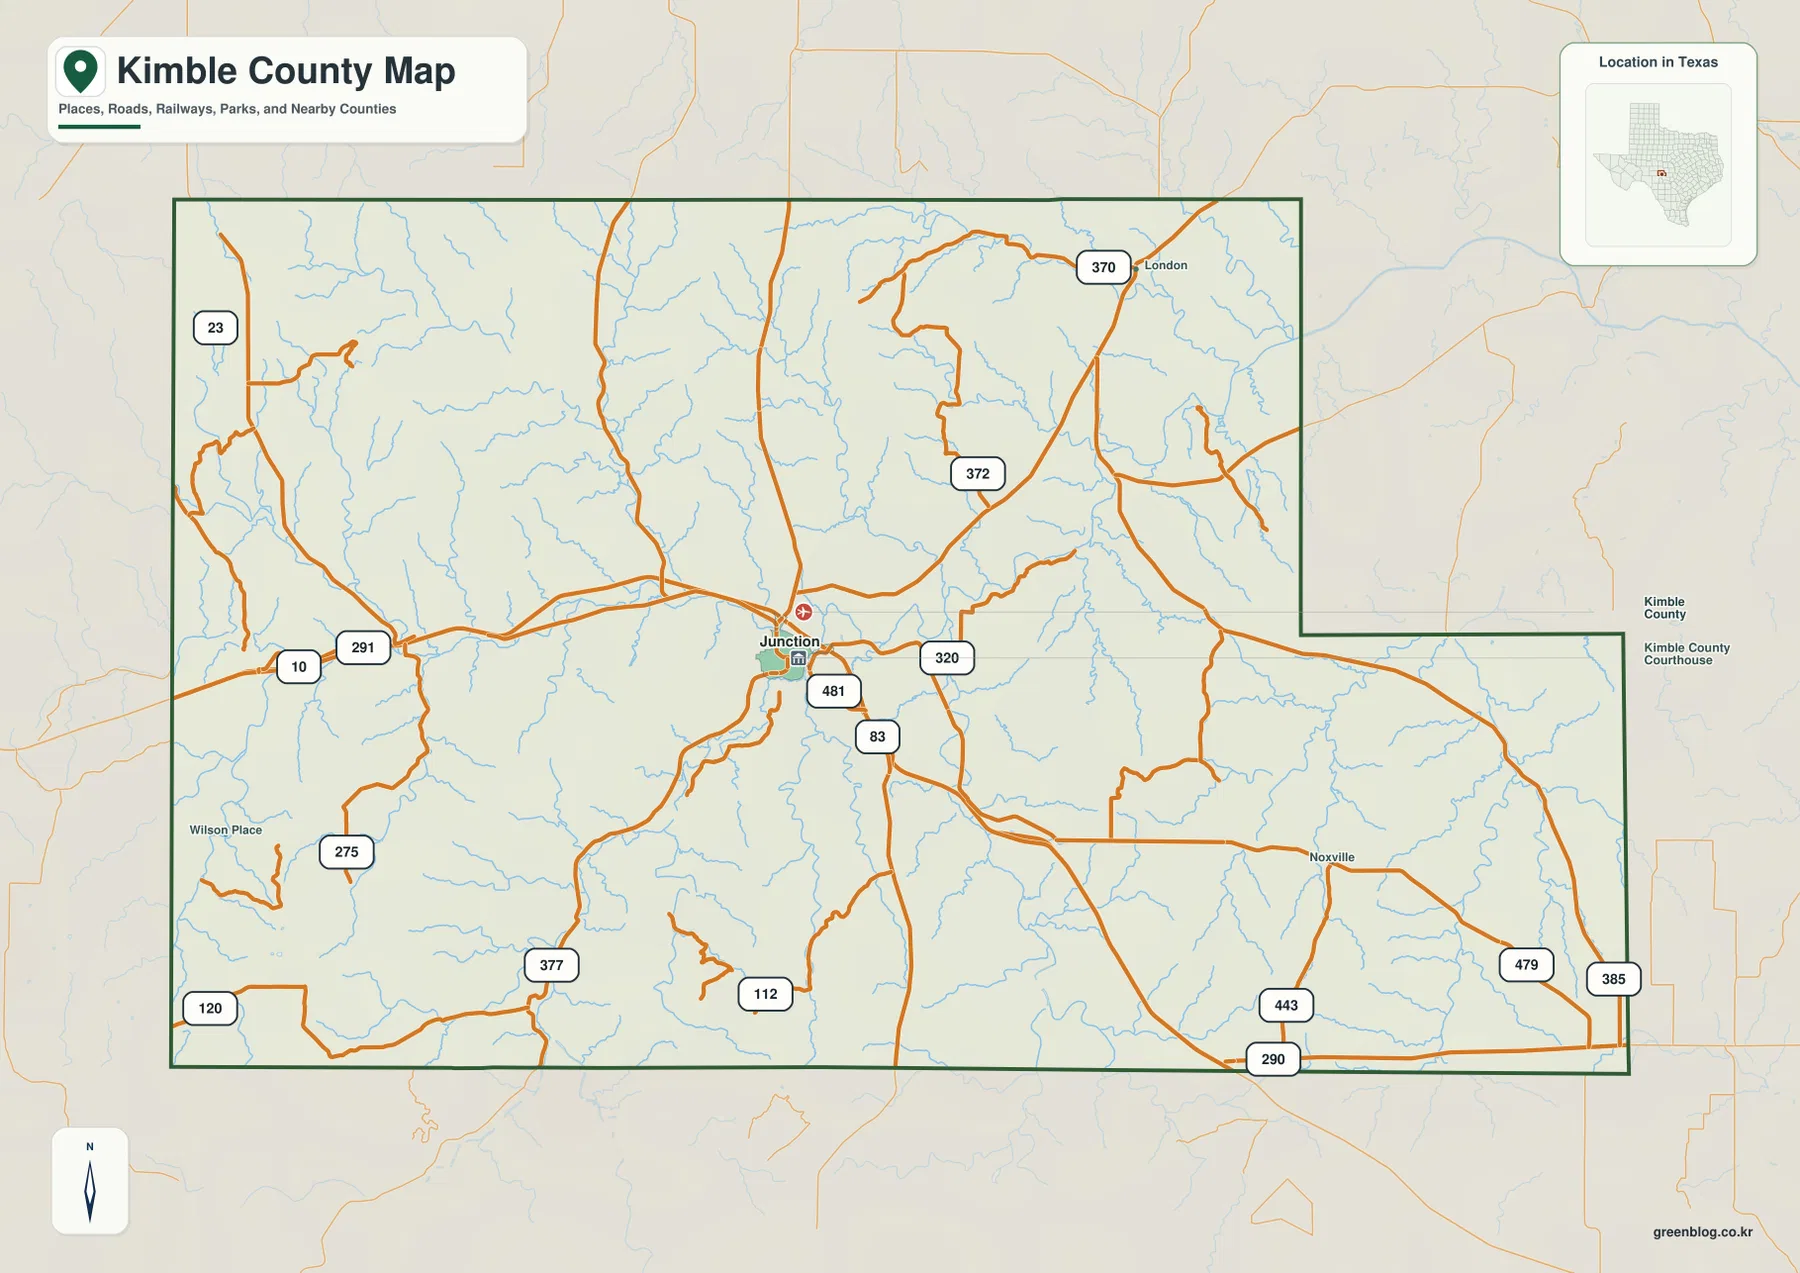
The settlement labels are widely spaced. London appears near the northern part of the county, Noxville is farther southeast, and Wilson Place is shown in the southwest. That spacing matters because it prevents the map from reading like a continuous urban corridor. Instead, Junction stands out as the main named center, with long stretches of road and drainage lines between smaller localities. The eastern boundary also has a stepped shape, so the county outline is distinctive enough to recognize once the main roads are removed.
Why the City Map Shows Only Junction as a Major City
The city map is intentionally sparse. Its ranked city index contains Junction as the single major city, while the county map carries the smaller locality names. This makes the city view useful when the question is simply where the principal urban center lies inside the county. Junction is placed near the middle of a large area filled with streams, with no second ranked city competing for the same visual weight.
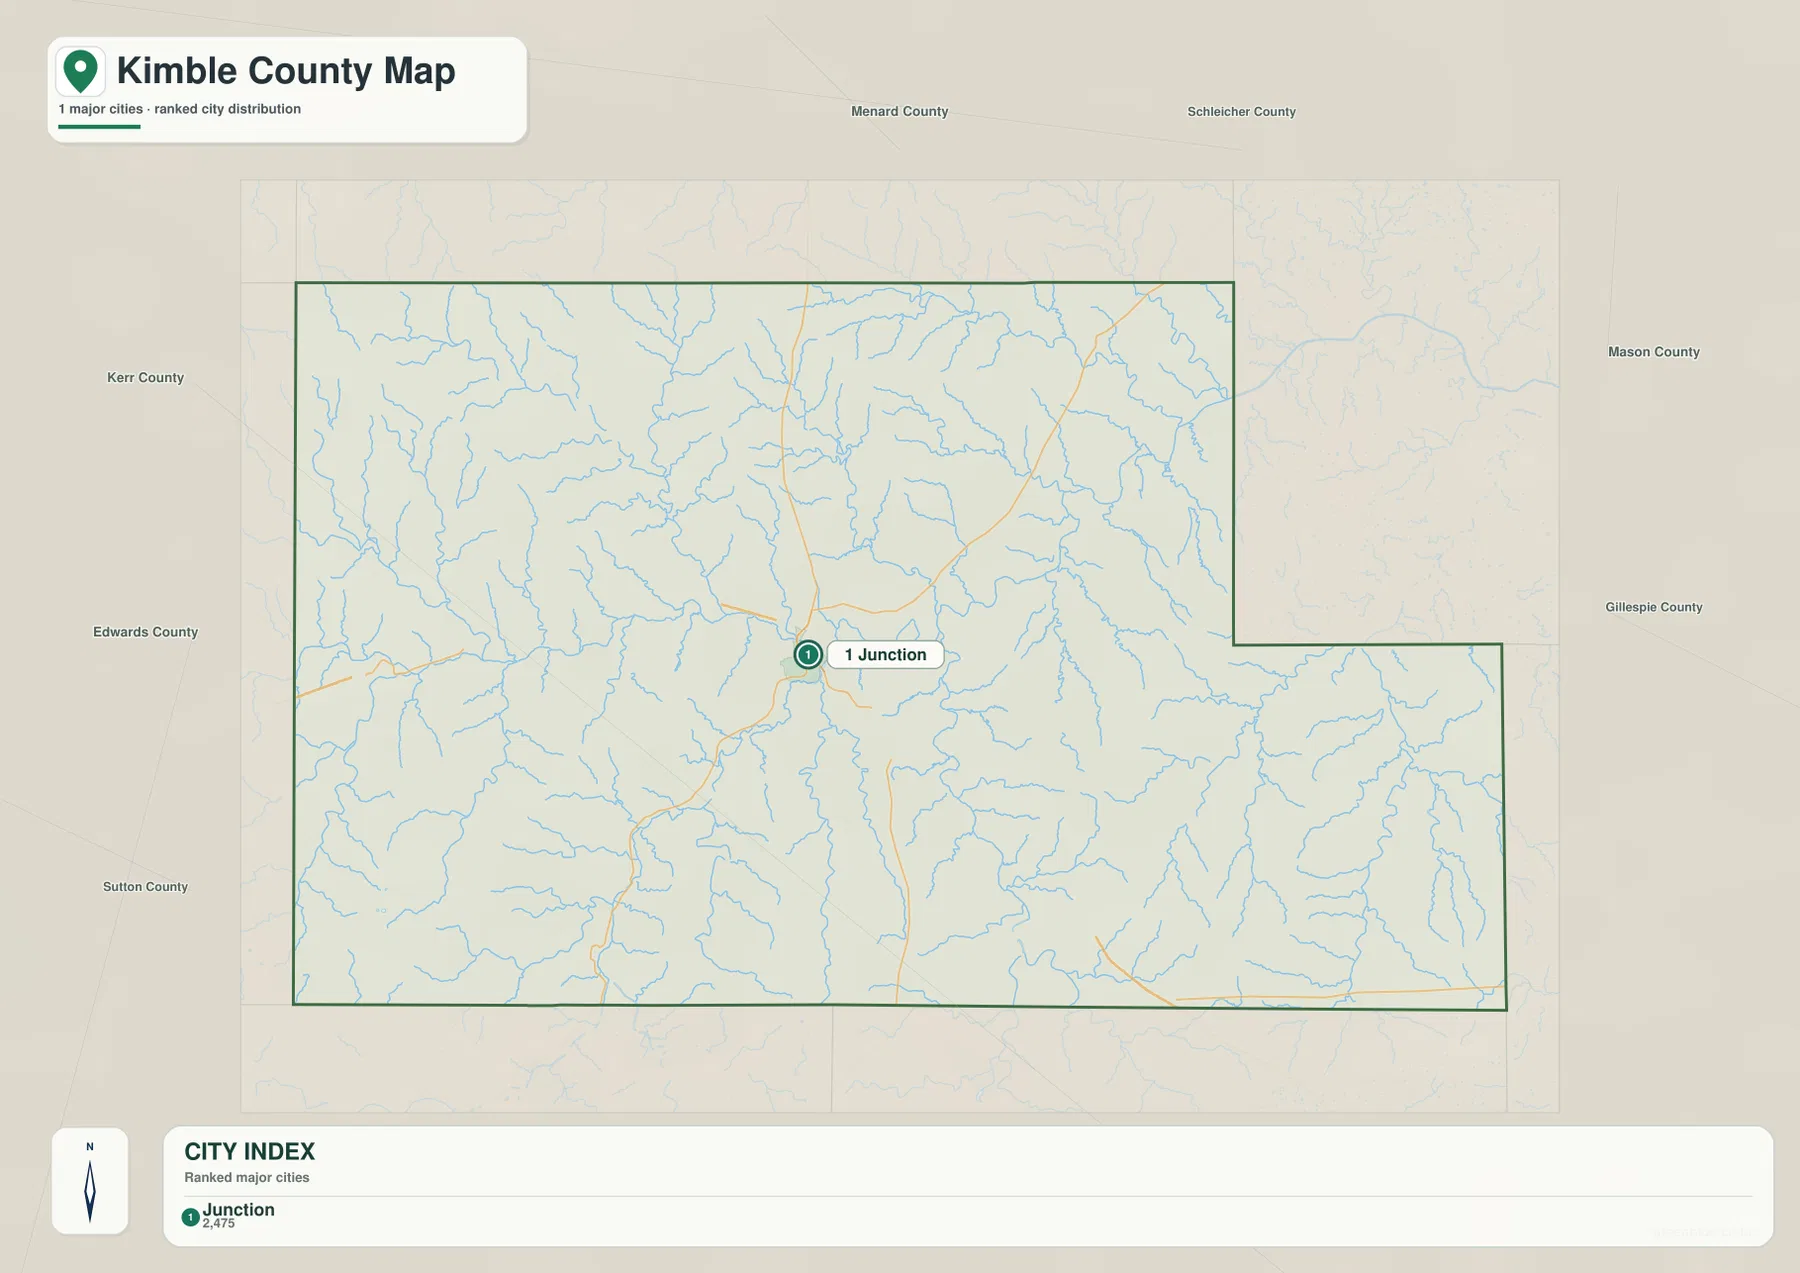
Neighboring county labels around this view provide useful orientation without adding more city symbols. Menard County and Schleicher County appear to the north, Mason County and Gillespie County to the east, Kerr County and Edwards County to the west, and Sutton County to the southwest side of the frame. Those surrounding names help place Kimble County in a broader Texas context and make it easier to follow roads that continue beyond the county line.
The Llano River Forks Define the Junction Area
The terrain-and-water map provides the clearest county-specific feature. North Llano River enters from the west, while South Llano River approaches from the southwest. Near Junction, those major channels come together and the Llano River continues eastward. The relationship is easy to follow because the principal rivers are drawn more strongly than the many smaller tributaries, turning Junction into a natural reference point as well as a road center.
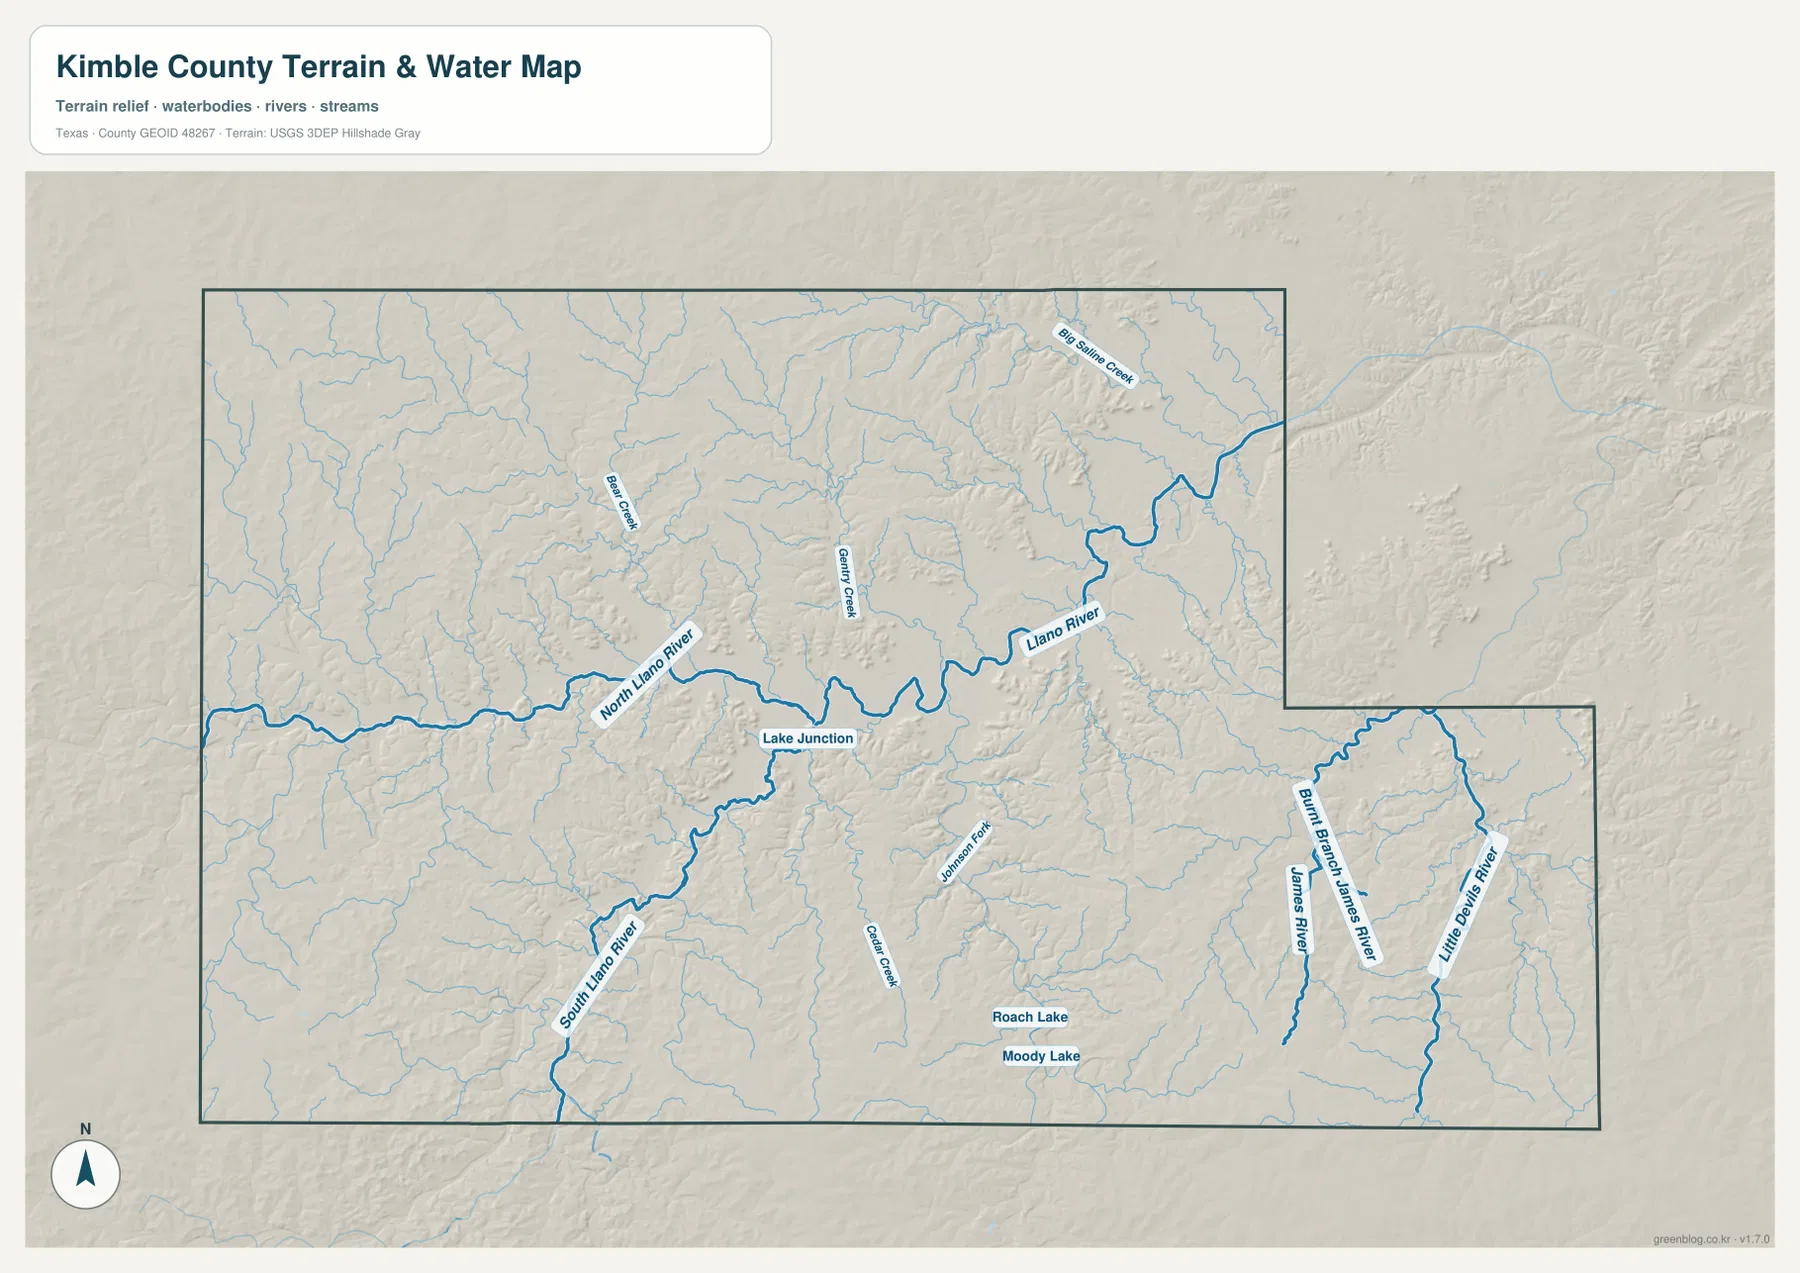
Several additional water features make the map more detailed than a simple three-river diagram. Bear Creek is labeled north of the central area, Big Saline Creek appears farther northeast, and Gentry Creek runs near the middle. Johnson Fork and Cedar Creek are marked south of the main Llano channel. In the southeastern part of the county, James River and Little Devils River form separate prominent channels. Lake Junction is identified near the central river system, while Roach Lake and Moody Lake appear farther south.
The smaller blue lines are also important visually. They branch through almost every part of the county and feed toward larger channels, especially across the western and central uplands. This creates a dense network of narrow valleys. On the eastern side, the Llano River and the southeastern rivers occupy broader, more continuous low routes. The water map therefore explains why the county appears heavily dissected even though the basic boundary is relatively simple.
Higher Western Uplands and Lower River Valleys
The elevation map confirms the terrain suggested by the drainage network. Its legend gives an actual county range of about 447 to 750 meters, with a mean elevation of 621 meters. Brown tones dominate much of the western and northwestern side, indicating higher ground. Green tones follow the lower country around Junction and extend eastward along the major river valleys. Southern ridges rise again in places, producing a repeated pattern of high divides separated by narrow lower channels.
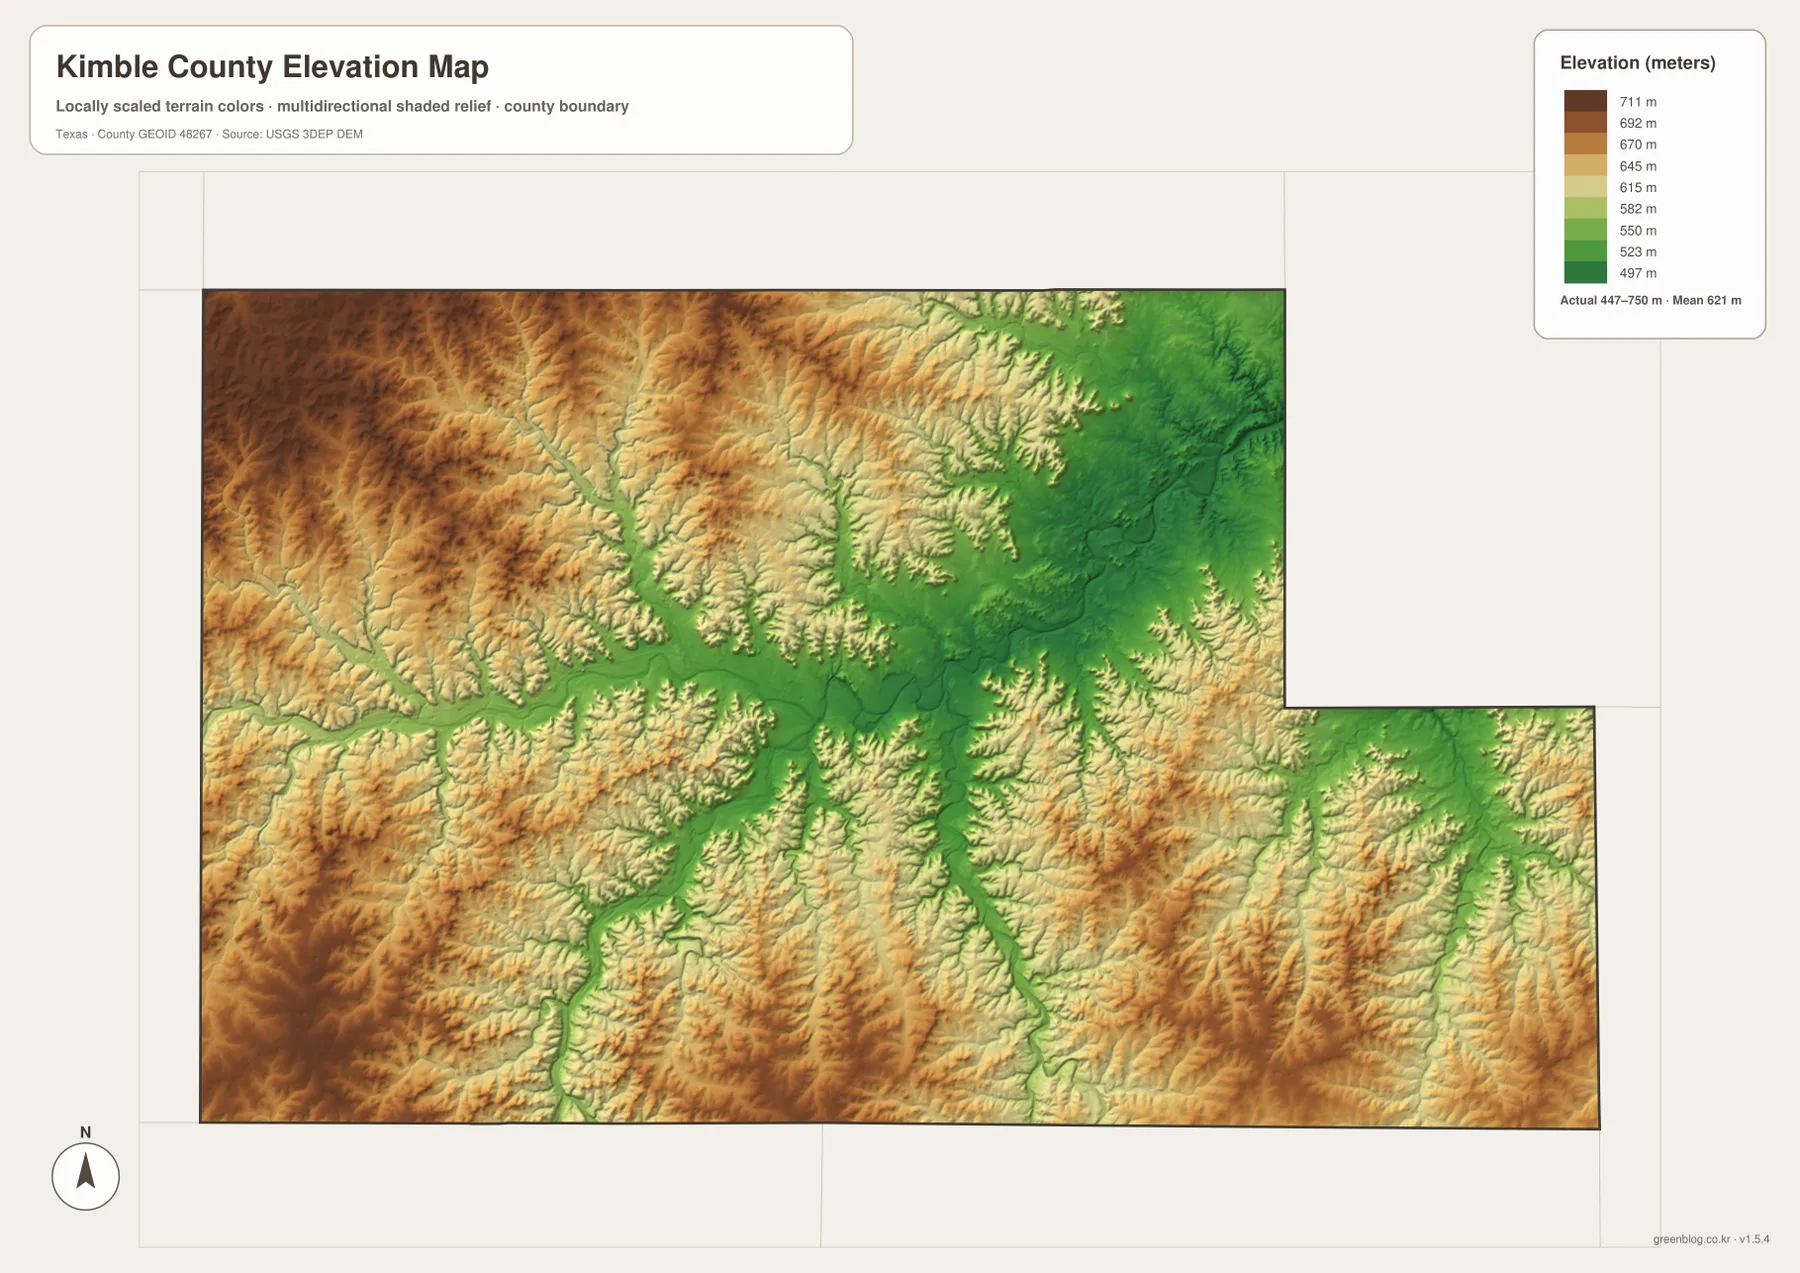
Comparing the water and elevation views makes the relationship especially clear. North Llano River and South Llano River occupy elongated low corridors cut into higher surrounding terrain. The green valley around Junction broadens where the major channels meet, then continues east with the Llano River. Smaller tributaries correspond to narrow green fingers reaching into the tan and brown uplands. This visual pairing is more informative than describing the county only as part of a plateau or hill region because it shows where the local relief actually changes inside the boundary.
Choosing the Right View for the Question
For general orientation, the county map should usually come first. It combines the boundary, Junction, smaller localities, roads, and a light stream network in one view. The city map is better when a clean settlement hierarchy is needed because it removes most place-name clutter and keeps Junction as the single ranked major city. The water map is the strongest choice for tracing the North Llano, South Llano, Llano, James, and Little Devils river systems. The elevation map is the one to use when the task is to compare uplands, valleys, and the county’s 447–750 meter range.
The maps also complement one another for printing and classroom work. A road-focused worksheet can use the county map without the extra color of the elevation surface. A lesson on river junctions can place the terrain-and-water map next to the city view so students can see why Junction is an appropriate geographic reference. For a terrain exercise, the elevation map can be compared directly with the water map to match green valley corridors with named rivers and creeks. The downloadable archive contains the four A3 JPG versions so a larger print can be used after reviewing the WebP previews on screen.
Frequently Asked Questions
What is the best starting point on a Kimble County map?
Start with Junction. It is the main city shown on the city map, Interstate 10 crosses the county through the Junction area, and the North Llano and South Llano rivers approach one another nearby. Once Junction is located, the smaller place names, roads, and river branches are much easier to place.
How can I tell the North Llano and South Llano rivers apart?
North Llano River approaches Junction from the west, while South Llano River comes from the southwest. After the channels meet near Junction, the Llano River continues toward the east. The terrain-and-water map is the clearest file for following that relationship.
What elevation range is shown for Kimble County?
The elevation map lists an actual range of about 447 to 750 meters and a mean of 621 meters. Higher terrain is concentrated mainly in the west and northwest, while lower green corridors follow Junction and the major river valleys.
Sources and Reference Data
- USGS The National Map Viewer – official map service for terrain, hydrography, roads, and other U.S. geographic layers
- U.S. Census Bureau TIGER/Line Shapefiles – official boundary and geographic line data
- USGS National Hydrography – official rivers, streams, and water-feature information
- USGS 3D Elevation Program – national elevation data and terrain resources
Map File Information
The download package contains high-resolution A3 JPG versions of the Kimble County county, city, terrain-and-water, and elevation maps.
- File Type: JPG
Related Maps
- Sutton County Texas map
- Real County Texas map
- Uvalde County Texas map
- Val Verde County Texas map
- Bandera County Texas map
Green Map creates custom-edited map images using open geographic data sources such as geoBoundaries, Natural Earth, OpenStreetMap, and government open data.
These maps are edited visual materials, not raw data files, and are provided for education, documents, presentations, and graphic reference.