Kerr County is easiest to understand by starting at Kerrville and then looking west toward Ingram, south and east toward the other labeled communities, and finally across the broad Hill Country terrain that fills the western half of the county. The map package on this page includes a general county map, a city map, a terrain-and-water map, and an elevation map. Together they show roads, settlements, the Guadalupe River system, small lakes and creeks, and a substantial change in height from the river valleys to the western uplands. The same four views are also available below as high-resolution A3 JPG files in one ZIP download.
The maps do not portray Kerr County as a flat rectangle with a single town in the middle. Kerrville sits in the eastern half, while Ingram lies to the west along the same general river corridor. The western part of the county is much more open on the settlement map and noticeably higher on the elevation map. The elevation legend reports an actual range of about 425 to 736 meters, with a mean of 614 meters. That difference of more than 300 meters helps explain why the shaded relief is so textured and why streams and roads often follow winding valleys instead of a simple grid.
Table of Contents
Kerrville is the clearest reference point, but it is not in the middle of the county
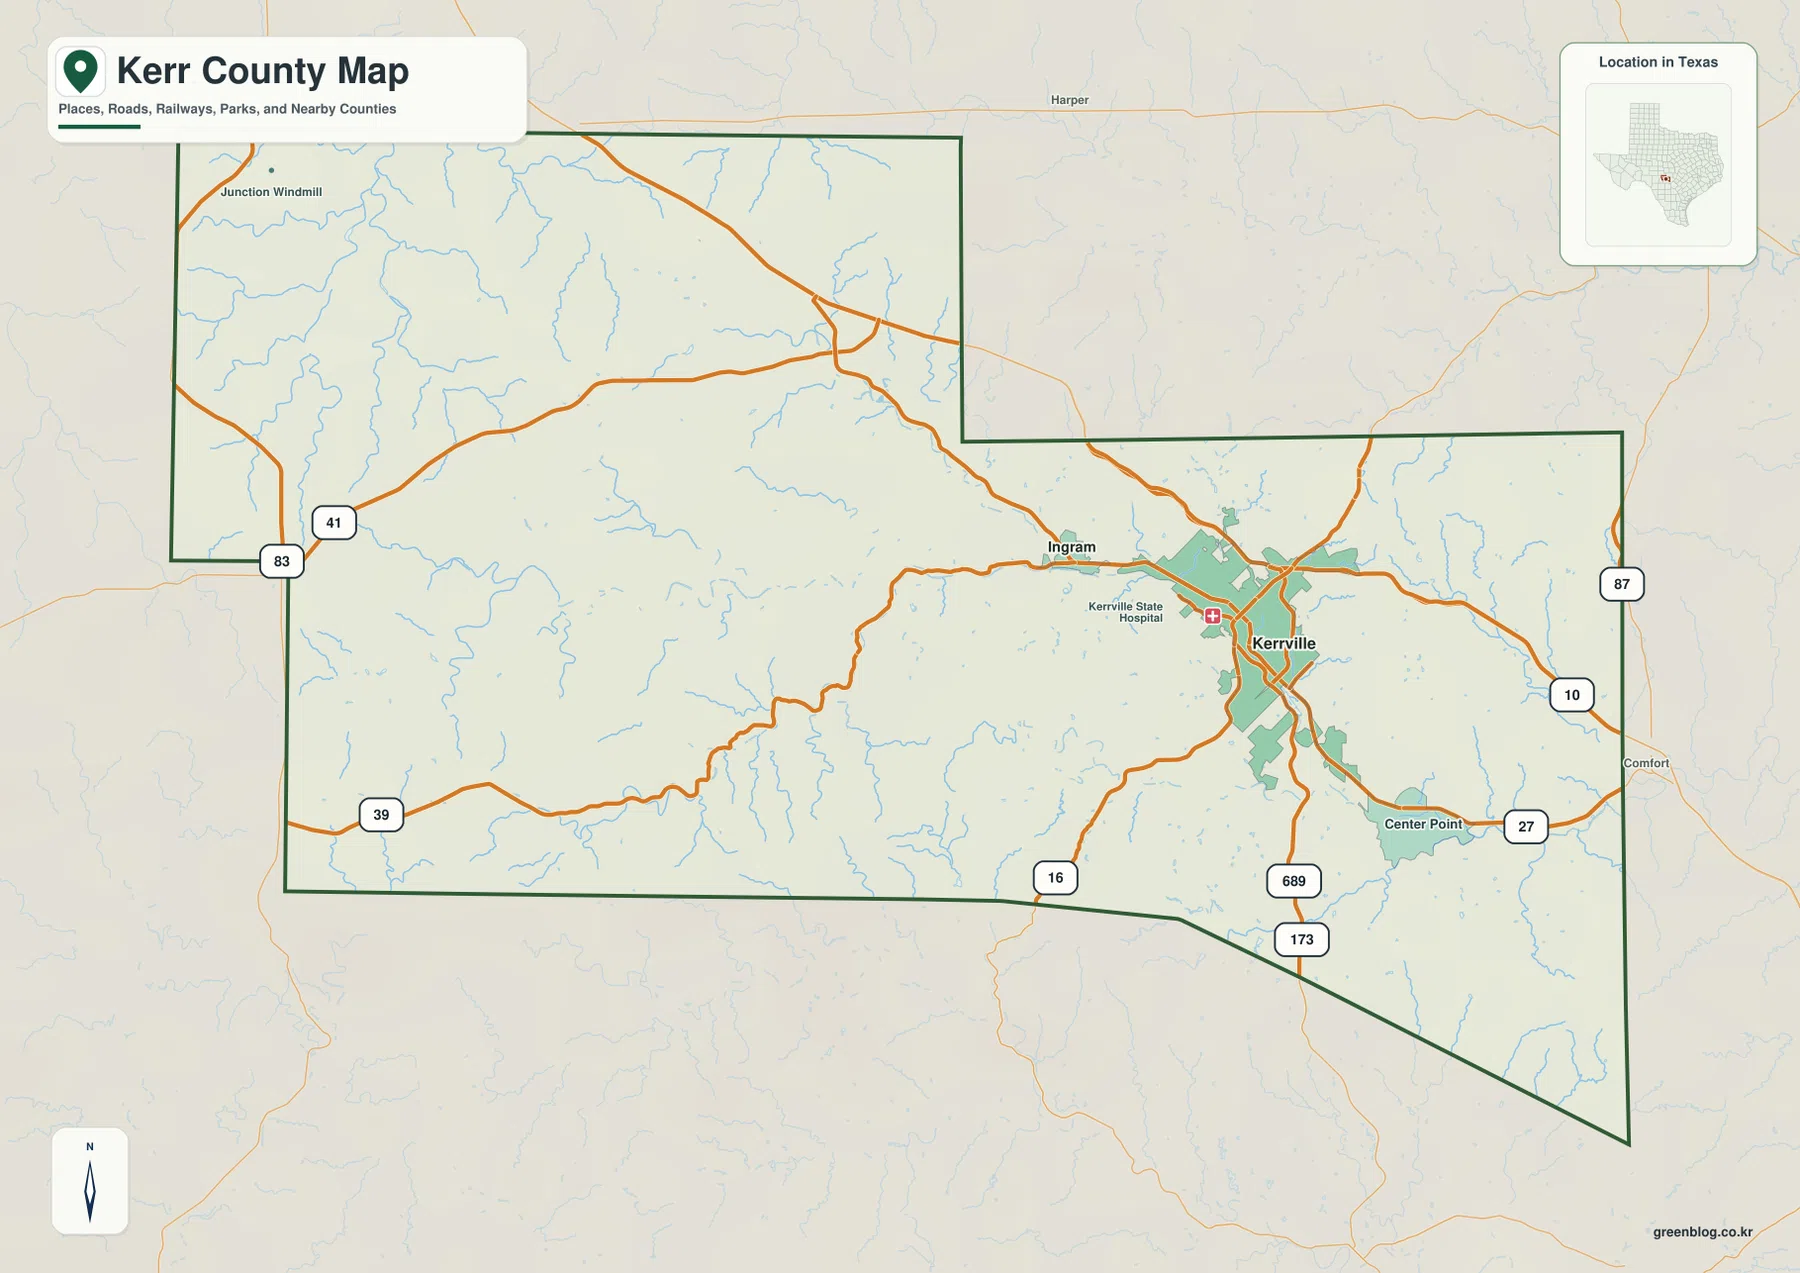
On the general county map, Kerrville is surrounded by the densest cluster of roads and the largest area of mapped development. Ingram appears to the west, while Center Point is labeled to the southeast. There is a much larger expanse of county land west of Kerrville than east of it, so treating Kerrville as the geometric center would give a misleading sense of distance. A useful first step is to locate Kerrville, follow the road toward Ingram, and then compare that relatively short settled corridor with the broad western portion of the county.
The map also labels places outside the county boundary, including Harper to the north and Comfort to the east. Those names are helpful as orientation points rather than as Kerr County communities. They show where roads continue after leaving the county and make the boundary easier to understand in regional context. Inside the boundary, the contrast is clear: the Kerrville area has a denser network of roads and mapped built-up land, while the western half contains fewer labeled settlements and longer stretches between major routes.
Major roads cross a landscape of ridges and valleys rather than a regular grid
Interstate 10 is the most recognizable route on the map, passing through the Kerrville area and continuing beyond the county. Other visible route numbers include 16, 27, 39, 41, 83, 87, 173, and 689. The numbers are less important than the directions they establish. One set of roads connects Kerrville with Ingram and the western part of the county, another moves south from the Kerrville area, and additional routes cross the wide western uplands. Looking at those corridors first makes the map easier to read than trying to memorize every road label.
The route pattern also makes more sense after comparing it with the terrain. Curving local roads often occupy valleys or avoid steeper ridges, while the largest through routes use the more practical corridors available across the Hill Country. In the western half, roads are spread farther apart and cross a landscape that the elevation map shows as generally higher. Near Kerrville, more routes converge within the lower Guadalupe River corridor. This relationship is visible in the supplied maps without needing a separate topographic interpretation.
The city map emphasizes the difference between Kerrville and Ingram
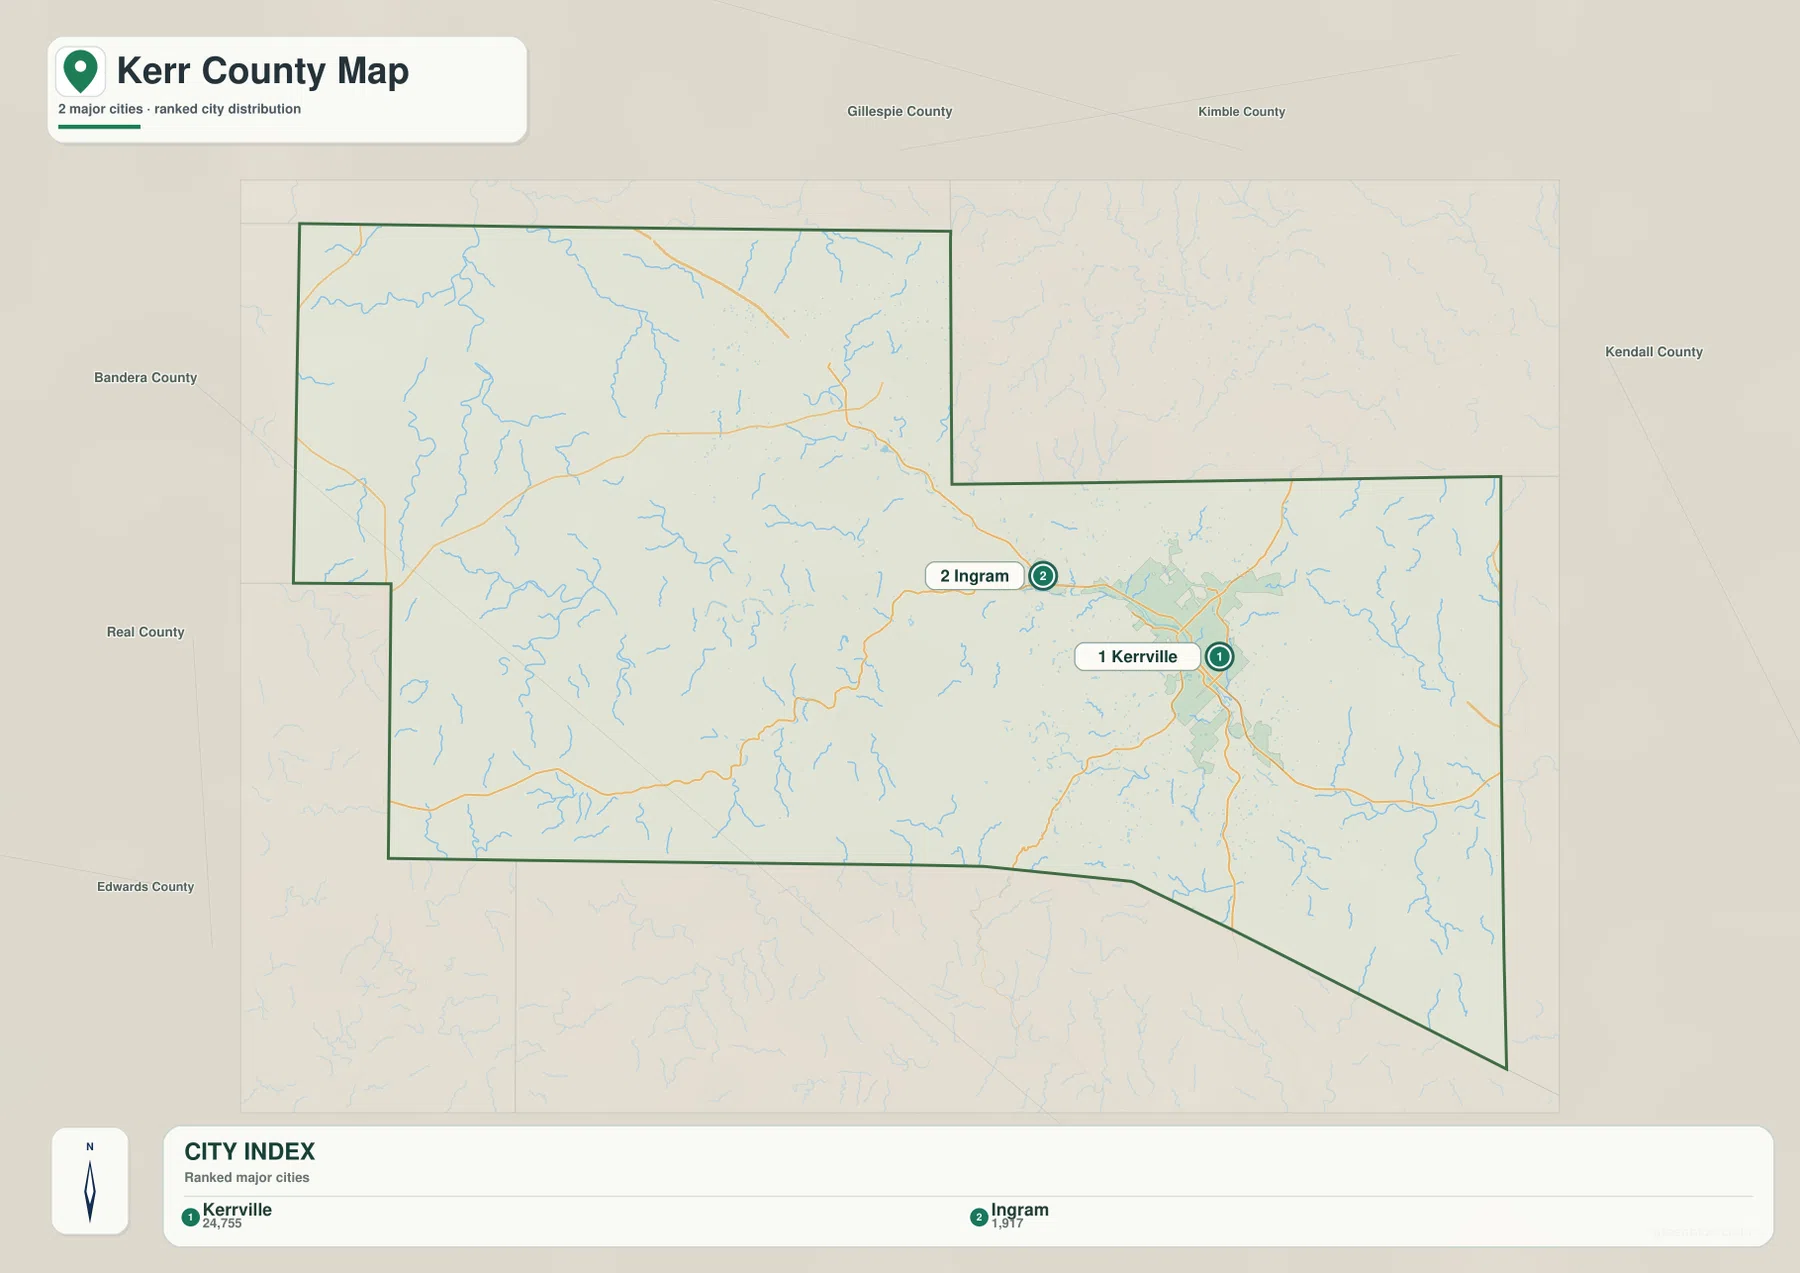
The city map is deliberately simple. It ranks only two major cities: Kerrville first and Ingram second. The index printed on the map shows values of 24,755 for Kerrville and 1,917 for Ingram. Rather than filling the page with every community name, this view makes the relative importance and position of the two places easy to see. Kerrville is located farther east, while Ingram sits to its west along the same general settled corridor.
County names around the outside of the map include Gillespie, Kimble, Kendall, Bandera, Real, and Edwards counties. These labels help place the two cities within the wider Hill Country area and also show that Kerr County has an irregular outline rather than a simple rectangle. Once Kerrville and Ingram are fixed in mind, it becomes easier to move to the water map and find New Lake Ingram, or to return to the general map and follow the roads that continue toward neighboring counties.
The Guadalupe River is a connected network of forks, creeks and small lakes
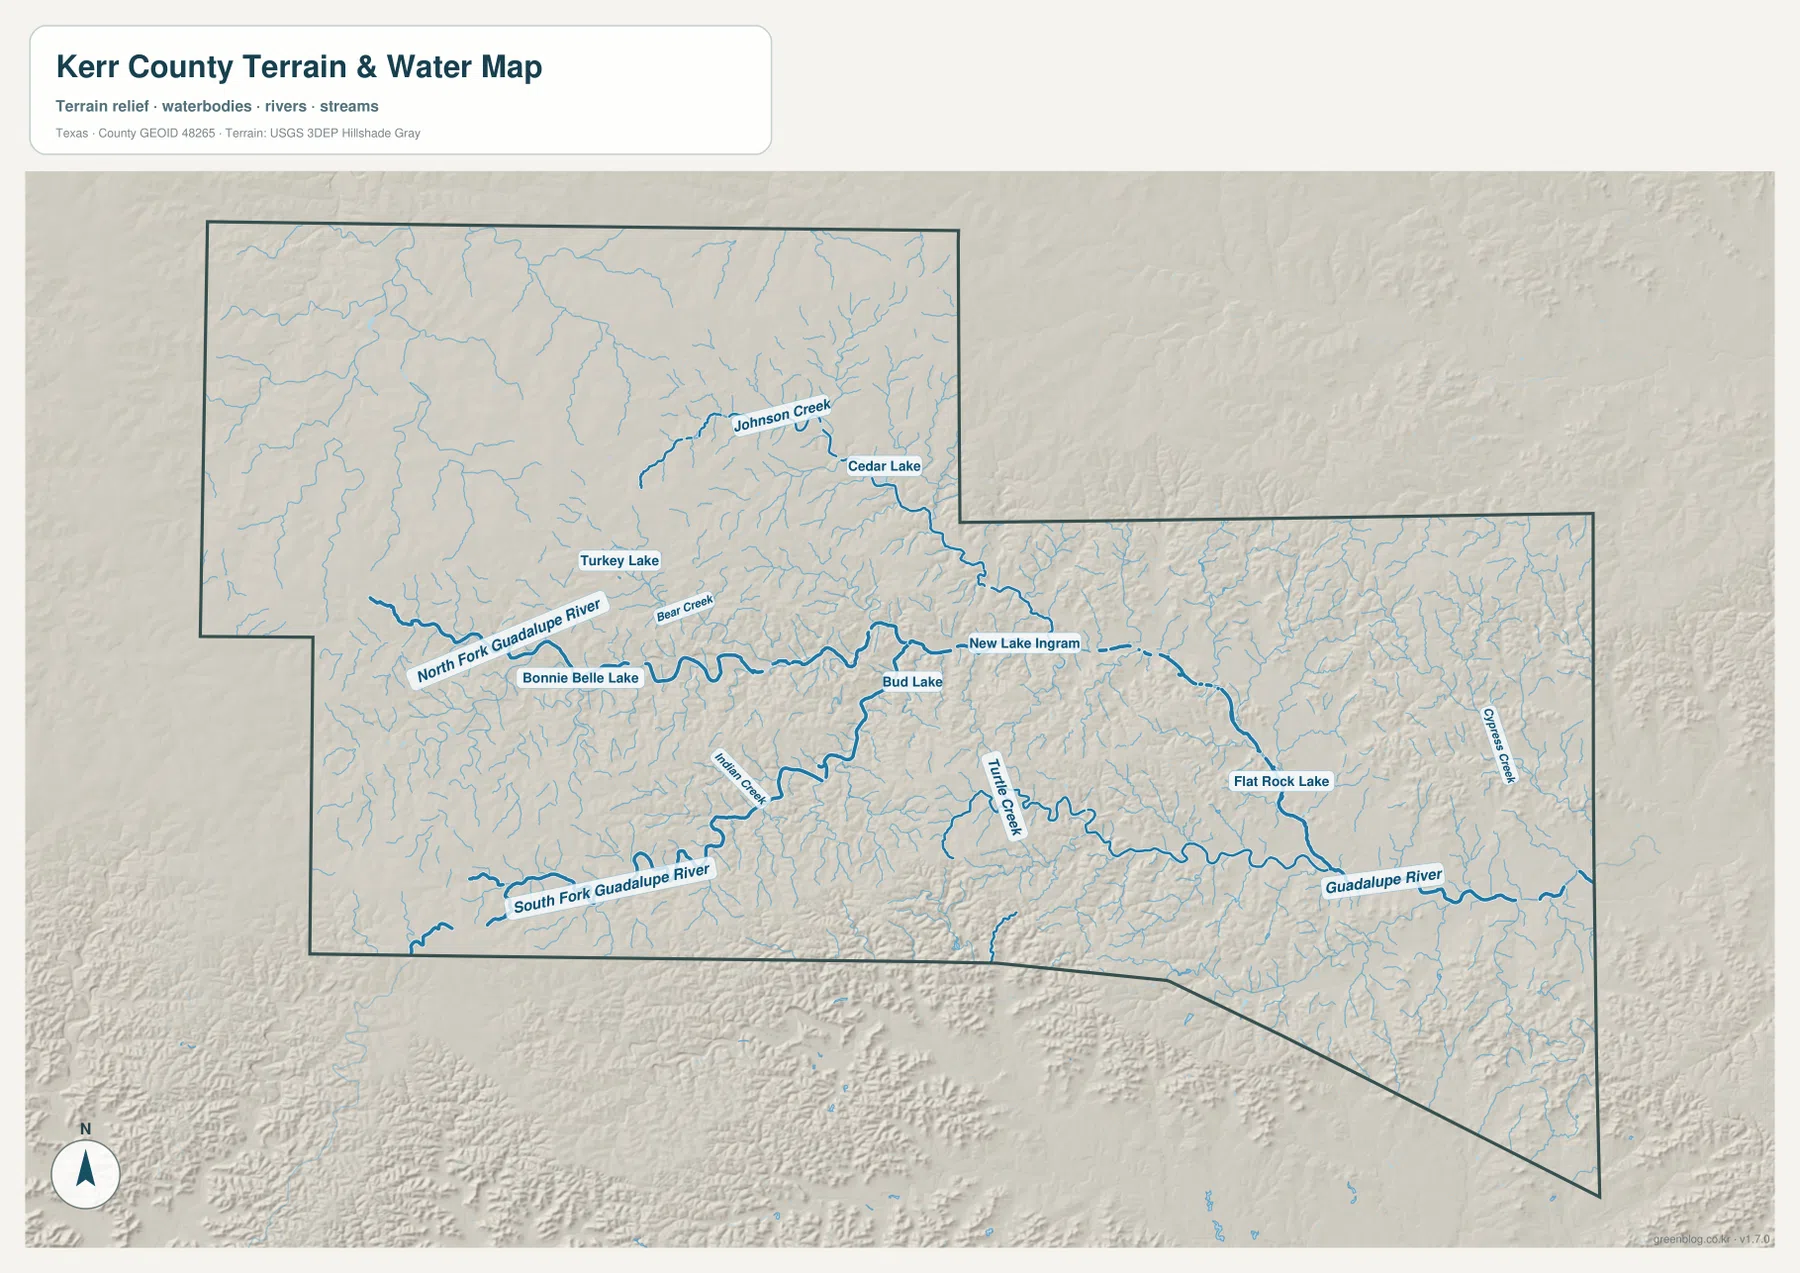
The terrain-and-water map contains much more detail than the general county map. The Guadalupe River is the main named river in the eastern part of the county, but the western side is divided between the North Fork Guadalupe River and the South Fork Guadalupe River. Those branches and their smaller tributaries occupy separate valleys before the drainage system continues eastward. New Lake Ingram is labeled near the Ingram area, and Flat Rock Lake appears farther east along the river corridor.
Several smaller names provide useful local references. Johnson Creek and Cedar Lake are shown in the northern part of the county. Turkey Lake and Bonnie Belle Lake appear farther west, while Bear Creek and Bud Lake are closer to the central river system. Turtle Creek is labeled south of the main corridor, and Cypress Creek appears in the eastern section. These features make the map useful when a simple county outline does not provide enough detail for identifying a particular drainage or water body.
A good way to read this map is to begin with the North Fork and South Fork, then follow the connected valleys eastward toward the Ingram and Kerrville corridor. The smaller creeks can be added afterward. This order keeps the map from becoming a list of water names and makes the relationship between the large branches and local tributaries easier to see. It also shows why the county’s hydrology and its settlement pattern are closely linked on the page: many of the most recognizable places and roads occupy the same lower valley system.
Elevation rises toward the west while the Guadalupe valleys remain visibly lower
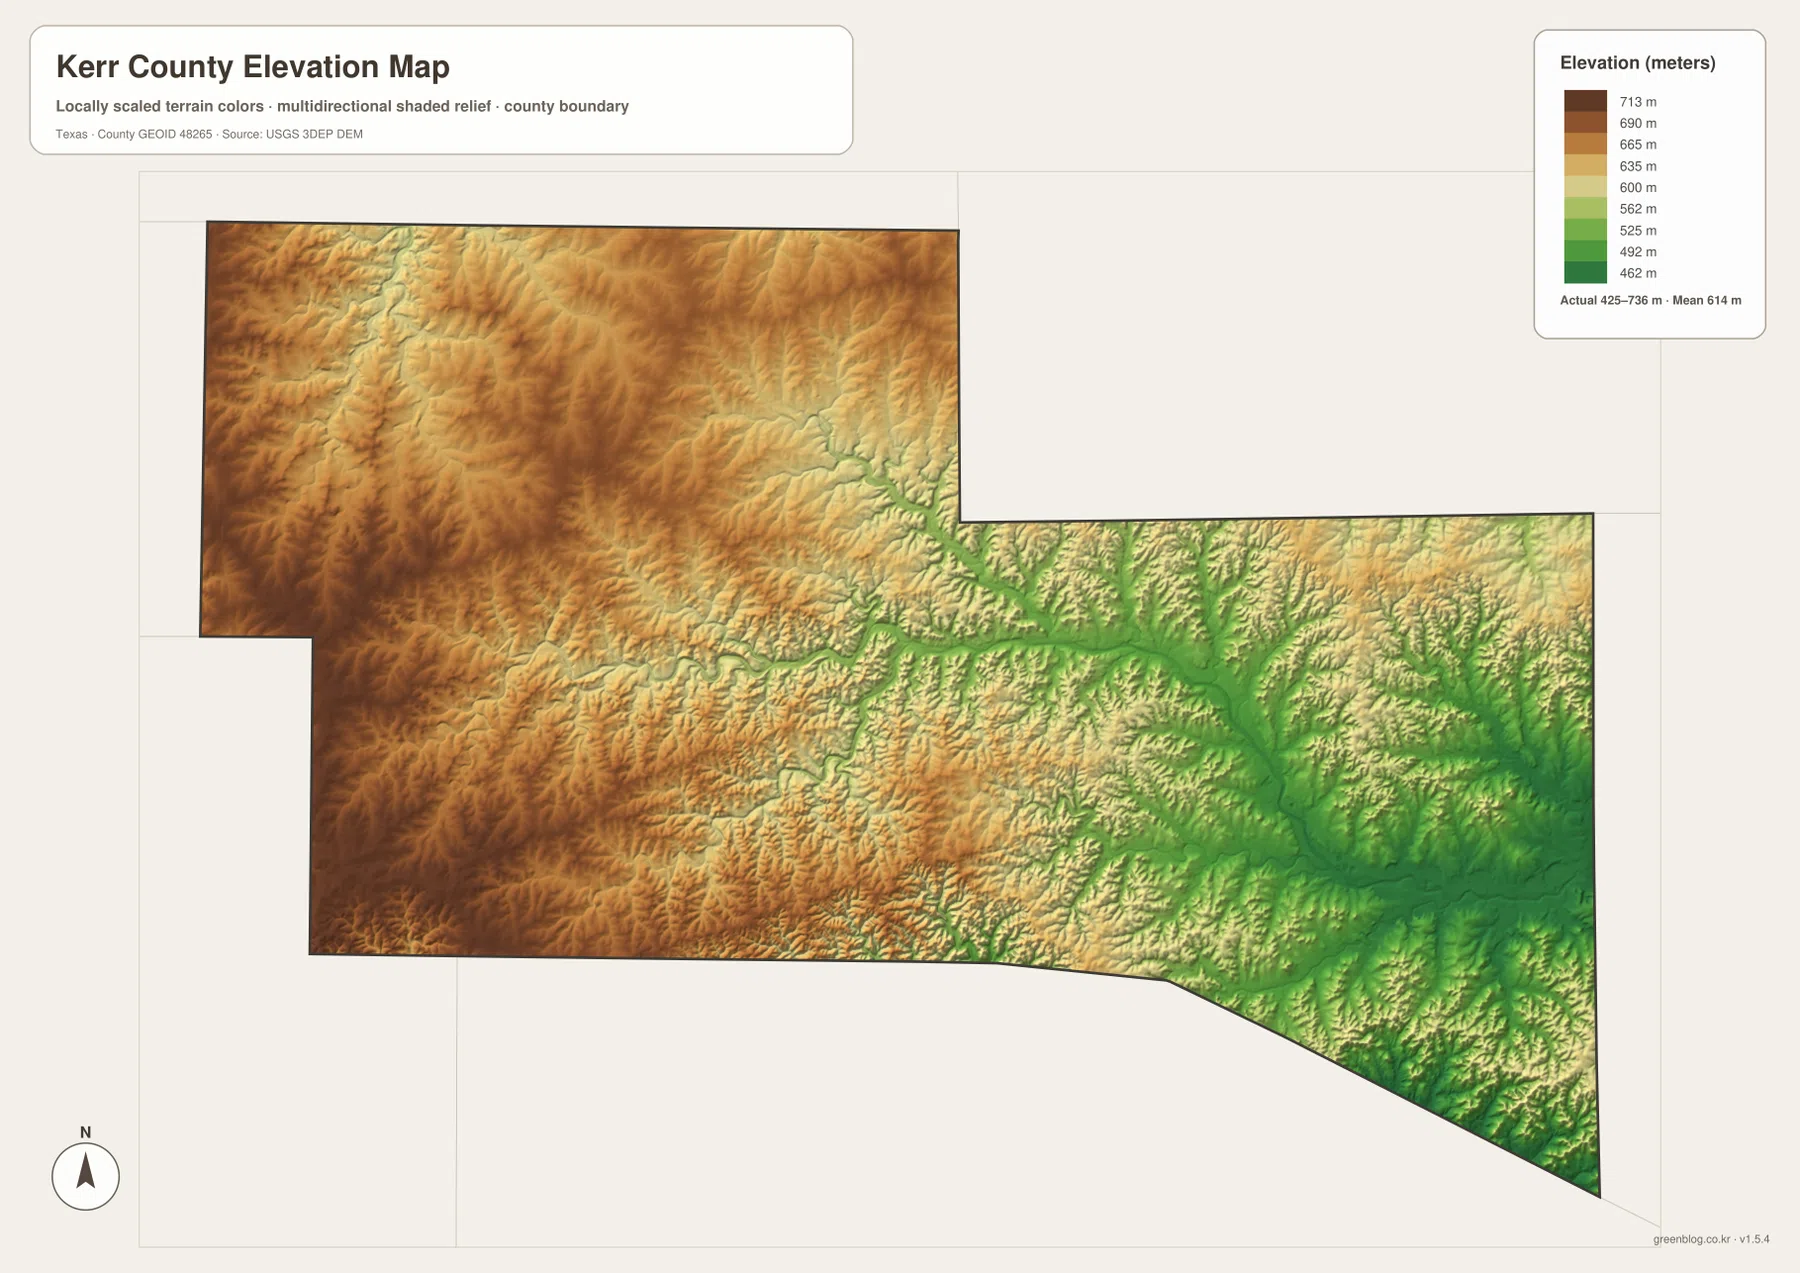
The elevation map reports an actual range of about 425 to 736 meters and a mean elevation of 614 meters. The western and northwestern parts of the county contain broad areas of brown and orange, which represent the higher terrain. The eastern half around Kerrville and the main Guadalupe River corridor contains more green, marking lower elevations. Between those broad zones are many narrow ridges and valleys, so the county does not change height as a smooth west-to-east slope.
The shaded relief is especially useful when compared with the water map. Major river branches and many smaller creeks follow lower channels cut between higher ridges. In the east, the lower Guadalupe corridor becomes broader and more continuous. Farther west, streams occupy narrower valleys surrounded by larger areas of elevated ground. The mean value of 614 meters by itself would hide these local contrasts, while the map makes them immediately visible.
The elevation colors should be read with the legend rather than as fixed statewide categories because this map is locally scaled to Kerr County. What matters here is the difference within the county: green areas are lower relative to the local range, and the warmer colors are higher. That local comparison makes the map useful for understanding why river valleys, road corridors, and settled areas often occupy different parts of the relief than the broad western uplands.
Choose the map by the question you are trying to answer
The general county map is the best starting point when the goal is to find Kerrville, Ingram, Center Point, Interstate 10, and the main numbered roads on one page. The city map is cleaner when the only question is where the two ranked urban centers lie within the county. The terrain-and-water map is the better choice for the North Fork and South Fork Guadalupe River, Johnson Creek, Turtle Creek, Cypress Creek, New Lake Ingram, Flat Rock Lake, and the other named water features. The elevation map is the clearest view for comparing the western uplands with the lower river corridor.
The four maps become more informative when the same location is traced from one view to another. Start with the Kerrville–Ingram corridor on the general map. On the water map, the same area aligns with the Guadalupe system and New Lake Ingram. On the elevation map, that corridor appears lower than much of the surrounding western terrain. Repeating this simple comparison for another road, creek, or lake helps connect transportation, water, and relief without forcing all of the information onto one crowded image.
The downloadable ZIP contains all four maps as high-resolution A3 JPG files, so they can be used separately for printing or placed side by side for a lesson or local reference project. For an assignment about roads and communities, the county map may be enough. A watershed or physical-geography project will benefit from the water and elevation maps together. These files are intended for geographic reference; current road conditions, closures, and navigation should still be checked with up-to-date travel information.
Frequently Asked Questions
What is the best place to locate first on a Kerr County map?
Start with Kerrville. It is the most prominent city on both the general and city maps and sits near the largest concentration of roads. From there, Ingram is easy to find to the west and Center Point can be located to the southeast on the general map.
How is the Guadalupe River shown in Kerr County?
The water map shows the Guadalupe River together with the North Fork Guadalupe River and South Fork Guadalupe River. It also labels smaller features such as Johnson Creek, Turtle Creek, Cypress Creek, New Lake Ingram, and Flat Rock Lake, giving a more detailed view of the drainage network.
What elevation range is shown for Kerr County?
The supplied elevation map reports an actual range of about 425 to 736 meters and a mean of 614 meters. Higher terrain is concentrated broadly in the west and northwest, while the Kerrville and Guadalupe River corridor appears lower.
Sources and Reference Data
For additional boundary and base-map information, see the U.S. Census Bureau TIGER/Line Shapefiles and USGS The National Map Viewer. Hydrography can be checked through USGS National Hydrography, while elevation data are available from the USGS 3D Elevation Program.
Map File Information
This ZIP contains high-resolution A3 JPG versions of the Kerr County, city, terrain-and-water, and elevation maps.
- File Type: JPG
Related Maps
- Bandera County Texas map
- Real County Texas map
- Sutton County Texas map
- Uvalde County Texas map
- Val Verde County Texas map
Green Map creates custom-edited map images using open geographic data sources such as geoBoundaries, Natural Earth, OpenStreetMap, and government open data.
These maps are edited visual materials, not raw data files, and are provided for education, documents, presentations, and graphic reference.