A West Virginia Map must accommodate one of the most irregular state silhouettes in the eastern United States. The Northern Panhandle rises between Ohio and Pennsylvania, while the Eastern Panhandle reaches between Maryland and Virginia. Between those extensions, 55 county shapes form a compact but visually intricate Appalachian framework.
This collection presents that framework in three forms: a pastel color map with county names, a labeled black-and-white edition, and an unlabeled county outline. The downloadable JPG files use an A3 layout, giving narrow panhandle counties and compact central labels more room than they would receive on a small page. No roads, city markers, terrain shading, or river layers are included.
The West Virginia Map set can support county reference, classroom exercises, slide presentations, regional annotation, and custom graphics. Its value comes from keeping the geometry consistent across all three versions. A reader can study names on one image, switch to the outline for an activity, and still work with the same county arrangement.
Table of Contents
West Virginia Map Overview
West Virginia borders Pennsylvania and Maryland to the north and east, Virginia to the east and south, Kentucky to the southwest, and Ohio to the northwest. Those surrounding states are not drawn on the supplied images, but they help explain the unusual outline. The Northern Panhandle contains Hancock, Brooke, Ohio, and Marshall counties in a narrow vertical chain, while the Eastern Panhandle extends through counties such as Morgan, Berkeley, and Jefferson.
The maps show the state’s 55 counties rather than its cities or smaller county subdivisions. Charleston can be oriented through Kanawha County, Huntington through Cabell County, Morgantown through Monongalia County, Parkersburg through Wood County, and Wheeling through Ohio County. These associations are helpful for readers, but the images themselves remain county maps and do not place separate city symbols.
The county pattern changes across the page. Long, narrow shapes appear in both panhandles; irregular central boundaries cluster around Harrison, Lewis, Upshur, and neighboring counties; and the southern group forms a broad arc through counties including Mingo, McDowell, Mercer, Monroe, Raleigh, and Wyoming. Preserving those contrasts is more informative than reducing West Virginia to an outer border.
Color County Map for Regional Comparison
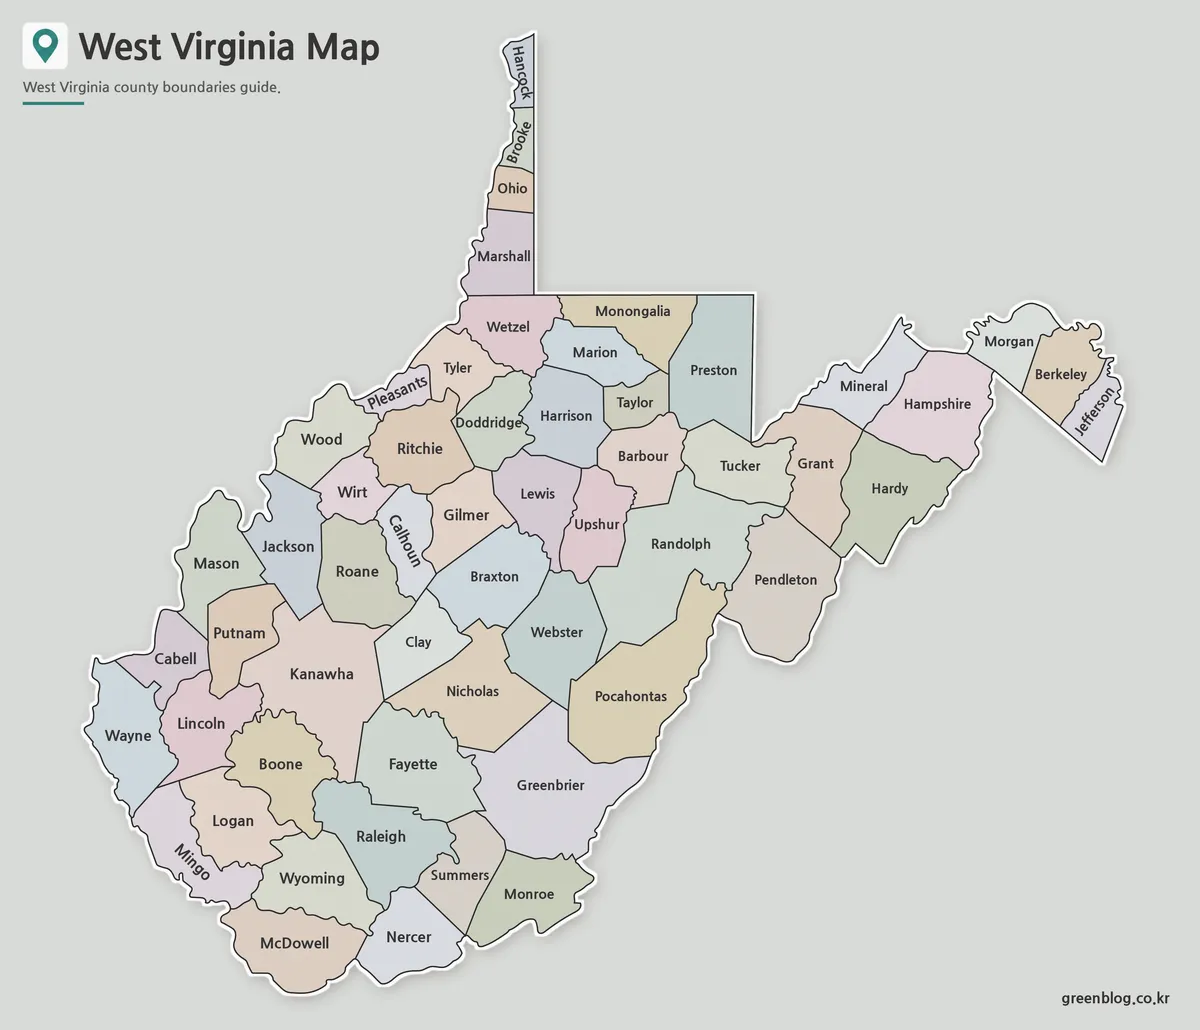
The color edition assigns soft contrasting fills to adjacent counties while retaining names and dark boundary lines. That separation is especially helpful where many irregular shapes meet in the center and west of the state. It also keeps the tiny Pleasants County area and the narrow northern chain from blending into neighboring counties.
Choose this West Virginia Map for projected slides, introductory geography lessons, or a county comparison in which readers need to follow one shape at a glance. A presenter could point out the two panhandles, compare the Ohio River side with the eastern counties, or group counties into a project-specific region. The existing pastel colors are categorical only; they do not represent elevation, population, politics, mining, or any other data.
The broad gray background isolates the silhouette and gives both extensions breathing room. Because every county name is placed inside or immediately along its shape, the image functions best as a visual reference rather than a detailed statistical map. Any data overlay should use a new legend that clearly explains the meaning of added colors or symbols.
Black and White Printable Version
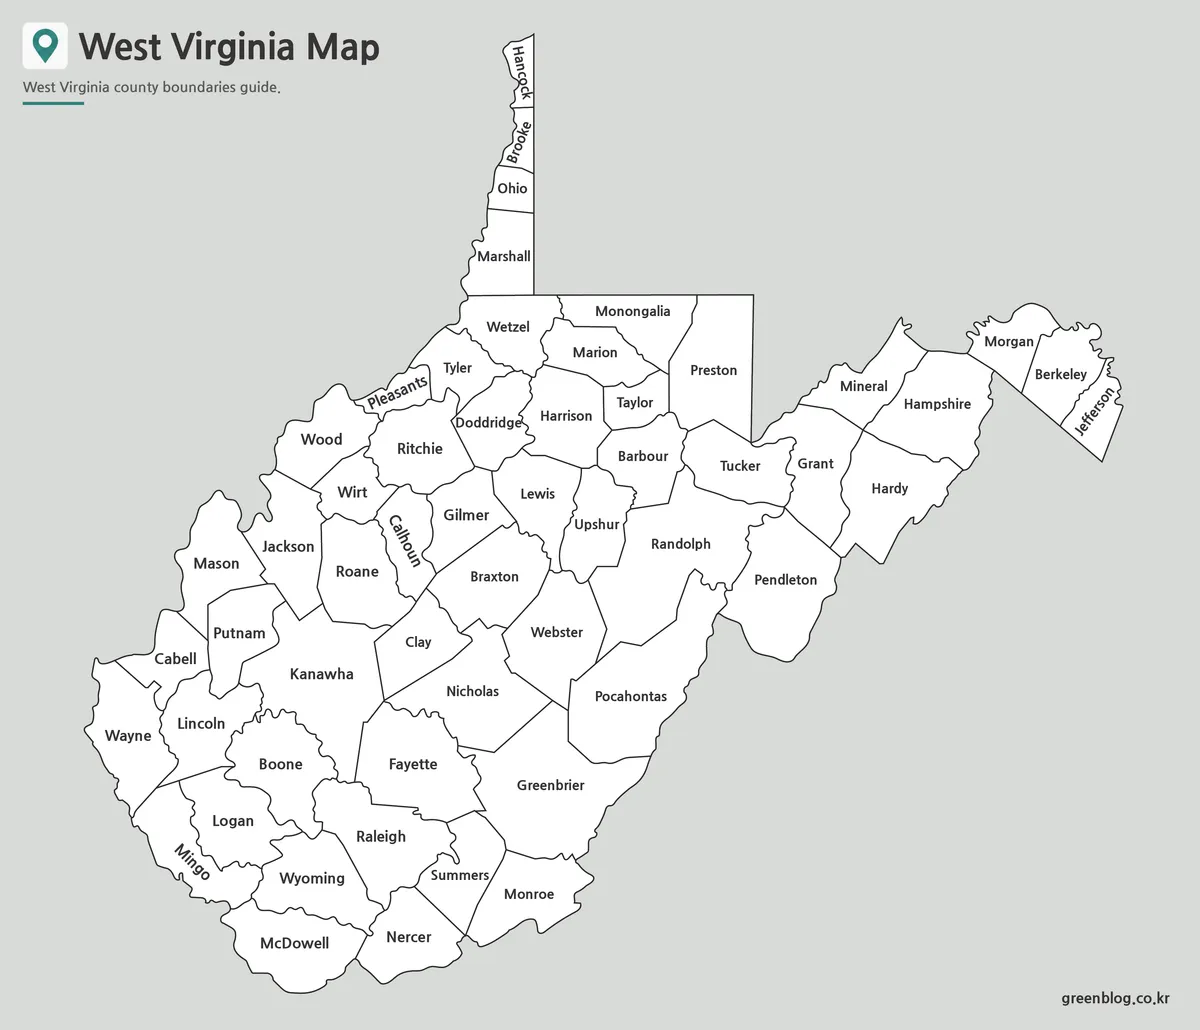
The labeled monochrome edition preserves the names and county geometry while removing the pastel fills. It fits documents that already use a limited color palette and gives teachers a straightforward reference sheet for county-location work. Boundary lines carry all of the separation, so readers do not need color to distinguish neighboring areas.
This West Virginia Map is the most direct choice for reports, study packets, and worksheets in which the names must remain available. It can sit beside a county table, support a lesson about regional placement, or provide a reference while students complete a separate blank map. It should not be described as a city map, because capitals and urban centers are not independently marked.
When reducing the A3 layout to letter-size paper, use a proportional fit option and review the smallest names before printing a full set. Cropping is particularly risky here: it can remove the top of Hancock County or the eastern end near Jefferson County. The complete silhouette needs space on both the vertical and horizontal axes.
Blank Outline Map for Editing
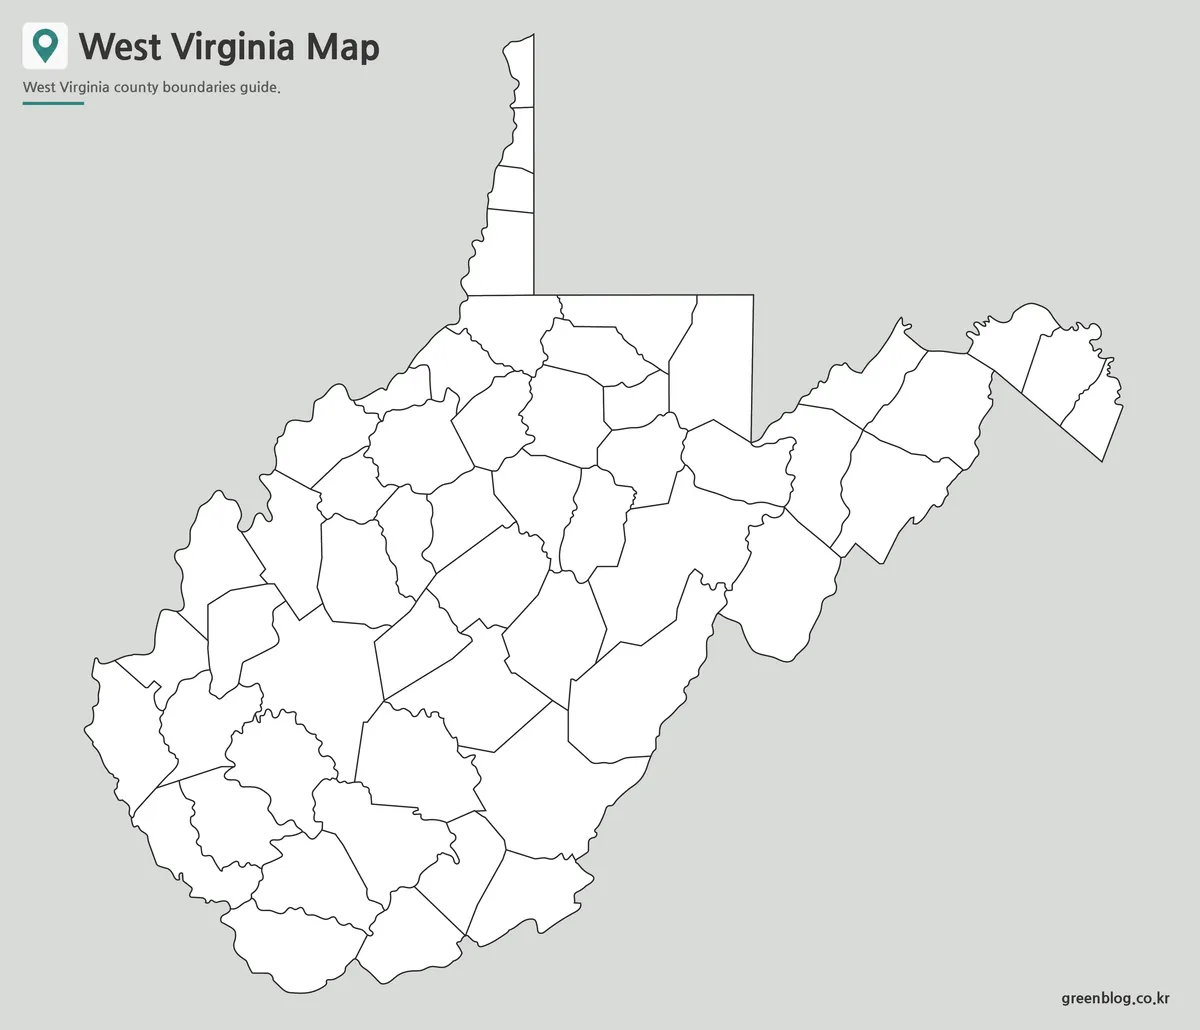
The outline image keeps all county borders but removes every county name and color. That open structure turns the map from a reference into a working base. Students can label selected counties, identify both panhandles, or color a teacher-defined region; designers can add numbers, icons, categories, or a custom legend without competing with existing labels.
Location-specific activities might ask learners to identify Kanawha County near the center, trace the northern chain from Marshall to Hancock, or find Berkeley and Jefferson at the far eastern end. A project could also mark the counties associated with particular cities or compare a chosen group of Appalachian counties. Since no rivers or roads are drawn, any such layer must be added and sourced separately.
The supplied download is a JPG image, not a confirmed SVG or editable vector source. “Editing” therefore means adding content in an image editor, slide program, or document application. Keep a clean copy before applying fills, and avoid enlarging far beyond the intended A3 layout if crisp boundary lines are important.
Why West Virginia Needs a Clear County Map
A simple rectangular grid cannot explain West Virginia’s county relationships. The state lies within the Appalachian region, and its border follows a complex historical and geographic form. Curving edges, projecting panhandles, and uneven county shapes create a layout that readers must follow in several directions rather than scan as neat rows.
A clear West Virginia Map makes those relationships visible without turning the page into a physical or transportation atlas. The Northern Panhandle is visually separate from much of the main body, and the Eastern Panhandle extends far beyond the central mass. Counties along the western side also form an irregular edge facing Ohio and Kentucky, while the southeastern boundary bends against Virginia.
These shapes matter in practical tasks. A reader comparing counties, assigning classroom groups, planning a regional infographic, or locating a county mentioned in a report needs both the outer silhouette and the internal divisions. The three-image sequence provides that structure at different levels of visual guidance.
Built for Printing, Slides, and Visual Projects
Select the version according to what the reader must do. Use color when counties must separate quickly on screen, use the monochrome labeled edition when names are needed in a restrained document, and use the outline when the audience will add information. The versions are complementary rather than interchangeable.
- Reference: choose either labeled edition to locate one of the 55 counties.
- Classroom practice: pair the labeled map with the outline for recall and checking.
- Presentation: use the color file when the panhandles and adjoining counties need quick visual separation.
- Custom graphic: add data and a new legend to a copy of the blank outline.
For time-sensitive overlays such as population, elections, services, or economic indicators, record the source and reference year separately. The base West Virginia Map supplies county geometry; it does not establish the meaning or currency of information added later. That distinction keeps the final project clear and properly documented.
FAQ
Which West Virginia Map fits a county-labeling activity?
Use the blank outline when participants are expected to recall or add county names. Keep the black-and-white labeled edition nearby when the activity allows a reference. The color map is better for introducing the 55-county pattern before students begin labeling.
What is included in this West Virginia Map collection?
The collection includes a color county map, a black and white labeled map, and a blank outline map.
Can I print the maps?
Yes. The maps are designed for A3 high-resolution printing.
Is the outline map editable?
Yes. The outline version is suitable for adding colors, labels, icons, and custom data.
What is the best version for classroom use?
The black and white map is best for handouts, while the outline map works well for worksheets.
Does the West Virginia Map include county boundaries?
Yes. The map collection is based on county boundaries.
Map File Information
The archive provides three West Virginia county images for labeled reference, monochrome printing, and blank annotation.
- Included Versions: Color labeled · black-and-white labeled · blank outline
- Printable Size: A3 high resolution
- File Type: JPG
- Intended Use: County reference · classroom activities · presentations · annotation
Related Maps
Additional Resources
- U.S. Census Bureau: West Virginia Geographic Guide: Review the state’s official county count and the distinction between counties and smaller county subdivisions.
Green Map creates custom-edited map images using open geographic data sources such as geoBoundaries, Natural Earth, OpenStreetMap, and government open data.
These maps are edited visual materials, not raw data files, and are provided for education, documents, presentations, and graphic reference.