UNHCR Refugee Statistics records 28,461,306 refugees across 177 country-or-territory-of-asylum rows at the end of 2025. That sum exactly matches the Global Trends 2025 total for refugees under UNHCR’s mandate. The geography here is the place of asylum, not the refugee’s country of origin. In other words, this comparison answers where refugees were being hosted at year end, not where those refugees had fled from.
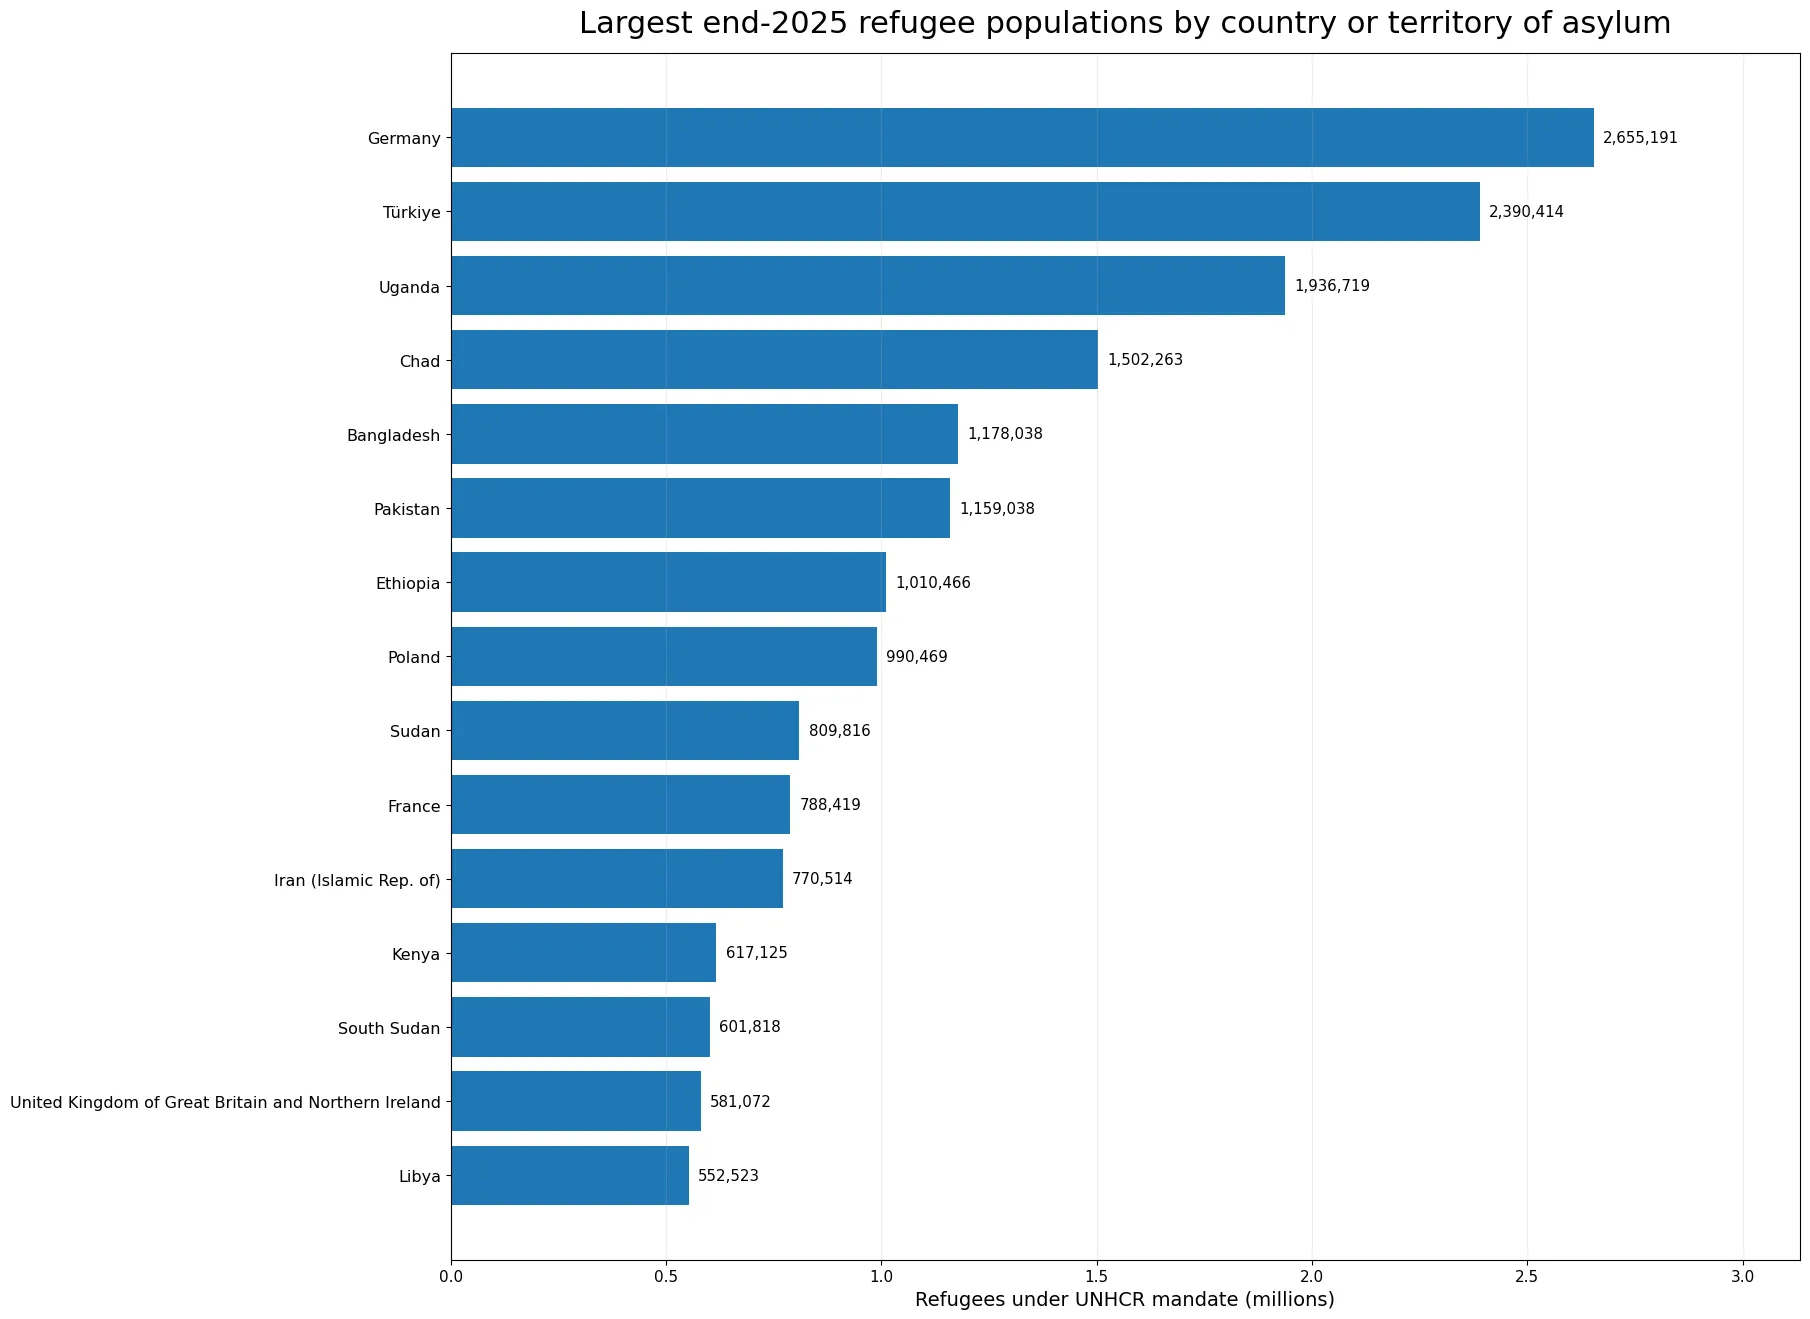
Germany has the largest row at 2,655,191, followed by Türkiye with 2,390,414, Uganda with 1,936,719, Chad with 1,502,263, and Bangladesh with 1,178,038. Those five rows contain about 34.0% of the 28.46 million total. The top ten account for 50.7% and the top fifteen for 61.6%. These are absolute host-country totals, not a ranking of policy quality, generosity, capacity, or burden relative to population size.
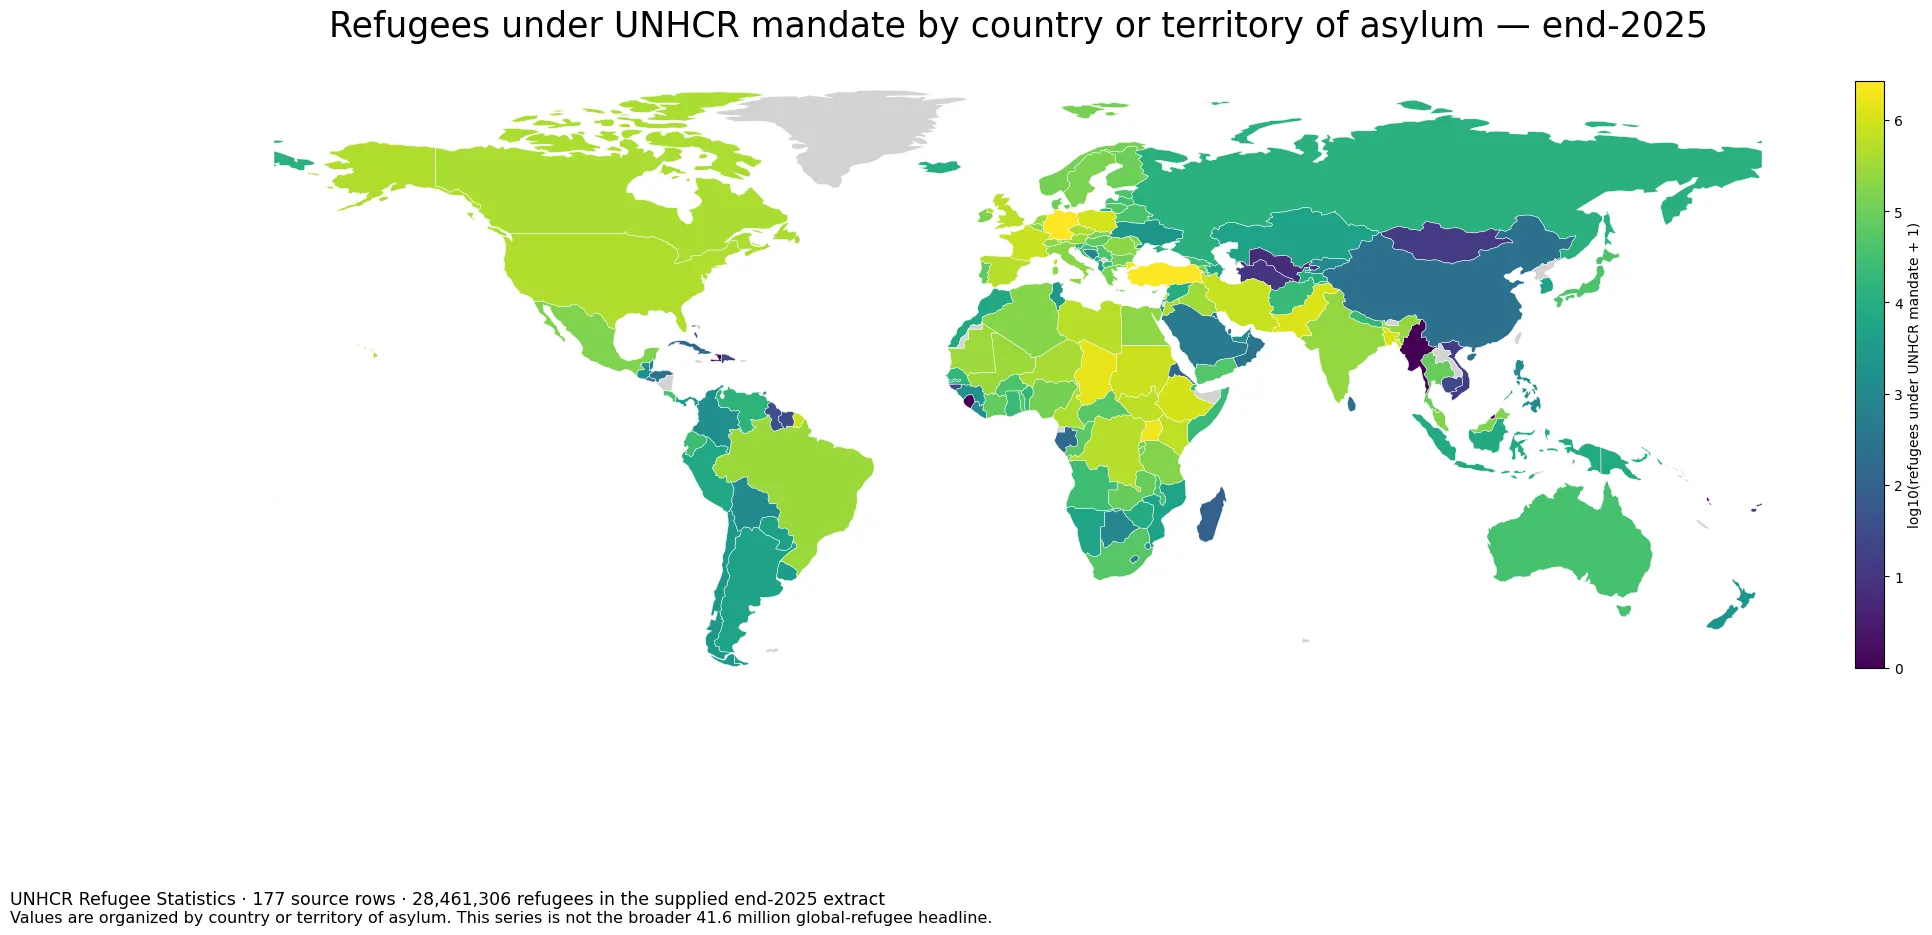
Table of Contents
What the refugee field includes
UNHCR’s statistical definitions place recognized refugees and people in refugee-like situations within the refugee population used for its global statistics. The broader protection system also contains asylum-seekers, internally displaced people, stateless people, and other people in need of international protection, but these are separate statistical categories. That distinction matters because each category answers a different question and follows different legal or operational criteria.
The Refugee Data Finder methodology therefore separates the refugee series from pending asylum claims and from internal displacement. An asylum-seeker has requested international protection but has not yet received a final status determination. An internally displaced person has not crossed an internationally recognized state border. The figures in this article are the refugee series only. They should not be expanded into a count of every forcibly displaced or protection-seeking person present in a host country.
Large host populations are spread across Europe, Africa and Asia
Germany leads the 2025 host-country series with 2,655,191 refugees, while Türkiye records 2,390,414. Uganda, Chad and Bangladesh complete the top five. Pakistan, Ethiopia, Poland, Sudan and France are also in the top ten. The list therefore combines wealthy destination countries with countries neighboring major displacement crises. Geography, established refugee communities, regional protection arrangements and long-running conflicts all contribute to the size of a host-country stock.
The top five rows sum to 9,662,625 people. The top ten reach 14,420,833, or about 50.7% of all rows, and the top fifteen reach 17,543,885, about 61.6%. The arithmetic mean across all 177 rows is roughly 160,798, but the median is only 12,269. A small group of countries hosting hundreds of thousands or millions of refugees pulls the mean far above the middle observation.
Why 28.46 million is smaller than the 41.6 million global refugee headline
UNHCR’s Figures at a glance reports about 41.6 million refugees globally at the end of December 2025, while the sum of the country rows here is 28,461,306. The two figures describe different statistical scopes. The broader global headline combines refugees under UNHCR’s mandate with Palestine refugees under UNRWA’s mandate and other people in need of international protection. This dataset contains the UNHCR-mandate refugee field rather than that broader combination.
The Global Trends 2025 data table makes the categories visible: 28,461,306 refugees under UNHCR’s mandate, 5,964,782 Palestine refugees under UNRWA’s mandate, and 7,177,473 other people in need of international protection. Because those populations are presented as separate series, a country comparison must stay within one consistent definition. This article does exactly that: every map color, table row and summary statistic is calculated from the 28,461,306-person UNHCR refugee series.
Country of asylum and country of origin answer different questions
Refugee statistics commonly have two geographic dimensions. Country of asylum identifies where a refugee is hosted. Country of origin identifies the country or territory from which the refugee came. This extract uses the first dimension. A large value for Germany therefore means that many refugees were hosted in Germany at the end of 2025; it does not mean that Germany was a leading source country of refugees.
The distinction changes how the map should be interpreted. Host-country data is useful for understanding the geographic distribution of protection responsibilities and the potential scale of housing, education, health and integration needs. Origin-country data is better suited to tracing displacement pressures associated with conflict, persecution and instability. Combining the two dimensions can reveal routes and relationships, but the host-country totals alone do not identify individual routes, legal histories or reasons for flight.
What the ten zero rows do and do not mean
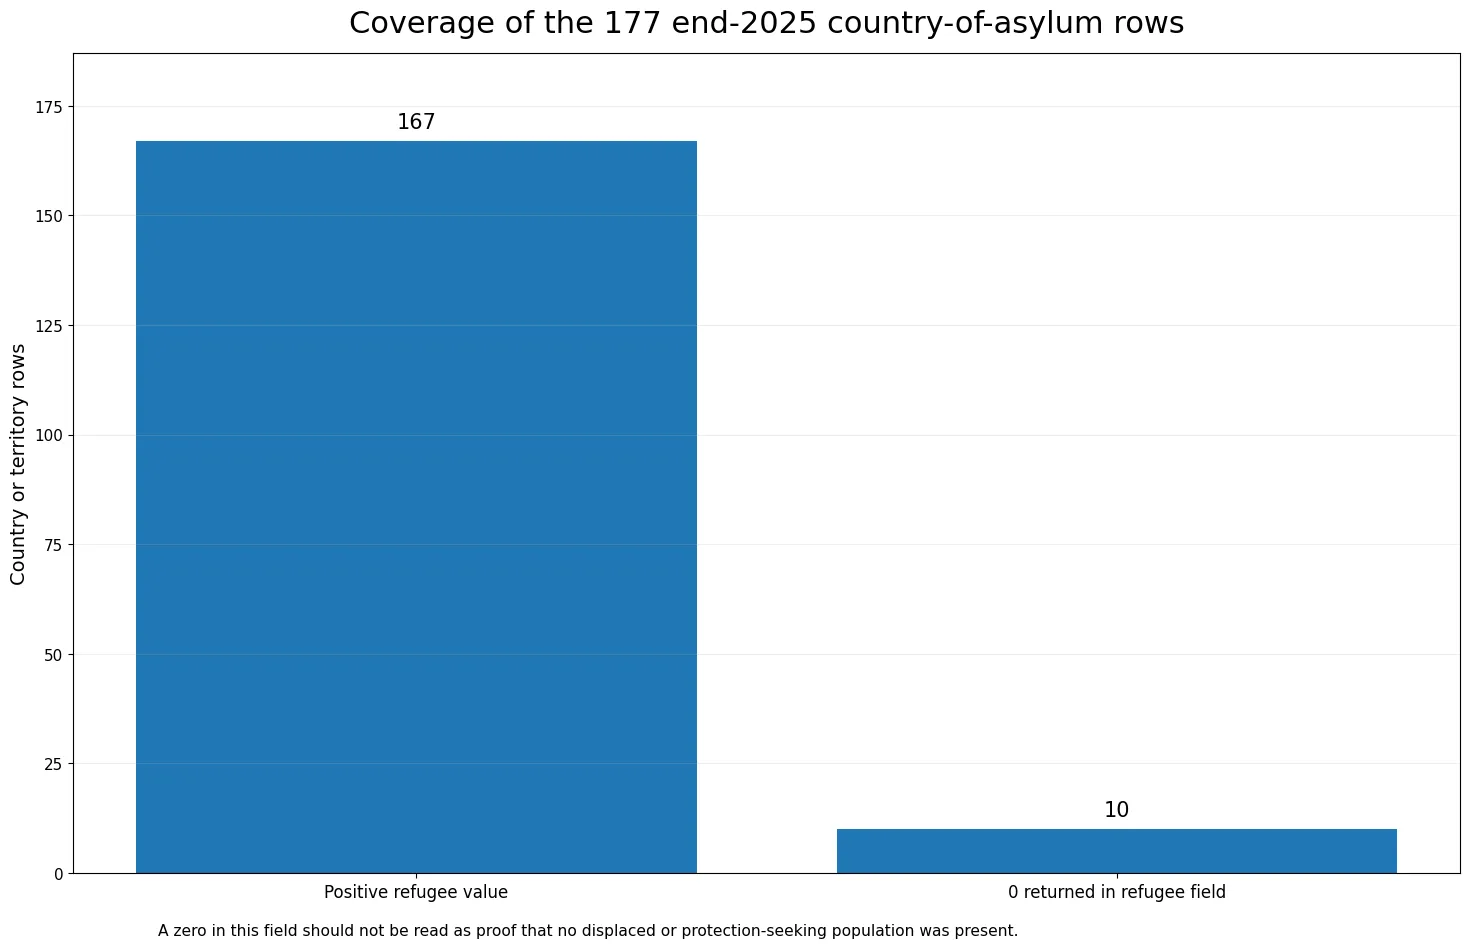
Among the 177 rows, 167 contain a positive refugee value and 10 return zero. Those zeros come from the source field; they were not created by replacing missing observations during analysis. Even so, a zero in this refugee series should not be treated as proof that no person needing international protection was present. A country may have asylum-seekers, people in another protection category, stateless people, or other populations that are counted separately from the refugee field.
The map also avoids converting unmapped geography into zero. Low-resolution world boundaries do not contain a clean polygon for every small state or territory in the 177-row source. Those rows remain in the complete table even when the map cannot display them as a separate polygon. The table is therefore the authoritative coverage list for the source extract, while the map is a visual summary of the spatial pattern.
The host-country distribution has a long right tail
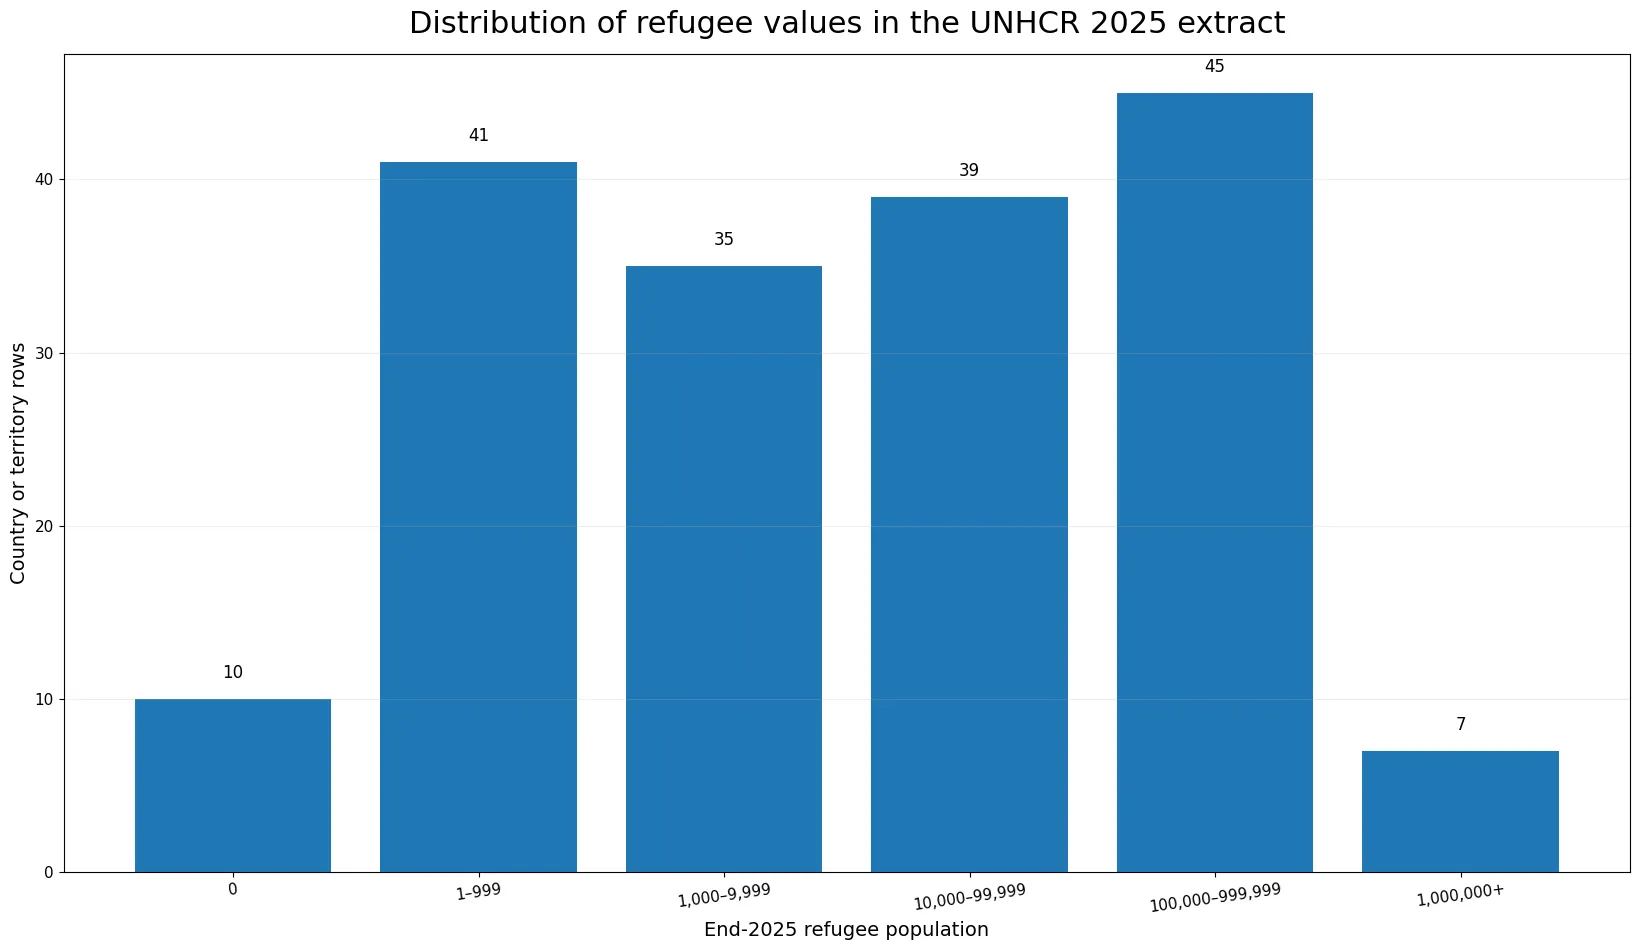
The 177 rows are spread across a very wide range. Ten rows are zero, 41 are between 1 and 999, 35 are between 1,000 and 9,999, 39 are between 10,000 and 99,999, 45 are between 100,000 and 999,999, and seven reach one million or more. Looking only at the 167 positive rows, the median is 19,613 and the mean is about 170,427. That gap is a sign of strong right-skew: a small number of very large host populations sit above a broad middle and lower range.
For that reason, the featured map colors the data using log10(value + 1). This does not alter the underlying counts. It only compresses visual distance so that countries hosting thousands of refugees remain distinguishable on the same map as countries hosting more than one million. Exact comparisons should always return to the table because color bins and map projection are visual aids rather than substitutes for the source values.
All 177 host-country and territory values for 2025
The table below keeps all 177 source rows and orders them from the largest refugee population to the smallest. Every observation is for end-2025, so there is no mixed-year comparison in this dataset. Absolute totals are useful for understanding scale, but they do not measure burden relative to host population, national income, fiscal capacity or territory. Per-capita indicators, duration of displacement, camp versus urban residence, new arrivals, returns and other protection categories can all change the interpretation of the same host-country total.
| Country or territory of asylum | Year | Refugees under UNHCR mandate |
|---|---|---|
| Germany | 2025 | 2,655,191 |
| Türkiye | 2025 | 2,390,414 |
| Uganda | 2025 | 1,936,719 |
| Chad | 2025 | 1,502,263 |
| Bangladesh | 2025 | 1,178,038 |
| Pakistan | 2025 | 1,159,038 |
| Ethiopia | 2025 | 1,010,466 |
| Poland | 2025 | 990,469 |
| Sudan | 2025 | 809,816 |
| France | 2025 | 788,419 |
| Iran (Islamic Rep. of) | 2025 | 770,514 |
| Kenya | 2025 | 617,125 |
| South Sudan | 2025 | 601,818 |
| United Kingdom of Great Britain and Northern Ireland | 2025 | 581,072 |
| Libya | 2025 | 552,523 |
| Lebanon | 2025 | 535,168 |
| Spain | 2025 | 511,079 |
| Dem. Rep. of the Congo | 2025 | 503,732 |
| United States of America | 2025 | 457,647 |
| Jordan | 2025 | 436,226 |
| Canada | 2025 | 416,028 |
| Cameroon | 2025 | 408,613 |
| Czechia | 2025 | 395,559 |
| Niger | 2025 | 385,986 |
| Iraq | 2025 | 322,345 |
| Mauritania | 2025 | 301,490 |
| Mali | 2025 | 286,715 |
| Austria | 2025 | 286,651 |
| Netherlands (Kingdom of the) | 2025 | 283,935 |
| Brazil | 2025 | 278,966 |
| India | 2025 | 238,643 |
| Egypt | 2025 | 220,033 |
| Switzerland | 2025 | 208,287 |
| Romania | 2025 | 206,671 |
| Italy | 2025 | 192,914 |
| Belgium | 2025 | 186,393 |
| Algeria | 2025 | 180,575 |
| United Rep. of Tanzania | 2025 | 171,142 |
| Mexico | 2025 | 152,002 |
| Malaysia | 2025 | 150,164 |
| Rep. of Moldova | 2025 | 149,324 |
| Sweden | 2025 | 144,116 |
| Slovakia | 2025 | 140,885 |
| Ireland | 2025 | 137,869 |
| Greece | 2025 | 134,563 |
| Norway | 2025 | 124,006 |
| Nigeria | 2025 | 123,848 |
| Armenia | 2025 | 123,087 |
| Rwanda | 2025 | 115,794 |
| Burundi | 2025 | 110,800 |
| Bulgaria | 2025 | 105,596 |
| Finland | 2025 | 102,544 |
| Denmark | 2025 | 95,007 |
| Thailand | 2025 | 84,017 |
| Zambia | 2025 | 83,225 |
| Cote d'Ivoire | 2025 | 74,630 |
| Hungary | 2025 | 71,332 |
| Portugal | 2025 | 70,349 |
| Congo | 2025 | 62,500 |
| Central African Rep. | 2025 | 55,307 |
| South Africa | 2025 | 55,177 |
| Lithuania | 2025 | 54,381 |
| Togo | 2025 | 54,167 |
| Yemen | 2025 | 49,107 |
| Cyprus | 2025 | 48,207 |
| Japan | 2025 | 42,450 |
| Estonia | 2025 | 41,299 |
| Burkina Faso | 2025 | 40,996 |
| Serbia and Kosovo: S/RES/1244 (1999) | 2025 | 40,863 |
| Belarus | 2025 | 40,794 |
| Costa Rica | 2025 | 36,395 |
| Malawi | 2025 | 35,241 |
| Australia | 2025 | 33,415 |
| Latvia | 2025 | 32,454 |
| Croatia | 2025 | 29,748 |
| Georgia | 2025 | 26,522 |
| Ecuador | 2025 | 26,428 |
| Angola | 2025 | 25,396 |
| Djibouti | 2025 | 24,899 |
| Ghana | 2025 | 21,050 |
| Somalia | 2025 | 20,967 |
| Afghanistan | 2025 | 20,869 |
| North Macedonia | 2025 | 20,822 |
| Nepal | 2025 | 19,613 |
| Senegal | 2025 | 17,259 |
| Benin | 2025 | 16,974 |
| Venezuela (Bolivarian Republic of) | 2025 | 14,333 |
| Slovenia | 2025 | 12,513 |
| Montenegro | 2025 | 12,269 |
| Russian Federation | 2025 | 11,811 |
| Luxembourg | 2025 | 10,284 |
| Syrian Arab Rep. | 2025 | 9,885 |
| Tajikistan | 2025 | 8,620 |
| Zimbabwe | 2025 | 8,570 |
| Iceland | 2025 | 8,459 |
| Malta | 2025 | 8,306 |
| Papua New Guinea | 2025 | 7,727 |
| Indonesia | 2025 | 7,374 |
| Morocco | 2025 | 7,304 |
| Peru | 2025 | 6,788 |
| Azerbaijan | 2025 | 6,389 |
| Namibia | 2025 | 5,470 |
| Mozambique | 2025 | 5,105 |
| Argentina | 2025 | 4,941 |
| Albania | 2025 | 4,673 |
| Paraguay | 2025 | 4,621 |
| Rep. of Korea | 2025 | 4,407 |
| Kazakhstan | 2025 | 4,377 |
| Gambia | 2025 | 4,108 |
| Uruguay | 2025 | 3,195 |
| Panama | 2025 | 2,694 |
| Chile | 2025 | 2,631 |
| Tunisia | 2025 | 2,386 |
| Ukraine | 2025 | 2,370 |
| Guinea | 2025 | 2,154 |
| New Zealand | 2025 | 2,148 |
| Trinidad and Tobago | 2025 | 1,877 |
| Guatemala | 2025 | 1,586 |
| Colombia | 2025 | 1,464 |
| Eswatini | 2025 | 1,414 |
| United Arab Emirates | 2025 | 1,377 |
| Israel | 2025 | 1,274 |
| Liberia | 2025 | 1,172 |
| Kyrgyzstan | 2025 | 1,150 |
| Bolivia (Plurinational State of) | 2025 | 1,147 |
| Philippines | 2025 | 1,032 |
| Liechtenstein | 2025 | 987 |
| Botswana | 2025 | 847 |
| Bosnia and Herzegovina | 2025 | 586 |
| Lesotho | 2025 | 478 |
| Saudi Arabia | 2025 | 448 |
| Kuwait | 2025 | 386 |
| Belize | 2025 | 347 |
| Oman | 2025 | 289 |
| Honduras | 2025 | 270 |
| Bahrain | 2025 | 240 |
| China, Hong Kong SAR | 2025 | 236 |
| China | 2025 | 230 |
| Sri Lanka | 2025 | 213 |
| Qatar | 2025 | 195 |
| El Salvador | 2025 | 182 |
| Gabon | 2025 | 166 |
| Eritrea | 2025 | 119 |
| Cuba | 2025 | 115 |
| Madagascar | 2025 | 87 |
| Cayman Islands | 2025 | 53 |
| Guyana | 2025 | 35 |
| Guinea-Bissau | 2025 | 24 |
| Mauritius | 2025 | 24 |
| Suriname | 2025 | 24 |
| Cambodia | 2025 | 23 |
| Dominican Rep. | 2025 | 20 |
| Monaco | 2025 | 17 |
| Sint Maarten (Dutch part) | 2025 | 17 |
| Fiji | 2025 | 15 |
| Viet Nam | 2025 | 13 |
| Mongolia | 2025 | 11 |
| Bahamas | 2025 | 10 |
| Turkmenistan | 2025 | 9 |
| Turks and Caicos Islands | 2025 | 8 |
| British Virgin Islands | 2025 | 6 |
| Barbados | 2025 | 5 |
| Comoros | 2025 | 5 |
| Nauru | 2025 | 5 |
| Saint Kitts and Nevis | 2025 | 5 |
| Saint Lucia | 2025 | 5 |
| Uzbekistan | 2025 | 5 |
| Aruba | 2025 | 0 |
| Brunei Darussalam | 2025 | 0 |
| Cabo Verde | 2025 | 0 |
| Curacao | 2025 | 0 |
| Dominica | 2025 | 0 |
| Haiti | 2025 | 0 |
| Myanmar | 2025 | 0 |
| Sierra Leone | 2025 | 0 |
| Singapore | 2025 | 0 |
| Vanuatu | 2025 | 0 |
Source and interpretation limits
The values come from the UNHCR Refugee Statistics 2025 population API using the refugee field by country or territory of asylum. The Global Trends annexes present related end-year population groups by country or territory of asylum. UNHCR states that its population data is sourced primarily from governments and from its own operations; annual statistics for 2025 were released on 11 June 2026.
This series is well suited to comparing where refugees under UNHCR’s mandate were hosted at the end of 2025. It does not by itself show the refugees’ countries of origin, new refugee flows during the year, return movements, resettlement, naturalization, length of stay, living conditions or the relative burden on each host society. It also excludes separate headline categories such as Palestine refugees under UNRWA’s mandate and other people in need of international protection. Those scope differences should be checked before comparing totals across reports.
Frequently Asked Questions
Which host country has the largest refugee population in this 2025 UNHCR dataset?
Germany has the largest value at 2,655,191, followed by Türkiye, Uganda, Chad and Bangladesh.
Is the 28.46 million total the same as the 41.6 million global refugee headline?
No. The 28.46 million total is the refugee series under UNHCR’s mandate. The broader global headline also includes separate populations such as Palestine refugees under UNRWA’s mandate and other people in need of international protection.
Does this map show refugees by country of origin?
No. It is organized by country or territory of asylum, meaning where refugees were hosted at the end of 2025.
Does a zero mean no one needed international protection in that country?
No. It is only a zero in this refugee field. Asylum-seekers and other protection categories are counted separately.
Related Articles
Green Map creates custom-edited map images using open geographic data sources such as geoBoundaries, Natural Earth, OpenStreetMap, and government open data. These maps are edited visual materials, not raw data files, and are provided for education, documents, presentations, and graphic reference.