Gross savings as a share of GDP measures the economy-wide amount of income not used for final consumption, expressed relative to GDP. The World Bank NY.GNS.ICTR.ZS series contains 180 latest non-empty observations. 73 are from 2025 and another 73 are from 2024, while the complete latest-value set spans 1994–2025. The map therefore shows the geography of latest available observations, while rankings and descriptive statistics focus on the same-year 2025 subset.
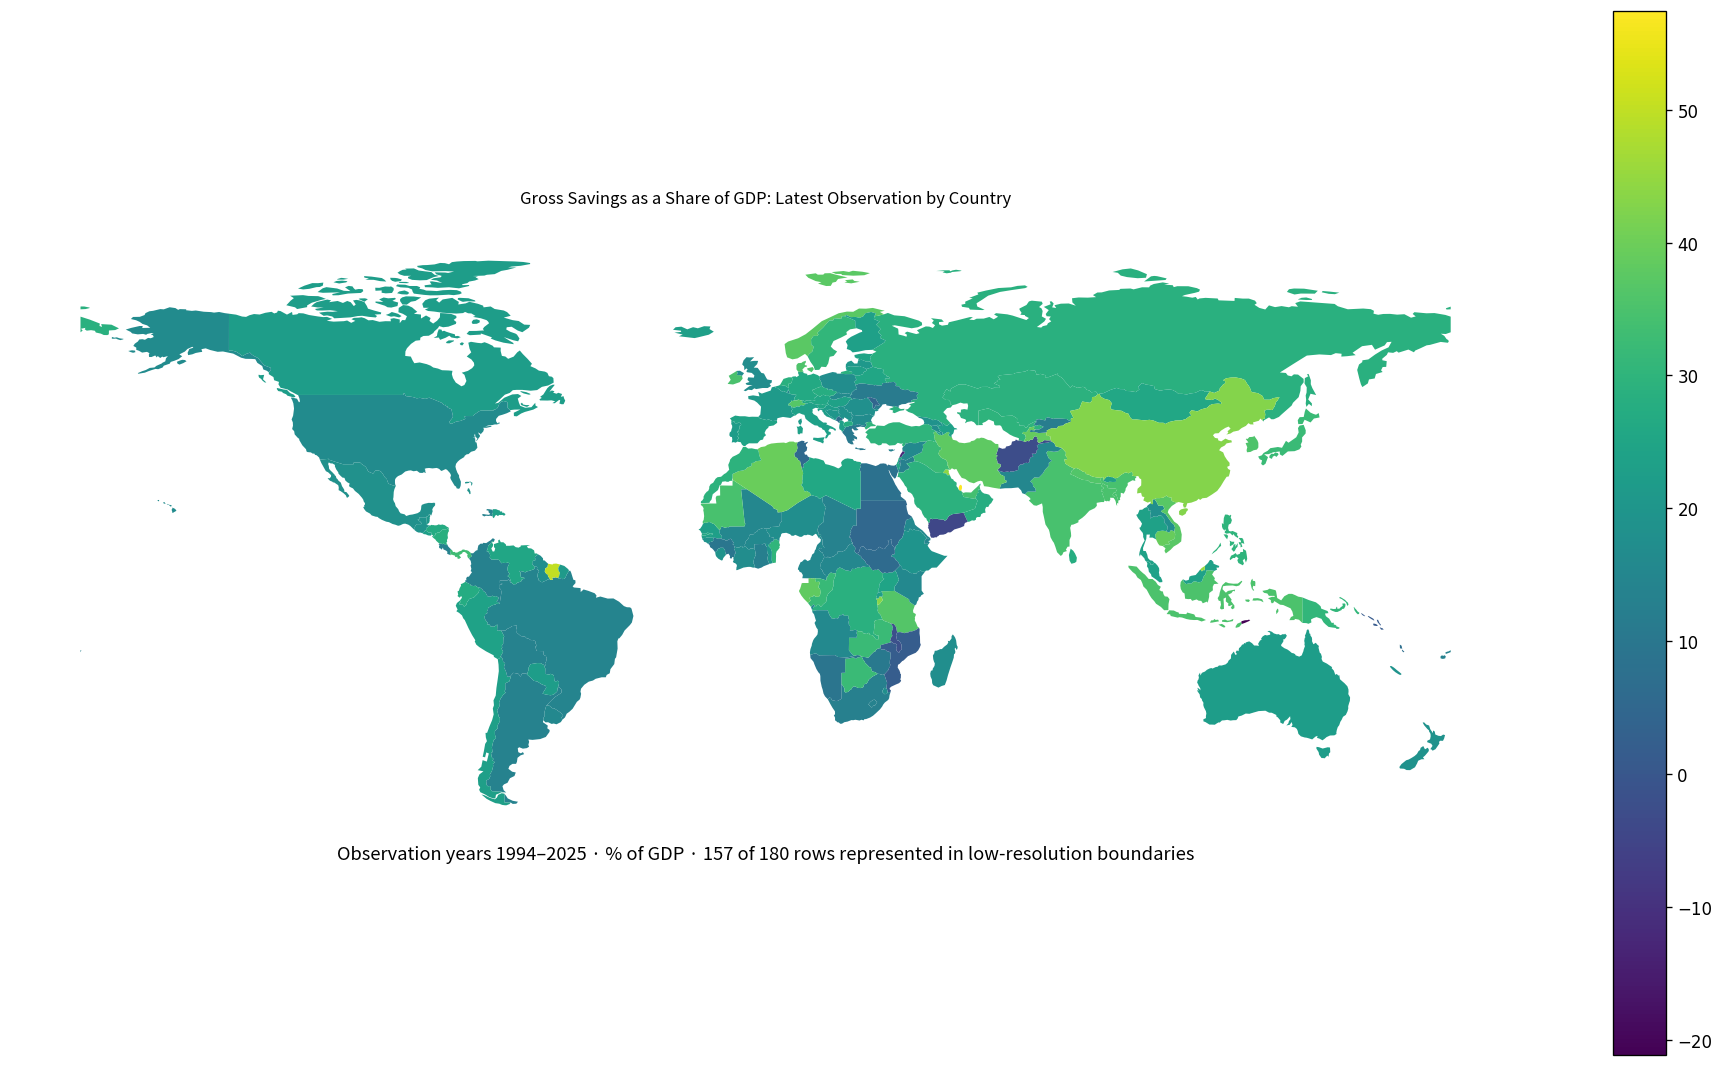
Table of Contents
What gross savings as a share of GDP measures
The World Bank defines gross savings as gross national income less total consumption, plus net transfers. This indicator divides gross savings by GDP. It is therefore an economy-wide national-accounts measure rather than a household bank-deposit or personal-saving statistic.
A value of 25% means gross savings are equivalent to about one-quarter of GDP for that period. It does not mean 25% of GDP is held as cash or deposits. In national accounts, saving is the part of income not consumed and can be associated with domestic investment or net lending to the rest of the world.
The map combines latest observations from different years
Among the 180 latest observations, 73 are dated 2025 and 73 are dated 2024. There are 10 from 2023, 3 from 2022, and smaller groups from earlier years. The oldest latest observation is from 1994.
| Observation year | Economies/territories | Share of 180 |
|---|---|---|
| 2025 | 73 | 40.6% |
| 2024 | 73 | 40.6% |
| 2023 | 10 | 5.6% |
| 2022 | 3 | 1.7% |
| 2021 | 1 | 0.6% |
| 2020 | 2 | 1.1% |
| 2018 | 1 | 0.6% |
| 2016 | 5 | 2.8% |
| 2015 | 2 | 1.1% |
| 2011 | 1 | 0.6% |
| 2010 | 2 | 1.1% |
| 2007 | 1 | 0.6% |
| 2005 | 1 | 0.6% |
| 2004 | 1 | 0.6% |
| 2000 | 2 | 1.1% |
| 1994 | 2 | 1.1% |
The map uses those 180 latest observations to show where higher and lower ratios appear geographically. ISO-code matching to the low-resolution world boundary file represents 157 economies. Small islands and territories missing from that boundary source are retained in the complete table. Because observation years differ, the map should not be interpreted as a single-year global ranking.
The 2025 mean is 23.41% and the median is 23.28%
The same-year 2025 subset contains 73 economies. Its mean is 23.41% and median 23.28%. The first quartile is 17.18% and the third quartile 27.74%, putting the middle half roughly between 17.2% and 27.7% of GDP.
50 observations are at least 20%, 13 are at least 30%, and 2 are at least 40%. Only 4 are below 10%, and none of the 2025 observations are negative. The same-year distribution is mostly positive but still spans more than forty percentage points.
Brunei Darussalam is highest in 2025 at 45.33%
Brunei Darussalam records 45.33%, followed by Burundi at 43.06%, Singapore at 39.98%, Cambodia at 39.16%, Norway at 37.25%, and Switzerland at 36.71%. Indonesia reaches 35.04%, Bangladesh 34.81%, and India 34.70%.
| 2025 rank | Economy/territory | Gross savings as % of GDP |
|---|---|---|
| 1 | Brunei Darussalam | 45.33% |
| 2 | Burundi | 43.06% |
| 3 | Singapore | 39.98% |
| 4 | Cambodia | 39.16% |
| 5 | Norway | 37.25% |
| 6 | Switzerland | 36.71% |
| 7 | Korea, Rep. | 35.60% |
| 8 | Indonesia | 35.04% |
| 9 | Bangladesh | 34.81% |
| 10 | India | 34.70% |
| 11 | Sweden | 30.62% |
| 12 | Philippines | 30.11% |
| 13 | Samoa | 30.03% |
| 14 | Uzbekistan | 29.54% |
| 15 | Morocco | 29.38% |
A high gross-saving ratio means a relatively large share of economy-wide income is not consumed. It should not automatically be read as evidence that the economy is healthier or that households are especially frugal. Income structure, corporate profits, government balances, cross-border income, transfers, and investment opportunities can all matter.
Moldova is lowest in 2025 at 4.10%
Moldova records 4.10%, followed by Montenegro at 7.05%, Egypt, Arab Rep. at 8.13%, and West Bank and Gaza at 9.19%. Cyprus is at 12.85%, South Africa 12.91%, Colombia 13.18%, Argentina 13.38%, and Costa Rica 13.59%.
| Low-order position in 2025 | Economy/territory | Gross savings as % of GDP |
|---|---|---|
| 1 | Moldova | 4.10% |
| 2 | Montenegro | 7.05% |
| 3 | Egypt, Arab Rep. | 8.13% |
| 4 | West Bank and Gaza | 9.19% |
| 5 | Cyprus | 12.85% |
| 6 | South Africa | 12.91% |
| 7 | Colombia | 13.18% |
| 8 | Argentina | 13.38% |
| 9 | Costa Rica | 13.59% |
| 10 | Lesotho | 13.59% |
| 11 | Luxembourg | 14.10% |
| 12 | Brazil | 14.42% |
| 13 | Pakistan | 15.23% |
| 14 | Uruguay | 15.52% |
| 15 | Slovak Republic | 16.23% |
A low value means a smaller share of economy-wide income remains after consumption, but it is not the same as a low household saving rate. Corporate and government saving, cross-border income, and net transfers are also part of the aggregate national-accounts result.
The 2024 distribution is different, but not a direct time trend
The 2024 subset also contains 73 observations. Its mean is 21.48% and median 19.67%, with a first quartile of 13.80% and third quartile of 29.91%. Macao SAR, China records 47.82%, Kuwait 44.13%, and China 42.72%. At the low end, Timor-Leste is -21.13% and Malawi -1.99%.
| 2024 high-order position | Economy/territory | Gross savings as % of GDP |
|---|---|---|
| 1 | Macao SAR, China | 47.82% |
| 2 | Kuwait | 44.13% |
| 3 | China | 42.72% |
| 4 | Algeria | 39.42% |
| 5 | Tajikistan | 38.75% |
| 6 | Marshall Islands | 38.09% |
| 7 | Viet Nam | 37.04% |
| 8 | Tanzania | 36.51% |
| 9 | Nepal | 36.05% |
| 10 | Denmark | 35.40% |
| 2024 low-order position | Economy/territory | Gross savings as % of GDP |
|---|---|---|
| 1 | Timor-Leste | -21.13% |
| 2 | Malawi | -1.99% |
| 3 | Solomon Islands | 1.08% |
| 4 | Mozambique | 1.71% |
| 5 | Seychelles | 2.54% |
| 6 | Tunisia | 5.49% |
| 7 | Sao Tome and Principe | 9.02% |
| 8 | Namibia | 9.45% |
| 9 | Guinea | 9.59% |
| 10 | Zimbabwe | 10.70% |
Although both yearly subsets contain 73 observations, they are not necessarily the same economies. The difference between the 2024 mean of 21.48% and the 2025 mean of 23.41% therefore should not be described as a one-year global increase. A valid trend comparison would match the same economies across years.
Gross savings and gross domestic savings are different
Gross savings are based on national income and include the effects of cross-border income and net transfers. Gross domestic savings, by contrast, focus on the part of domestic GDP not used for final consumption. The two measures can move together but need not be identical.
Economies with large net income receipts or transfers from abroad can show a noticeable gap between national gross savings and domestic savings. Comparing both indicators can help separate the domestic production side from income and transfers connected with the rest of the world.
A high saving ratio is not automatically a high investment ratio
Saving and investment are closely linked in national accounts, but gross savings do not have to equal domestic gross capital formation for an individual economy. When saving exceeds domestic investment, the difference can be associated with net lending to the rest of the world; when investment exceeds saving, external financing can fill the gap.
For that reason, gross savings are especially informative when read alongside gross capital formation, the current account, and national income. The saving ratio by itself does not establish whether investment is too low or too high.
How can gross savings be negative?
The complete latest-observation set includes negative values. Timor-Leste and Malawi are negative in the 2024 subset, for example. A negative gross-saving ratio means the national-accounts measure of income left after consumption and related adjustments is below zero relative to GDP.
The indicator alone cannot identify the precise cause. Sector balances, consumption, government finances, cross-border income, transfers, and year-specific circumstances need to be examined before attributing a negative value to any one behavior or policy.
Complete list of the 180 latest observations
The table below lists the latest non-empty observation for each economy and territory in alphabetical order. Rows not dated 2025 retain their original observation year. The map uses these latest values, while a strict same-year ranking should rely on the 2025 rows only.
| Economy/territory | Observation year | Gross savings as % of GDP |
|---|---|---|
| Afghanistan | 2020 | -2.74% |
| Albania | 2025 | 22.81% |
| Algeria | 2024 | 39.42% |
| Angola | 2024 | 15.88% |
| Argentina | 2025 | 13.38% |
| Armenia | 2025 | 16.91% |
| Aruba | 2023 | 13.88% |
| Australia | 2025 | 22.16% |
| Austria | 2025 | 25.81% |
| Azerbaijan | 2025 | 23.46% |
| Bahamas, The | 2024 | 19.21% |
| Bahrain | 2024 | 33.41% |
| Bangladesh | 2025 | 34.81% |
| Belarus | 2025 | 25.50% |
| Belgium | 2025 | 23.70% |
| Belize | 2024 | 20.33% |
| Benin | 2023 | 30.27% |
| Bermuda | 2023 | 43.42% |
| Bhutan | 2024 | 22.94% |
| Bolivia | 2024 | 13.80% |
| Bosnia and Herzegovina | 2025 | 20.29% |
| Botswana | 2024 | 32.00% |
| Brazil | 2025 | 14.42% |
| Brunei Darussalam | 2025 | 45.33% |
| Bulgaria | 2025 | 16.72% |
| Burkina Faso | 2024 | 15.89% |
| Burundi | 2025 | 43.06% |
| Cabo Verde | 2025 | 21.13% |
| Cambodia | 2025 | 39.16% |
| Cameroon | 2024 | 15.54% |
| Canada | 2025 | 22.23% |
| Central African Republic | 1994 | 15.09% |
| Chad | 1994 | 13.41% |
| Chile | 2025 | 22.81% |
| China | 2024 | 42.72% |
| Colombia | 2025 | 13.18% |
| Comoros | 2023 | 12.05% |
| Congo, Dem. Rep. | 2025 | 28.69% |
| Congo, Rep. | 2021 | 31.66% |
| Costa Rica | 2025 | 13.59% |
| Cote d’Ivoire | 2024 | 17.15% |
| Croatia | 2024 | 22.14% |
| Curacao | 2018 | 10.59% |
| Cyprus | 2025 | 12.85% |
| Czechia | 2025 | 27.74% |
| Denmark | 2024 | 35.40% |
| Djibouti | 2024 | 14.86% |
| Dominican Republic | 2025 | 23.28% |
| Ecuador | 2025 | 27.09% |
| Egypt, Arab Rep. | 2025 | 8.13% |
| El Salvador | 2025 | 22.79% |
| Eritrea | 2000 | 15.82% |
| Estonia | 2025 | 24.76% |
| Eswatini | 2024 | 17.66% |
| Ethiopia | 2024 | 19.67% |
| Faroe Islands | 2011 | 28.78% |
| Fiji | 2024 | 13.06% |
| Finland | 2025 | 23.16% |
| France | 2025 | 21.46% |
| French Polynesia | 2016 | 23.29% |
| Gabon | 2015 | 38.38% |
| Gambia, The | 2024 | 25.93% |
| Georgia | 2025 | 18.53% |
| Germany | 2025 | 26.37% |
| Ghana | 2024 | 12.39% |
| Greece | 2024 | 10.78% |
| Guatemala | 2024 | 19.32% |
| Guinea | 2024 | 9.59% |
| Guinea-Bissau | 2024 | 19.08% |
| Guyana | 2005 | 17.48% |
| Haiti | 2024 | 13.43% |
| Honduras | 2025 | 26.91% |
| Hong Kong SAR, China | 2024 | 29.20% |
| Hungary | 2025 | 23.84% |
| Iceland | 2025 | 22.98% |
| India | 2025 | 34.70% |
| Indonesia | 2025 | 35.04% |
| Iran, Islamic Rep. | 2000 | 37.94% |
| Iraq | 2024 | 32.01% |
| Ireland | 2024 | 34.86% |
| Israel | 2025 | 25.73% |
| Italy | 2025 | 23.43% |
| Japan | 2024 | 32.06% |
| Jordan | 2007 | 12.84% |
| Kazakhstan | 2024 | 28.99% |
| Kenya | 2024 | 15.57% |
| Kiribati | 2024 | 12.85% |
| Korea, Rep. | 2025 | 35.60% |
| Kosovo | 2025 | 25.20% |
| Kuwait | 2024 | 44.13% |
| Kyrgyz Republic | 2024 | 11.95% |
| Lao PDR | 2016 | 17.64% |
| Latvia | 2025 | 20.71% |
| Lebanon | 2023 | -12.55% |
| Lesotho | 2025 | 13.59% |
| Libya | 2023 | 25.86% |
| Lithuania | 2025 | 23.14% |
| Luxembourg | 2025 | 14.10% |
| Macao SAR, China | 2024 | 47.82% |
| Madagascar | 2024 | 17.53% |
| Malawi | 2024 | -1.99% |
| Malaysia | 2024 | 23.38% |
| Maldives | 2024 | 11.19% |
| Mali | 2024 | 15.08% |
| Malta | 2024 | 25.89% |
| Marshall Islands | 2024 | 38.09% |
| Mauritania | 2024 | 34.43% |
| Mauritius | 2024 | 21.11% |
| Mexico | 2025 | 18.26% |
| Moldova | 2025 | 4.10% |
| Mongolia | 2024 | 25.64% |
| Montenegro | 2025 | 7.05% |
| Morocco | 2025 | 29.38% |
| Mozambique | 2024 | 1.71% |
| Namibia | 2024 | 9.45% |
| Nepal | 2024 | 36.05% |
| Netherlands | 2024 | 28.83% |
| New Caledonia | 2016 | 19.33% |
| New Zealand | 2024 | 18.95% |
| Nicaragua | 2024 | 28.48% |
| Niger | 2024 | 17.47% |
| North Macedonia | 2025 | 27.55% |
| Norway | 2025 | 37.25% |
| Oman | 2024 | 27.71% |
| Pakistan | 2025 | 15.23% |
| Palau | 2023 | -12.99% |
| Panama | 2024 | 33.00% |
| Papua New Guinea | 2004 | 30.42% |
| Paraguay | 2025 | 22.20% |
| Peru | 2025 | 24.05% |
| Philippines | 2025 | 30.11% |
| Poland | 2025 | 17.09% |
| Portugal | 2024 | 21.99% |
| Qatar | 2022 | 57.42% |
| Romania | 2025 | 18.05% |
| Russian Federation | 2025 | 28.64% |
| Rwanda | 2024 | 22.78% |
| Samoa | 2025 | 30.03% |
| San Marino | 2023 | 38.58% |
| Sao Tome and Principe | 2024 | 9.02% |
| Saudi Arabia | 2025 | 28.90% |
| Senegal | 2023 | 22.94% |
| Serbia | 2025 | 18.97% |
| Seychelles | 2024 | 2.54% |
| Sierra Leone | 2024 | 19.18% |
| Singapore | 2025 | 39.98% |
| Slovak Republic | 2025 | 16.23% |
| Slovenia | 2025 | 25.50% |
| Solomon Islands | 2024 | 1.08% |
| South Africa | 2025 | 12.91% |
| South Sudan | 2015 | 6.18% |
| Spain | 2025 | 24.32% |
| Sri Lanka | 2024 | 27.60% |
| Sudan | 2022 | 4.99% |
| Suriname | 2010 | 50.34% |
| Sweden | 2025 | 30.62% |
| Switzerland | 2025 | 36.71% |
| Syrian Arab Republic | 2010 | 15.84% |
| Tajikistan | 2024 | 38.75% |
| Tanzania | 2024 | 36.51% |
| Thailand | 2025 | 23.93% |
| Timor-Leste | 2024 | -21.13% |
| Togo | 2020 | 19.53% |
| Tonga | 2024 | 18.54% |
| Tunisia | 2024 | 5.49% |
| Turkiye | 2024 | 29.91% |
| Uganda | 2024 | 24.70% |
| Ukraine | 2024 | 11.25% |
| United Arab Emirates | 2023 | 33.83% |
| United Kingdom | 2025 | 17.18% |
| United States | 2024 | 16.60% |
| Uruguay | 2025 | 15.52% |
| Uzbekistan | 2025 | 29.54% |
| Vanuatu | 2022 | 7.15% |
| Venezuela, RB | 2016 | 25.22% |
| Viet Nam | 2024 | 37.04% |
| West Bank and Gaza | 2025 | 9.19% |
| Yemen, Rep. | 2016 | -4.51% |
| Zambia | 2024 | 32.16% |
| Zimbabwe | 2024 | 10.70% |
How to interpret the map and comparison
First, the map combines latest observations from 1994–2025 rather than one common year. Second, gross savings are an economy-wide national-accounts measure and are not the same as household saving. Third, a higher ratio is not automatically good and a lower ratio is not automatically bad. Fourth, the indicator is a percentage of GDP rather than an absolute amount of saving.
Fifth, low-resolution world boundaries do not draw every small island and territory; the complete table preserves all 180 source rows. A detailed country analysis should check the latest World Bank time series and current national accounts, especially when the latest observation is several years old.
Source and calculation
The source is World Bank World Development Indicators NY.GNS.ICTR.ZS, Gross savings (% of GDP). The 2025 mean, median, quartiles, threshold counts, and rankings are calculated from the 73 observations dated 2025. The map uses each economy’s latest non-empty observation and explicitly discloses the mixed observation years.
Frequently Asked Questions
Is gross savings as a share of GDP the same as the household saving rate?
No. It is an economy-wide national-accounts measure that includes saving by households, firms, government, and related national-income adjustments.
What is the 2025 median?
The median across the 73 observations dated 2025 is 23.28%, while the mean is 23.41%.
Are all values on the map from 2025?
No. The map uses the latest non-empty observation for 180 economies, spanning 1994–2025. The strict 2025 comparison contains 73 economies.
Related Articles
Green Map creates custom-edited map images using open geographic data sources such as geoBoundaries, Natural Earth, OpenStreetMap, and government open data. These maps are edited visual materials, not raw data files, and are provided for education, documents, presentations, and graphic reference.