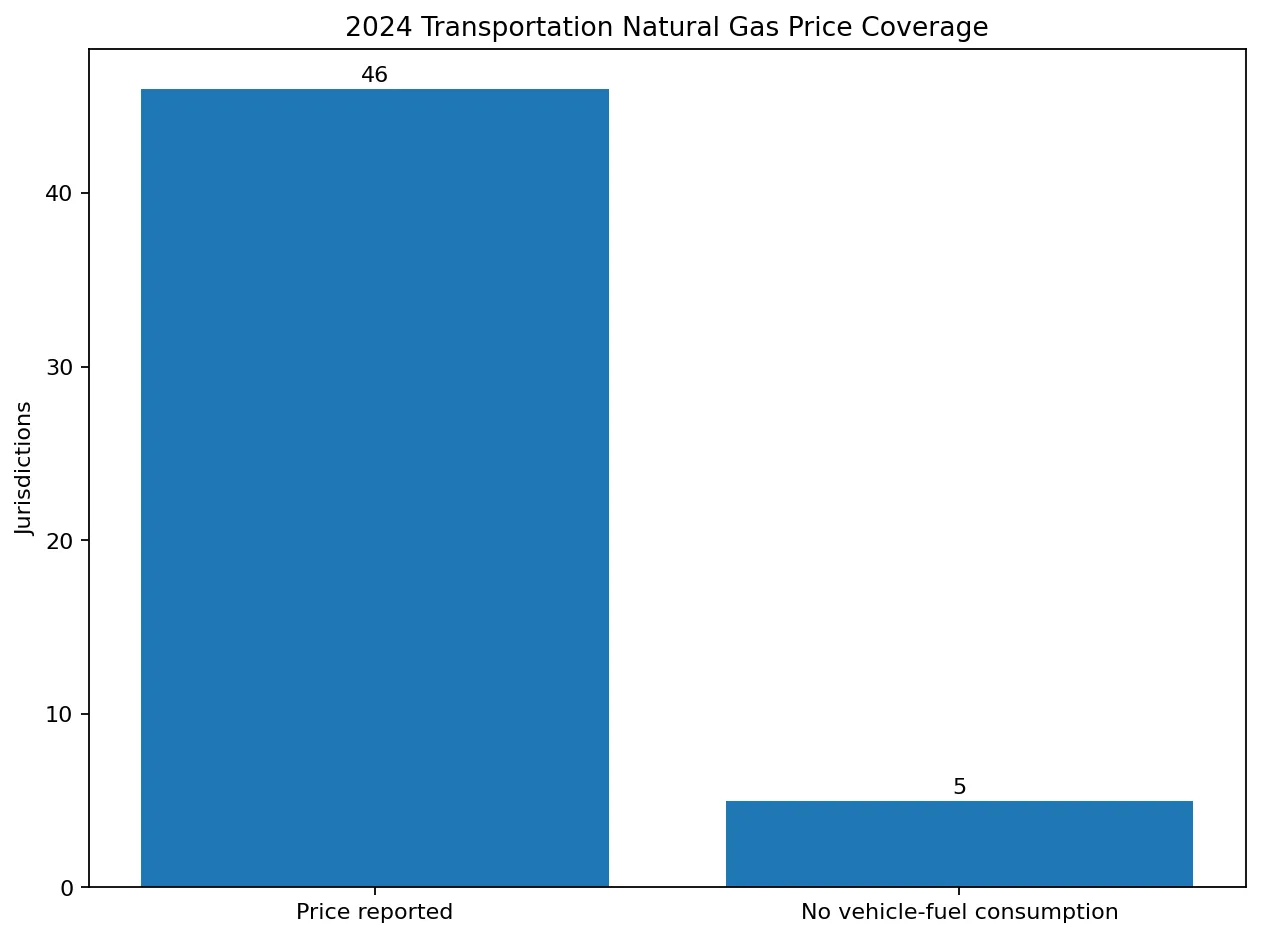
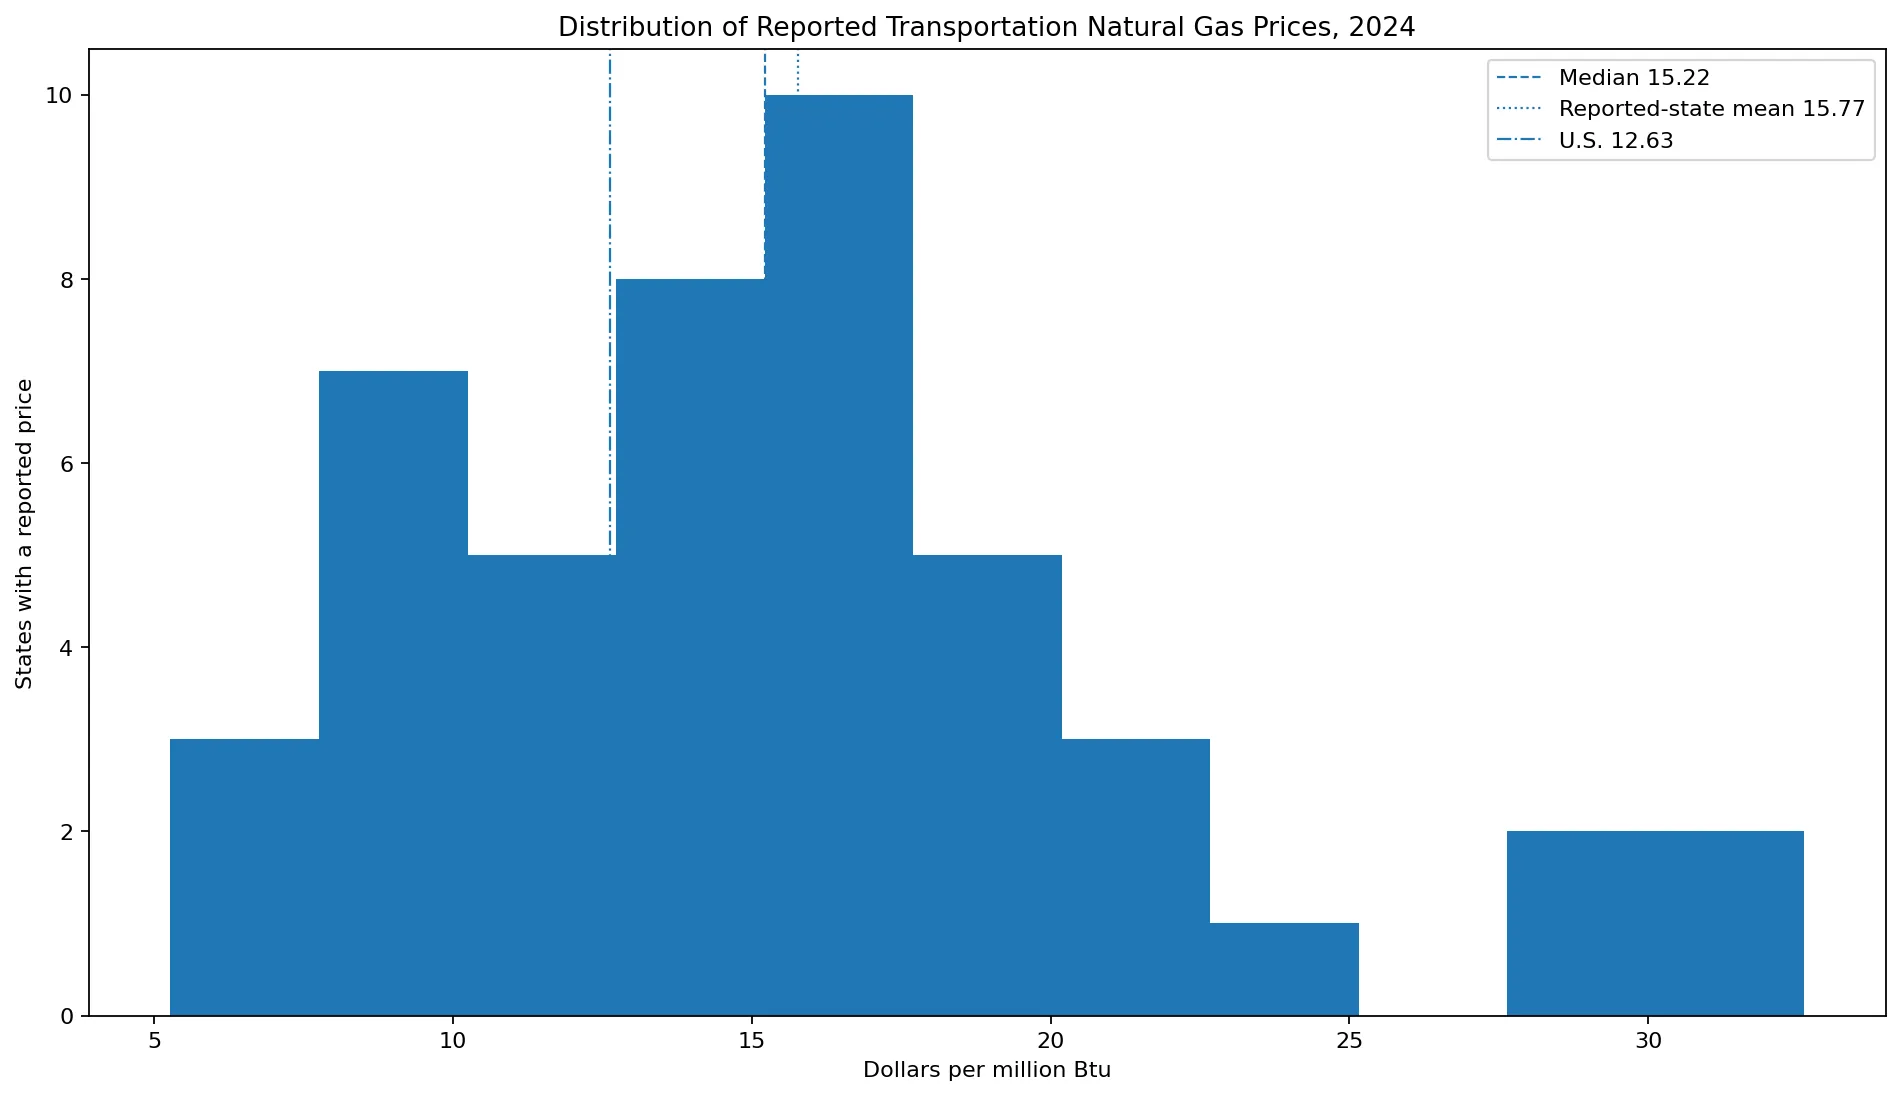
Natural gas prices in the U.S. transportation sector should be compared only where natural gas was used as vehicle fuel. In the 2024 EIA State Energy Data System data, 46 jurisdictions have a numerical transportation-sector price. Rhode Island is highest at $32.61 per million Btu, followed by Virginia at $32.00, Nebraska at $29.81, New York at $28.68, and Utah at $24.20. North Carolina has the lowest positive reported price at $5.27/MMBtu. Among the 46 numerical observations, the median is $15.22 and the unweighted mean is about $15.77.
The transportation definition is narrower than the name can suggest. EIA’s price and expenditure tables define transportation natural gas as vehicle fuel only. Natural gas used to operate pipelines can appear in transportation consumption accounting, but SEDS treats pipeline fuel as an intermediate process fuel and removes it when calculating transportation expenditures. The NGACD price series therefore represents natural gas vehicle fuel, mostly compressed natural gas (CNG), rather than pipeline operating fuel.
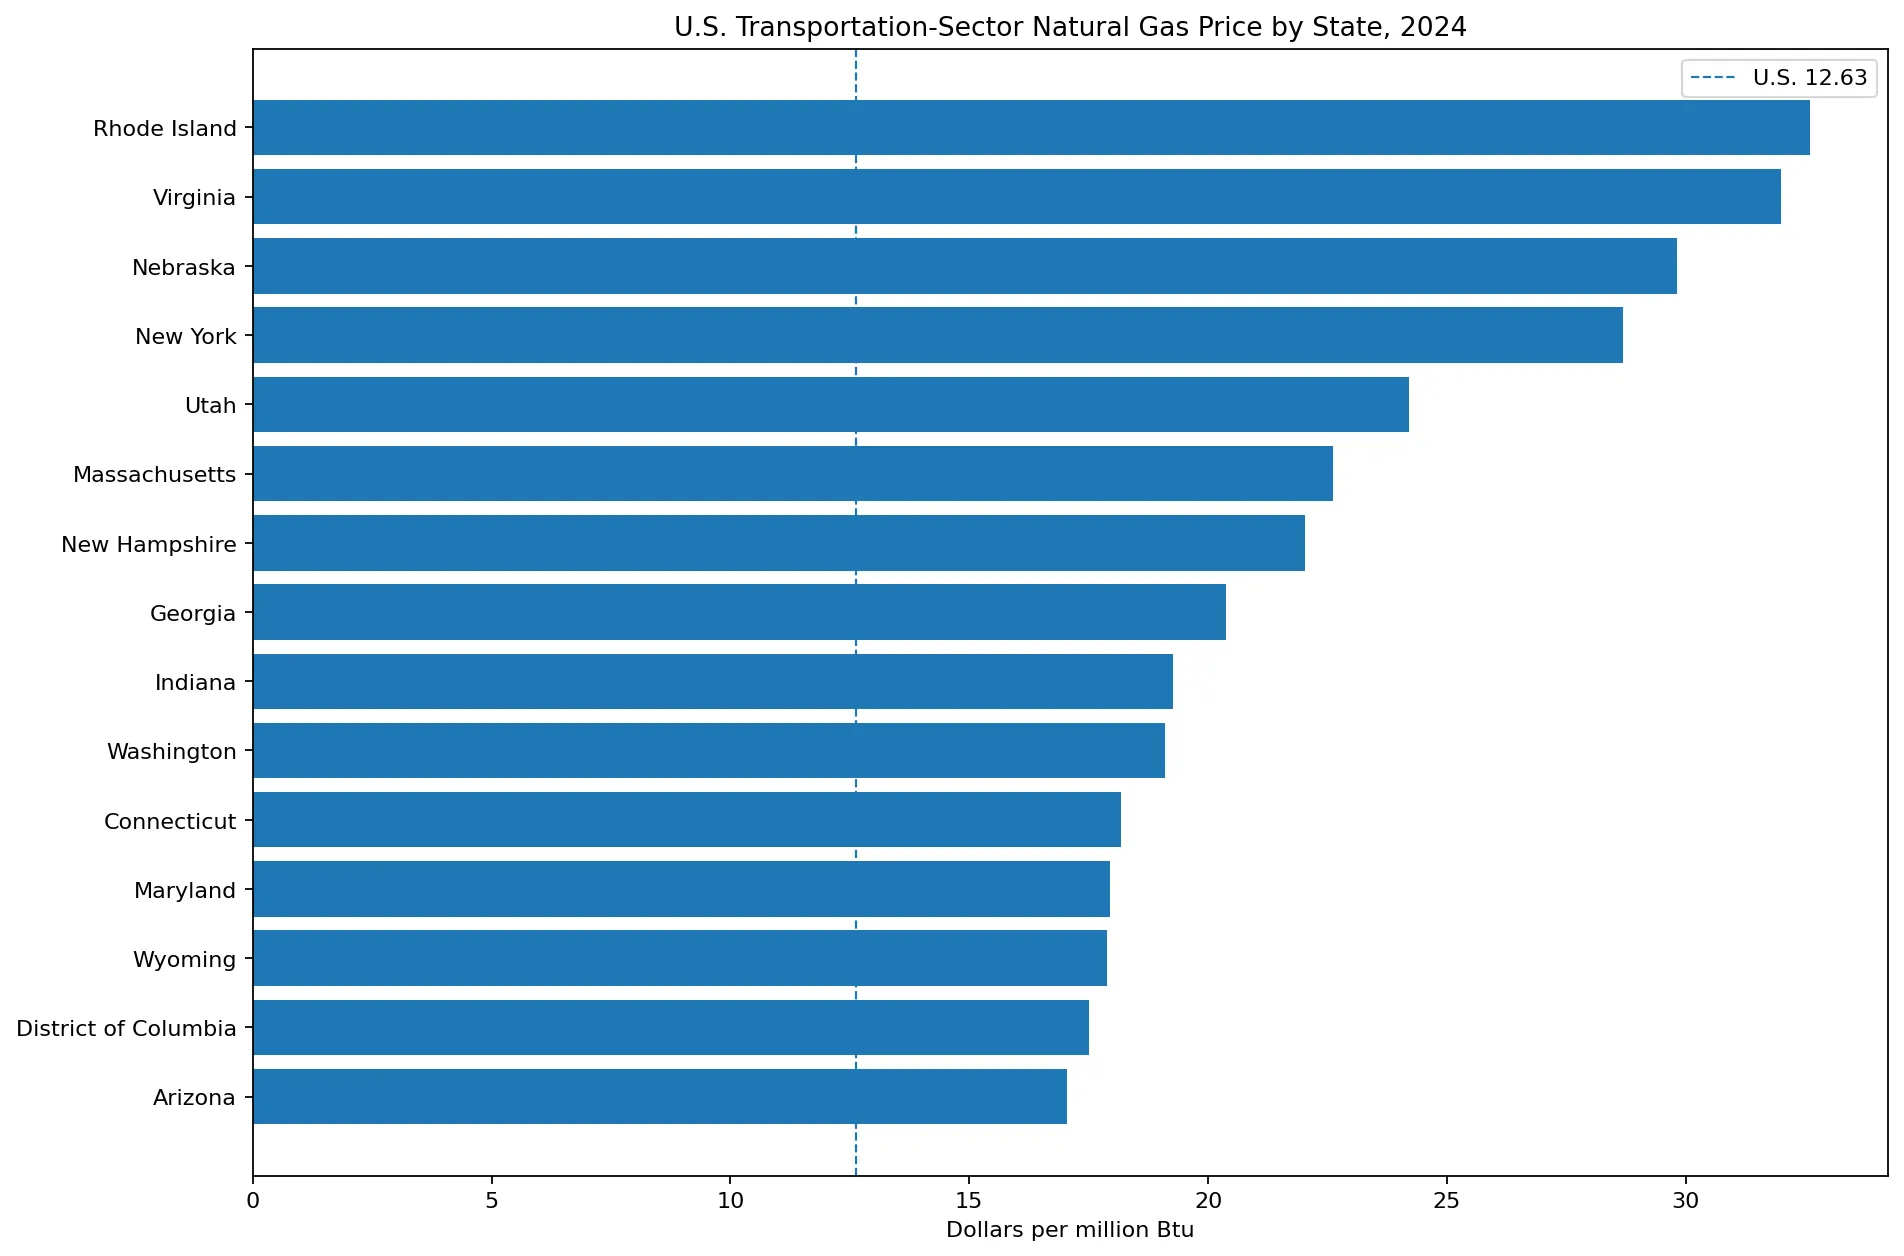
Table of Contents
What transportation-sector natural gas means
EIA Table F33 and Table E6 use a footnote that defines transportation natural gas as vehicle fuel only. This includes natural gas sold for use in vehicles rather than gas burned to move natural gas through pipelines. The distinction is especially important because pipeline operations can represent a much larger physical quantity than vehicle fuel in some states.
EIA’s technical notes describe the vehicle-fuel price series as mostly compressed natural gas. Much of the historical vehicle-fuel information represents deliveries to fueling stations serving fleets. The resulting price is therefore not equivalent to a residential utility tariff, an industrial natural gas price, or a power-plant gas price.
The series is expressed in dollars per million Btu. SEDS converts state vehicle-fuel prices to an energy-content basis using state-level average conversion factors. This allows natural gas vehicle fuel to be placed alongside gasoline, diesel, propane, jet fuel, and other transportation energy sources even though those fuels are sold in different physical units.
Rhode Island and Virginia exceed $32/MMBtu
Rhode Island is highest at $32.61/MMBtu and Virginia is second at $32.00. Nebraska records $29.81, New York $28.68, Utah $24.20, Massachusetts $22.62, New Hampshire $22.02, and Georgia $20.37.
Rhode Island is about 2.58 times the U.S. transportation natural gas price of $12.63 and roughly 6.2 times North Carolina’s $5.27 positive price. Those ratios look dramatic, but vehicle-fuel natural gas markets can be very small in some states. A high price from a small CNG market should not be generalized into a statement about the broader state natural gas market.
The values also do not all come from identical direct retail observations. For 2013 forward, SEDS links historical EIA natural gas vehicle-fuel prices with U.S. Department of Energy Alternative Fuels Data Center CNG price information. When state data are unavailable, regional price changes can be used, so small differences between adjacent states should not be treated as exact market-performance rankings.
North Carolina has the lowest positive price
North Carolina records $5.27/MMBtu, the lowest positive price among the 46 numerical observations. Oregon follows at $6.84, South Carolina at $7.75, Wisconsin at $7.95, North Dakota at $8.15, and Tennessee at $8.88. Missouri at $9.33 and Pennsylvania at $9.84 are also below $10.
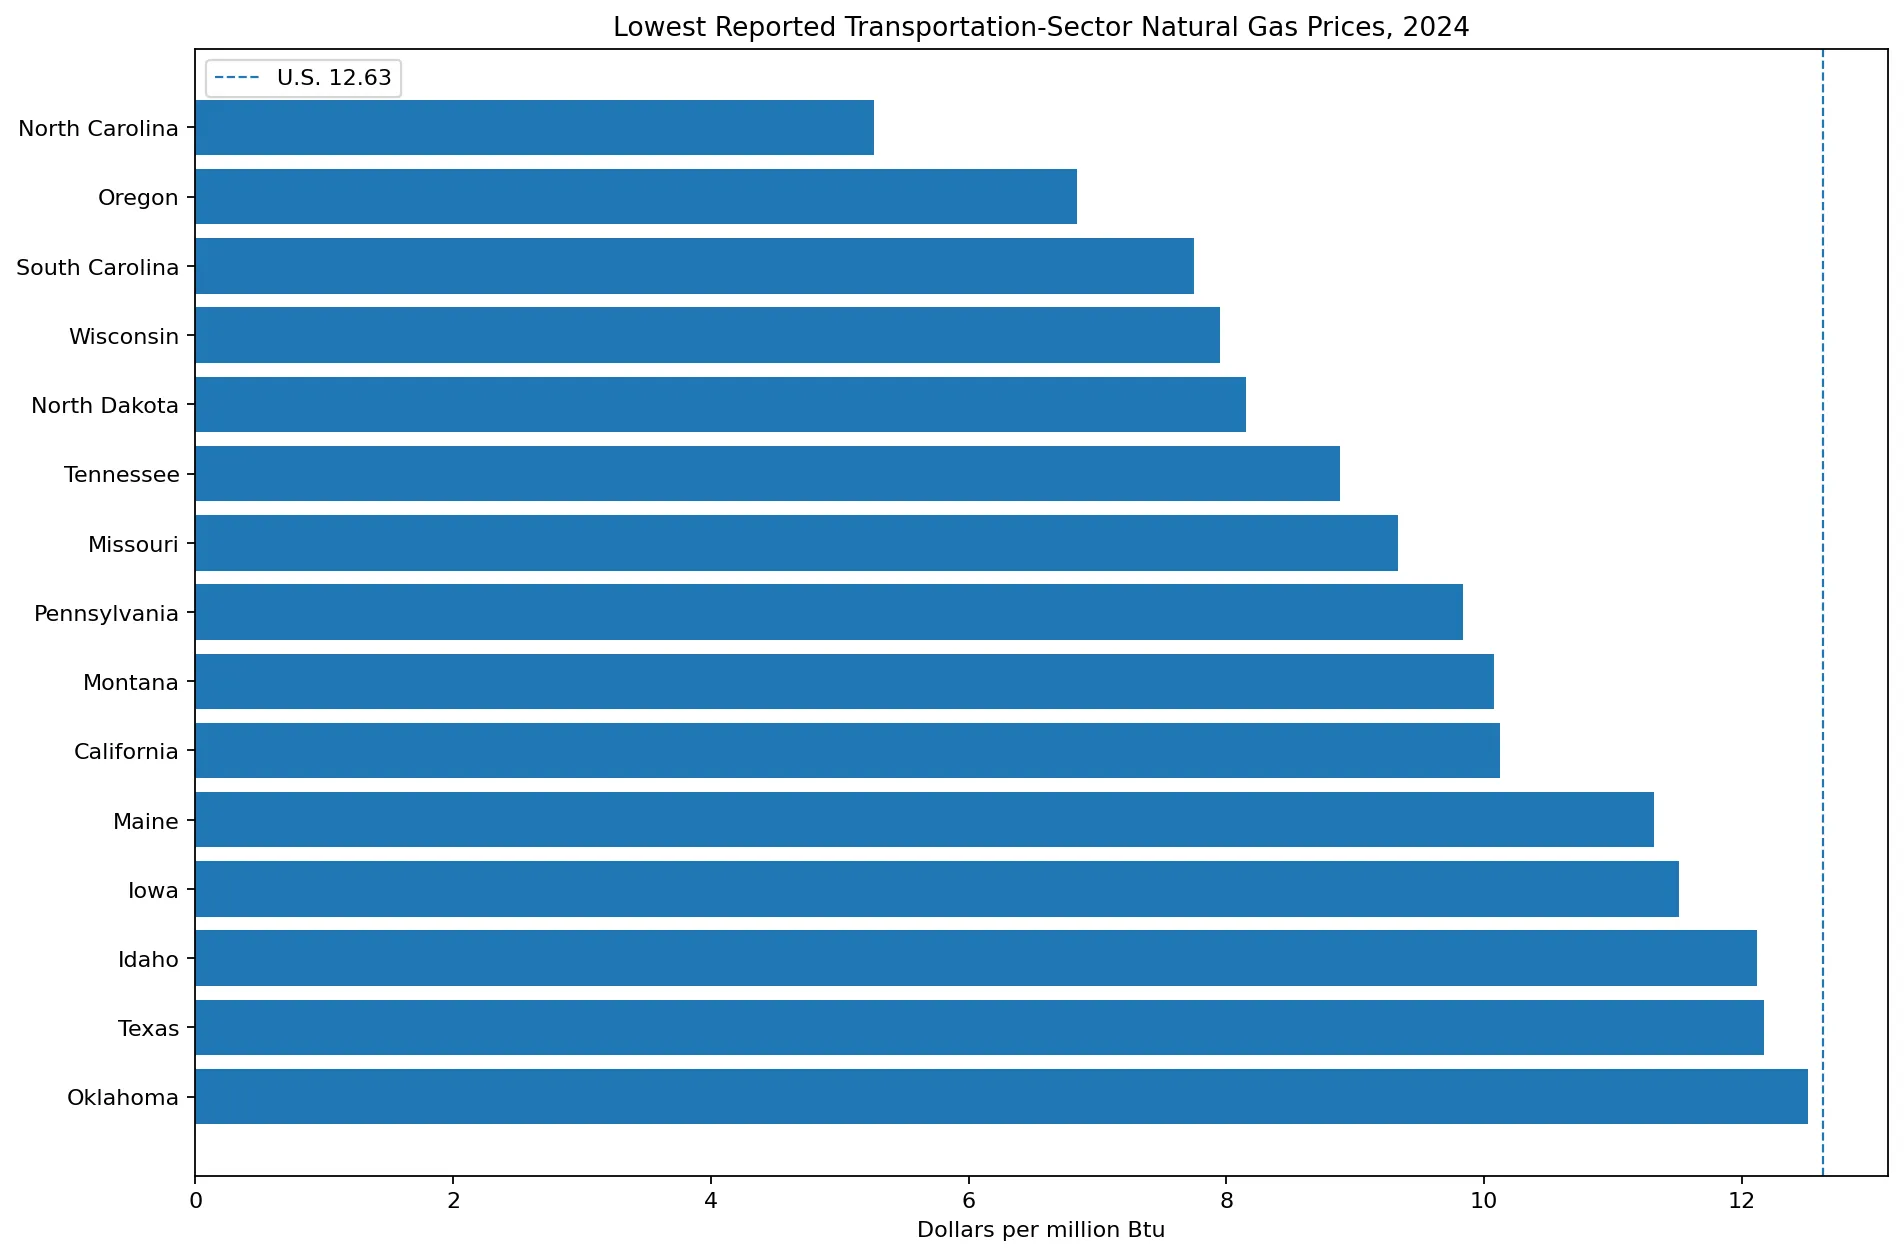
A low vehicle-fuel price does not imply high adoption of natural gas vehicles. Price measures the cost per unit of energy, while consumption measures how much vehicle fuel was actually used. A state can have a low price but a very small CNG market, or a high price and still account for only a small share of U.S. natural gas vehicle-fuel consumption.
Five zero entries represent no comparable vehicle-fuel price
Delaware, Hawaii, Michigan, South Dakota, and Vermont appear as 0.00 in the state series. In EIA transportation-sector tables, a dash is used where there is no consumption, and the transportation footnote limits natural gas to vehicle fuel. These five jurisdictions should therefore be treated as having no comparable 2024 vehicle-fuel price rather than as having $0 natural gas.
Putting these states at the bottom of a price ranking would create a false conclusion that natural gas vehicle fuel was free or nearly free. The same issue matters on maps: no-consumption jurisdictions should use a separate category instead of the lowest price color.
The U.S. transportation natural gas price is $12.63/MMBtu
EIA’s U.S. transportation table reports a 2024 natural gas vehicle-fuel price of $12.63/MMBtu. This is not the simple arithmetic mean of the 46 state prices. In the SEDS variable definitions, the U.S. NGACD price is calculated from U.S. transportation natural gas expenditures divided by U.S. transportation vehicle-fuel consumption, multiplied by 1000.
The unweighted mean of the 46 numerical state prices is about $15.77, more than three dollars above the national value. A high-price state receives the same one-observation weight in that simple mean even if its vehicle-fuel market is tiny. The national value instead gives more influence to states where more natural gas is actually consumed as vehicle fuel.
The $15.22 median is useful for describing the middle reported state, while $12.63 describes the effective U.S. price after consumption weights are applied. These measures answer different questions and should not be substituted for one another.
How EIA estimates vehicle-fuel prices from 2013 forward
For 1990 through 2012, SEDS natural gas vehicle-fuel prices came from EIA’s Natural Gas Annual using data collected on survey EIA-176. EIA stopped publishing those vehicle-fuel prices after 2012 because of data-quality concerns.
For 2013 forward, SEDS uses historical EIA vehicle-fuel prices together with compressed natural gas price data from the Department of Energy Alternative Fuels Data Center quarterly Clean Cities and Communities Alternative Fuel Price Reports. SEDS calculates simple annual average CNG prices by state and by Petroleum Administration for Defense District region, including taxes.
SEDS then applies the annual average growth rate of AFDC CNG prices to the previous year’s state SEDS price. State AFDC data are used when available; otherwise the corresponding regional growth rate is applied. The method preserves a state time series, but it also means the published 2024 value is an estimated SEDS annual price rather than a simple average of every CNG station transaction.
Why more states are above the U.S. price than below it
Among the 46 jurisdictions with a numerical price, 31 are above the U.S. $12.63 value and only 15 are below it. That does not mean most U.S. natural gas vehicle fuel was purchased above the national average. The national statistic is weighted by consumption, not by the number of states.
If large vehicle-fuel markets are concentrated in lower-price states, the national average can sit below the price reported in most jurisdictions. This is particularly important for a relatively small market such as natural gas vehicle fuel, where state consumption volumes can differ by orders of magnitude.
Transportation natural gas is only one part of transportation energy
Natural gas vehicle fuel is a small part of the broader U.S. transportation energy system. EIA Table E6 separately lists motor gasoline, distillate fuel oil, jet fuel, aviation gasoline, hydrocarbon gas liquids, lubricants, residual fuel oil, and other components. A state’s natural gas vehicle-fuel price does not determine its total transportation energy price.
Electric vehicle energy is also a separate concept. Some SEDS transportation electricity tables refer to electricity sales to public railroads and railway systems and explicitly exclude electric vehicles. Natural gas vehicle fuel, gasoline, diesel, and electricity therefore need to be matched to the correct definition before comparing transportation costs.
Official EIA references
EIA Table F33 reports 2024 natural gas prices and expenditures by sector and identifies transportation natural gas as vehicle fuel only. Table ET6 reports the 2024 U.S. transportation natural gas price of $12.63/MMBtu.
EIA’s price and expenditure technical notes describe the CNG-based vehicle-fuel price method used from 2013 forward. The 2024 variable definitions define NGACD and the consumption-weighted U.S. calculation.
All 51 jurisdictions in 2024
The table below retains the 50 states and the District of Columbia. Only the 46 jurisdictions with a numerical vehicle-fuel price receive a rank. The five no-consumption jurisdictions are shown with a dash.
| Rank | State | Code | Year | $/MMBtu | Status |
|---|---|---|---|---|---|
| 1 | Rhode Island | RI | 2024 | 32.61 | Price reported |
| 2 | Virginia | VA | 2024 | 32.00 | Price reported |
| 3 | Nebraska | NE | 2024 | 29.81 | Price reported |
| 4 | New York | NY | 2024 | 28.68 | Price reported |
| 5 | Utah | UT | 2024 | 24.20 | Price reported |
| 6 | Massachusetts | MA | 2024 | 22.62 | Price reported |
| 7 | New Hampshire | NH | 2024 | 22.02 | Price reported |
| 8 | Georgia | GA | 2024 | 20.37 | Price reported |
| 9 | Indiana | IN | 2024 | 19.27 | Price reported |
| 10 | Washington | WA | 2024 | 19.09 | Price reported |
| 11 | Connecticut | CT | 2024 | 18.18 | Price reported |
| 12 | Maryland | MD | 2024 | 17.94 | Price reported |
| 13 | Wyoming | WY | 2024 | 17.88 | Price reported |
| 14 | District of Columbia | DC | 2024 | 17.51 | Price reported |
| 15 | Arizona | AZ | 2024 | 17.05 | Price reported |
| 16 | New Jersey | NJ | 2024 | 16.95 | Price reported |
| 17 | Colorado | CO | 2024 | 16.86 | Price reported |
| 18 | West Virginia | WV | 2024 | 16.48 | Price reported |
| 19 | Mississippi | MS | 2024 | 16.20 | Price reported |
| 20 | Alaska | AK | 2024 | 16.18 | Price reported |
| 21 | Kentucky | KY | 2024 | 15.58 | Price reported |
| 22 | Arkansas | AR | 2024 | 15.39 | Price reported |
| 23 | Nevada | NV | 2024 | 15.31 | Price reported |
| 24 | Alabama | AL | 2024 | 15.13 | Price reported |
| 25 | Illinois | IL | 2024 | 14.87 | Price reported |
| 26 | Ohio | OH | 2024 | 14.66 | Price reported |
| 27 | Florida | FL | 2024 | 14.28 | Price reported |
| 28 | Louisiana | LA | 2024 | 14.11 | Price reported |
| 29 | Minnesota | MN | 2024 | 13.89 | Price reported |
| 30 | New Mexico | NM | 2024 | 13.39 | Price reported |
| 31 | Kansas | KS | 2024 | 13.02 | Price reported |
| 32 | Oklahoma | OK | 2024 | 12.51 | Price reported |
| 33 | Texas | TX | 2024 | 12.17 | Price reported |
| 34 | Idaho | ID | 2024 | 12.12 | Price reported |
| 35 | Iowa | IA | 2024 | 11.51 | Price reported |
| 36 | Maine | ME | 2024 | 11.32 | Price reported |
| 37 | California | CA | 2024 | 10.12 | Price reported |
| 38 | Montana | MT | 2024 | 10.08 | Price reported |
| 39 | Pennsylvania | PA | 2024 | 9.84 | Price reported |
| 40 | Missouri | MO | 2024 | 9.33 | Price reported |
| 41 | Tennessee | TN | 2024 | 8.88 | Price reported |
| 42 | North Dakota | ND | 2024 | 8.15 | Price reported |
| 43 | Wisconsin | WI | 2024 | 7.95 | Price reported |
| 44 | South Carolina | SC | 2024 | 7.75 | Price reported |
| 45 | Oregon | OR | 2024 | 6.84 | Price reported |
| 46 | North Carolina | NC | 2024 | 5.27 | Price reported |
| — | Delaware | DE | 2024 | — | No vehicle-fuel consumption |
| — | Hawaii | HI | 2024 | — | No vehicle-fuel consumption |
| — | Michigan | MI | 2024 | — | No vehicle-fuel consumption |
| — | South Dakota | SD | 2024 | — | No vehicle-fuel consumption |
| — | Vermont | VT | 2024 | — | No vehicle-fuel consumption |
Frequently Asked Questions
Which jurisdiction had the highest transportation natural gas price in 2024?
Rhode Island was highest at $32.61/MMBtu, followed by Virginia at $32.00 and Nebraska at $29.81.
Does the transportation price include natural gas used by pipelines?
No for the price and expenditure calculation. EIA defines the transportation price as vehicle fuel and removes pipeline fuel as an intermediate process use.
Do the five zero entries mean natural gas vehicle fuel cost $0?
No. EIA transportation tables use a dash for no consumption. Delaware, Hawaii, Michigan, South Dakota, and Vermont should be treated as having no comparable 2024 vehicle-fuel price.
What was the U.S. transportation natural gas price in 2024?
EIA Table ET6 reports $12.63/MMBtu for the United States, calculated as a vehicle-fuel consumption-weighted price.
Related Articles
Green Map creates custom-edited map images using open geographic data sources such as geoBoundaries, Natural Earth, OpenStreetMap, and government open data. These maps are edited visual materials, not raw data files, and are provided for education, documents, presentations, and graphic reference.