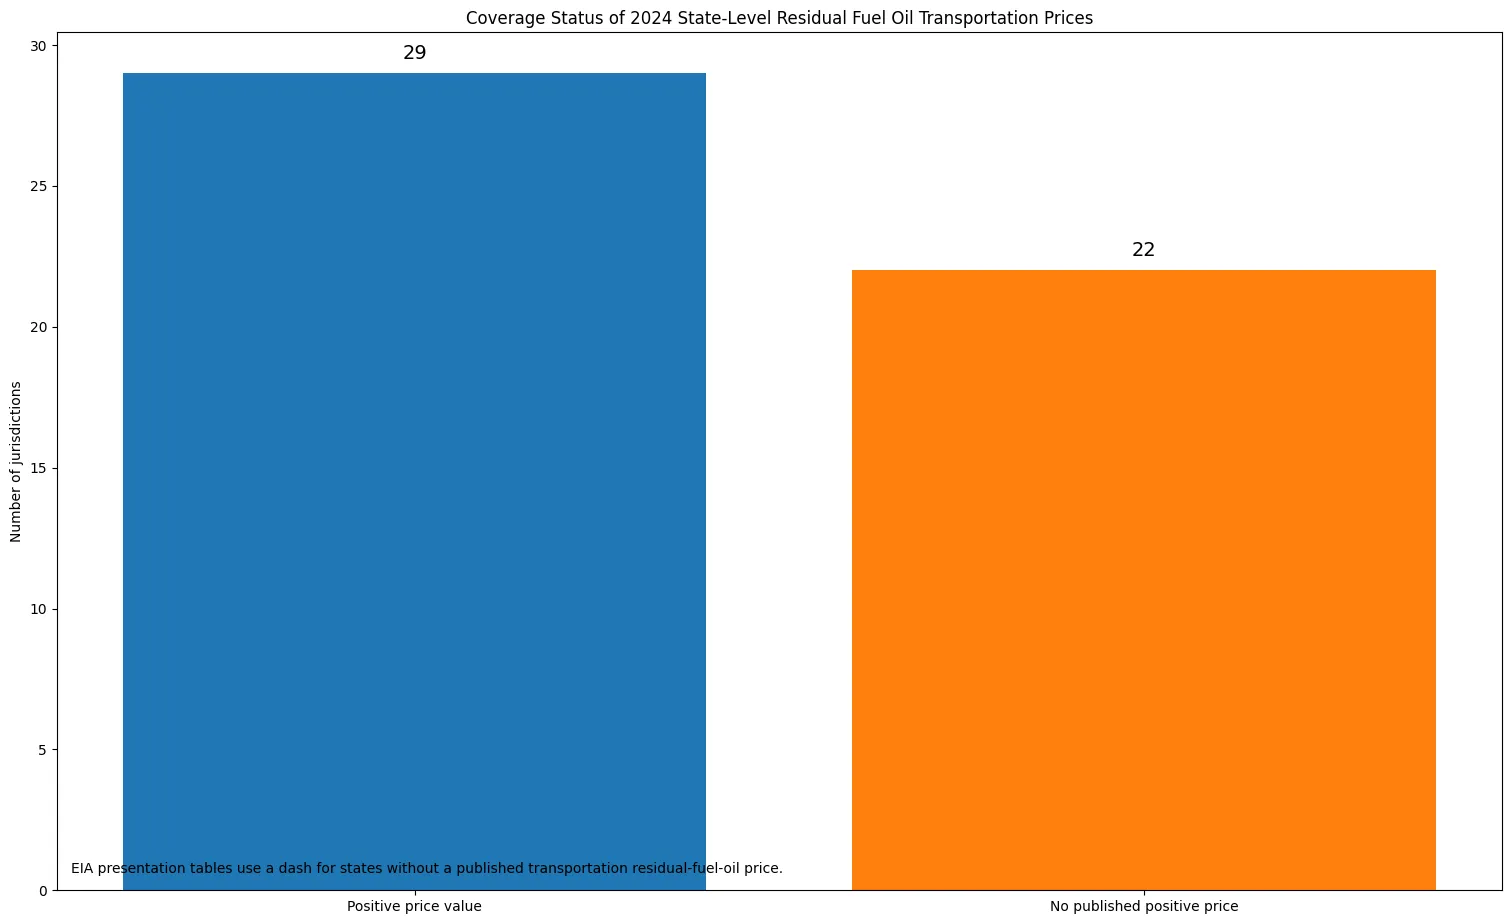
The 2024 state pattern for residual fuel oil prices in the U.S. transportation sector has an important data-quality wrinkle: not every jurisdiction has a published positive price. In the State Energy Data System (SEDS) extract, 29 of the 50 states plus the District of Columbia carry positive values, while 22 are coded as 0.00. In EIA’s reader-facing price table, those same transportation entries appear as dashes rather than as zero-dollar prices. They should therefore be treated as unavailable or not published for this comparison, not as actual free fuel.
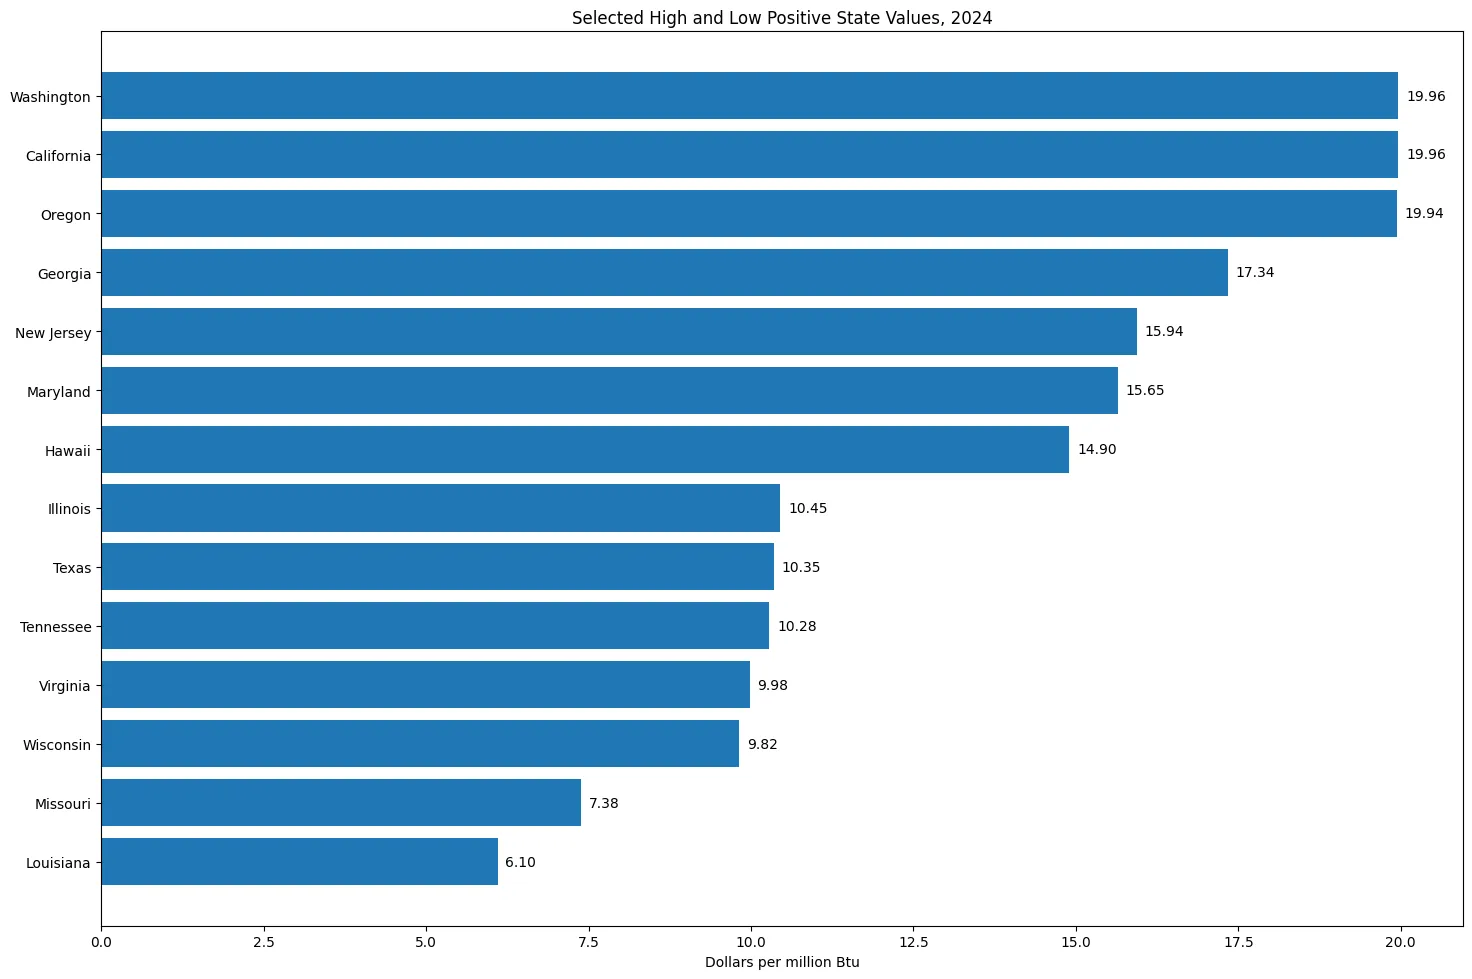
Among the 29 positive observations, California and Washington are tied at $19.96 per million Btu and Oregon follows at $19.94. Louisiana is the lowest positive observation at $6.10, followed by Missouri at $7.38. The positive-value median is $13.38 per million Btu and the simple mean is about $13.00. Those descriptive statistics summarize the state distribution; they are not a consumption-weighted U.S. price.
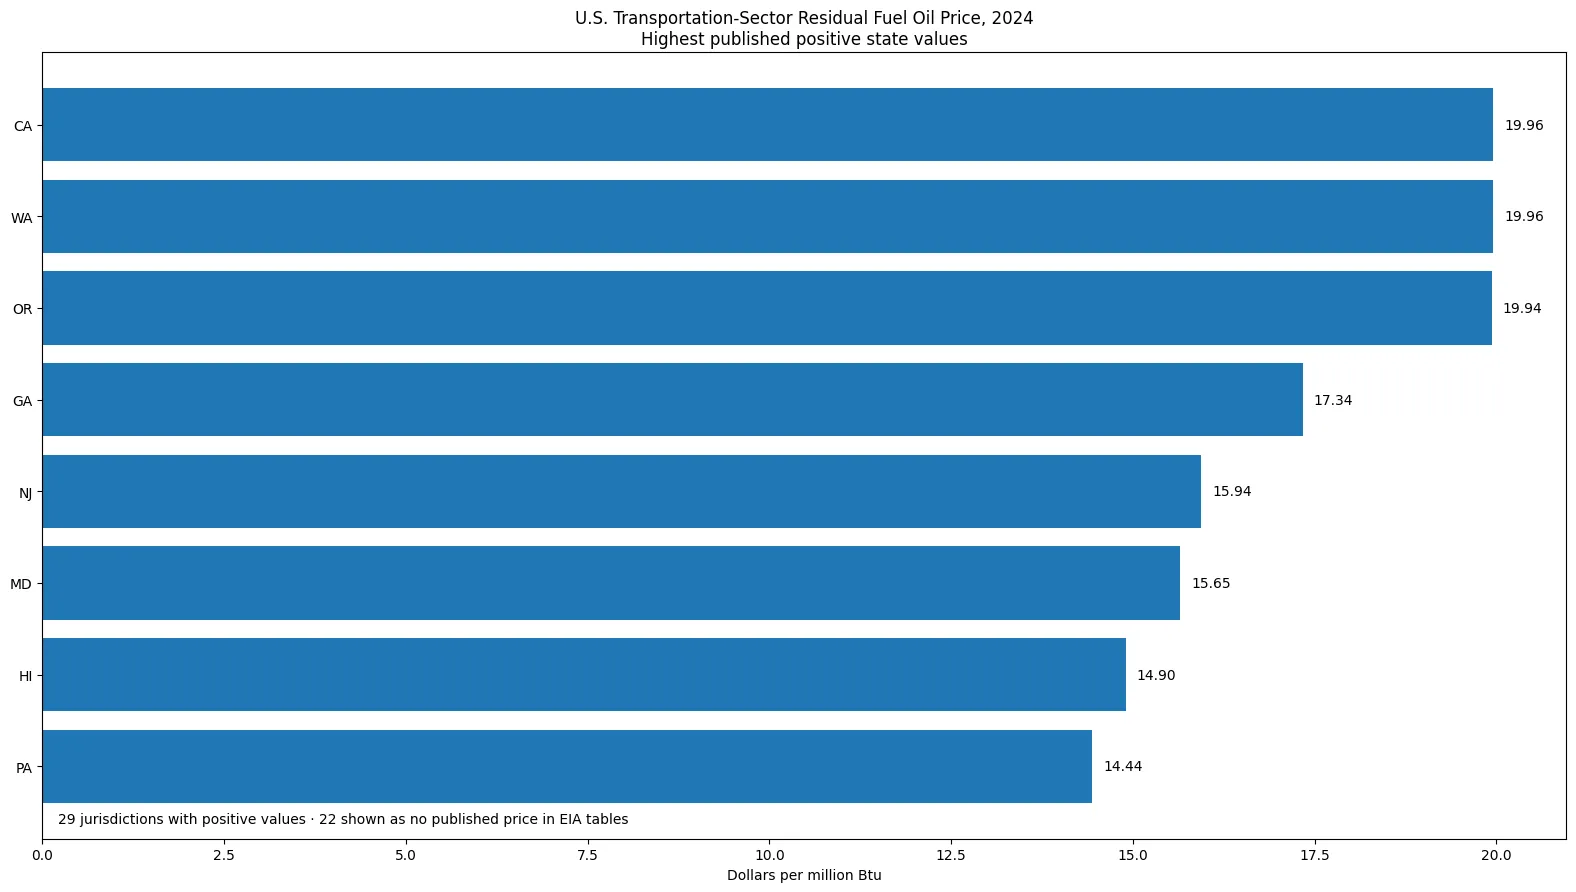
Table of Contents
What the transportation residual-fuel-oil price measures
SEDS reports this series in dollars per million Btu. That energy-normalized unit is useful for comparing fuels, but it is not the same as a retail pump price or a quoted price per barrel. The sector is specifically transportation, so the values should not be mixed with commercial, industrial, or electric-power residual fuel oil prices.
Residual fuel oil in the transportation accounting framework is associated with uses that include vessel bunkering, military use, and railroad use. That helps explain why the series is relevant to a relatively narrow set of activities rather than to ordinary passenger-vehicle fueling. It does not, however, justify attributing a state price to port traffic or any single local factor without additional evidence.
The estimation method also matters. Beginning with 2022, EIA no longer had physical-unit end-user prices from the discontinued EIA-782 survey, so SEDS moved to regression-based state estimates for residual fuel oil prices in the commercial, industrial, and transportation sectors. Historical SEDS prices and a set of national fuel and market price variables are used as inputs depending on the sector. The 2024 state figures are therefore annual SEDS estimates, not a compilation of individual transaction quotes.
The upper end of the 2024 distribution
The three Pacific states with published positive values occupy the top of the distribution: California and Washington at $19.96 per million Btu and Oregon at $19.94. Georgia is next at $17.34, followed by New Jersey at $15.94 and Maryland at $15.65. Hawaii, at $14.90, also sits above the middle of the positive-value group.
A broad middle band stretches through Pennsylvania at $14.44, Maine at $14.05, Rhode Island and Vermont at $14.03, North Carolina at $13.79, Delaware and South Carolina at $13.65, Florida at $13.38, and New York at $13.36. These values show a fairly continuous middle range rather than one single nationwide price applied to every state.
At the lower end, Louisiana records $6.10 per million Btu and Missouri $7.38. Wisconsin is $9.82 and Virginia $9.98. Tennessee, Texas, Illinois, Alabama, Indiana, Michigan, Massachusetts, and Ohio cluster roughly in the low-$10 range. The spread between the highest and lowest positive observations is $13.86 per million Btu.
Why 0.00 should not be ranked as a zero-dollar price
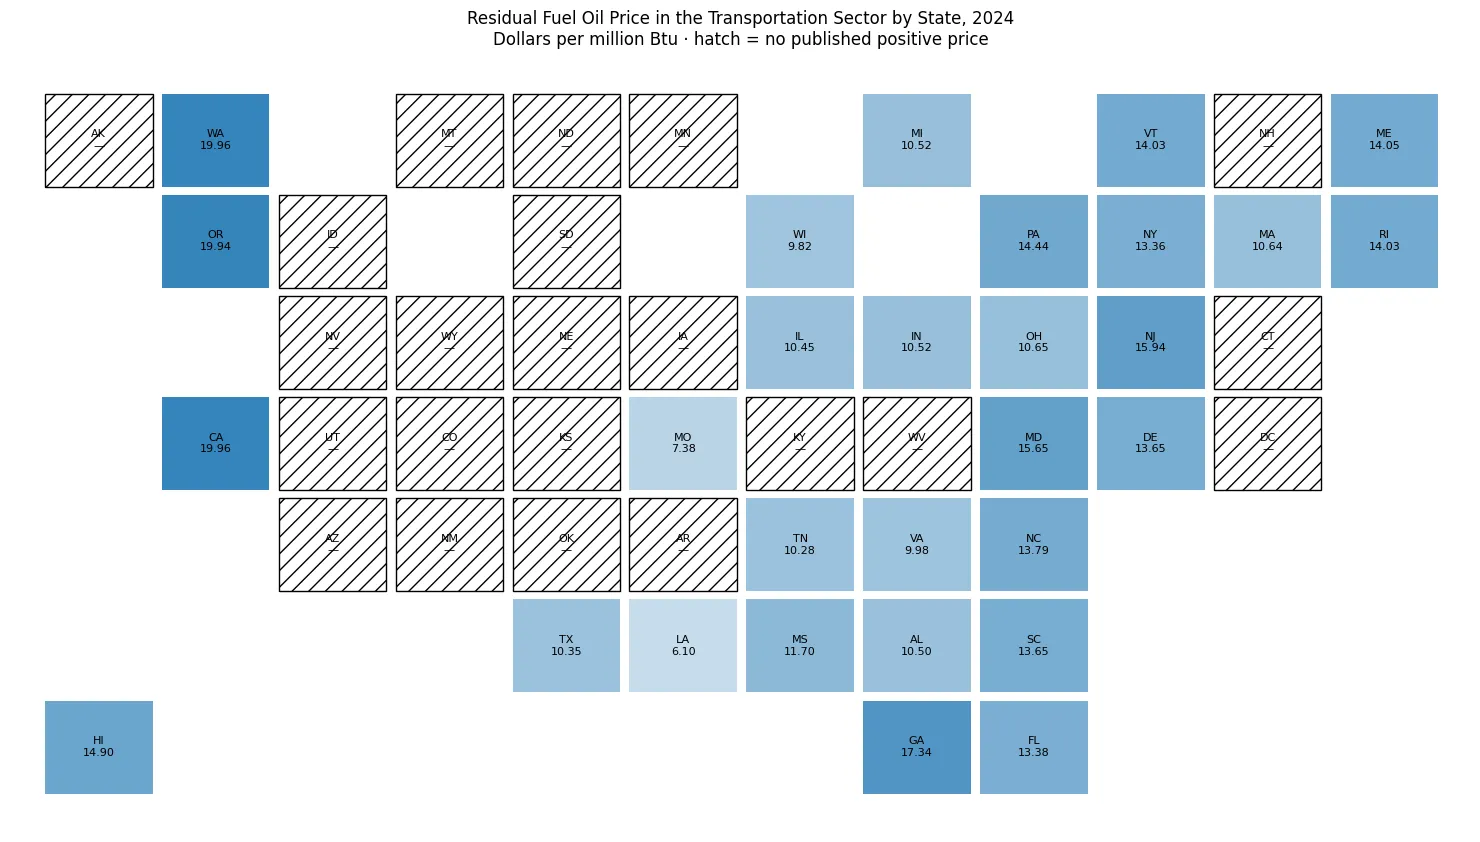
The bulk extract contains 0.00 for Alaska, Arkansas, Arizona, Colorado, Connecticut, the District of Columbia, Idaho, Iowa, Kansas, Kentucky, Minnesota, Montana, North Dakota, Nebraska, New Hampshire, New Mexico, Nevada, Oklahoma, South Dakota, Utah, West Virginia, and Wyoming. EIA’s published 2024 residual-fuel-oil table shows a dash in the transportation-price column for those jurisdictions.
That presentation difference changes the analysis. If 0.00 were treated as a real price, the state minimum would become zero, the distribution would be pulled downward, and a map could falsely imply that residual fuel oil was available at no cost. This page instead separates the 22 no-price jurisdictions from the 29 positive-price observations. No missing or unavailable value is filled with a neighboring-state average or an observation from another year.
The distinction is also useful for readers who want to reproduce the comparison. The raw state extract is preserved as published, but descriptive price statistics are calculated only from the positive values. That keeps the state ranking aligned with EIA’s human-readable table while avoiding an artificial zero-price category.
What can and cannot be inferred from the state gaps
A high estimated price does not imply high residual fuel oil consumption. Price, consumption, and expenditure are separate variables. Two states can have similar annual prices but very different quantities consumed, producing very different expenditures. For cost exposure or market-size questions, the price series should be paired with the matching transportation-sector consumption and expenditure series for the same year.
The reverse is equally important: a state with substantial activity does not have to have the highest price. Because SEDS uses a regression approach for recent state residual-fuel-oil prices, a single explanation such as taxes, delivery distance, refinery access, or port size is not enough to account for each state’s estimate. Those factors may matter in real markets, but the state comparison here should stay within what the SEDS methodology supports.
Even ties should be interpreted carefully. California and Washington both show $19.96 per million Btu, but that does not mean every transaction in the two states occurred at the same price. It means their annual SEDS state estimates round to the same reported value. Oregon at $19.94 is only two cents lower on the per-million-Btu scale, so all three form a very tight upper cluster.
All 51 jurisdictions
The table below lists positive prices from highest to lowest, then separates jurisdictions for which EIA’s presentation table does not publish a transportation residual-fuel-oil price. A dash is not a claim that the price was zero.
| Rank | Jurisdiction | Code | Year | Price ($/MMBtu) |
|---|---|---|---|---|
| 1 | California | CA | 2024 | 19.96 |
| 2 | Washington | WA | 2024 | 19.96 |
| 3 | Oregon | OR | 2024 | 19.94 |
| 4 | Georgia | GA | 2024 | 17.34 |
| 5 | New Jersey | NJ | 2024 | 15.94 |
| 6 | Maryland | MD | 2024 | 15.65 |
| 7 | Hawaii | HI | 2024 | 14.90 |
| 8 | Pennsylvania | PA | 2024 | 14.44 |
| 9 | Maine | ME | 2024 | 14.05 |
| 10 | Rhode Island | RI | 2024 | 14.03 |
| 11 | Vermont | VT | 2024 | 14.03 |
| 12 | North Carolina | NC | 2024 | 13.79 |
| 13 | Delaware | DE | 2024 | 13.65 |
| 14 | South Carolina | SC | 2024 | 13.65 |
| 15 | Florida | FL | 2024 | 13.38 |
| 16 | New York | NY | 2024 | 13.36 |
| 17 | Mississippi | MS | 2024 | 11.70 |
| 18 | Ohio | OH | 2024 | 10.65 |
| 19 | Massachusetts | MA | 2024 | 10.64 |
| 20 | Indiana | IN | 2024 | 10.52 |
| 21 | Michigan | MI | 2024 | 10.52 |
| 22 | Alabama | AL | 2024 | 10.50 |
| 23 | Illinois | IL | 2024 | 10.45 |
| 24 | Texas | TX | 2024 | 10.35 |
| 25 | Tennessee | TN | 2024 | 10.28 |
| 26 | Virginia | VA | 2024 | 9.98 |
| 27 | Wisconsin | WI | 2024 | 9.82 |
| 28 | Missouri | MO | 2024 | 7.38 |
| 29 | Louisiana | LA | 2024 | 6.10 |
| — | Alaska | AK | 2024 | — |
| — | Arizona | AZ | 2024 | — |
| — | Arkansas | AR | 2024 | — |
| — | Colorado | CO | 2024 | — |
| — | Connecticut | CT | 2024 | — |
| — | District of Columbia | DC | 2024 | — |
| — | Idaho | ID | 2024 | — |
| — | Iowa | IA | 2024 | — |
| — | Kansas | KS | 2024 | — |
| — | Kentucky | KY | 2024 | — |
| — | Minnesota | MN | 2024 | — |
| — | Montana | MT | 2024 | — |
| — | Nebraska | NE | 2024 | — |
| — | Nevada | NV | 2024 | — |
| — | New Hampshire | NH | 2024 | — |
| — | New Mexico | NM | 2024 | — |
| — | North Dakota | ND | 2024 | — |
| — | Oklahoma | OK | 2024 | — |
| — | South Dakota | SD | 2024 | — |
| — | Utah | UT | 2024 | — |
| — | West Virginia | WV | 2024 | — |
| — | Wyoming | WY | 2024 | — |
Sources and calculation notes
The underlying annual observations come from the U.S. Energy Information Administration State Energy Data System. EIA’s 2024 residual fuel oil price and expenditure table provides the state comparison across commercial, industrial, transportation, and electric-power sectors. The petroleum price and expenditure technical notes describe the post-2021 regression approach, and the SEDS data changes page summarizes the methodological change after EIA-782 was suspended.
The minimum, maximum, median, simple mean, and ranking on this page use only the 29 positive 2024 state values. The 22 extracted zeros are treated separately because EIA’s published table renders those transportation prices as dashes. For a national price, use the U.S. SEDS series or a properly consumption-weighted calculation rather than the unweighted state mean shown here for descriptive context.
Frequently Asked Questions
Which states had the highest transportation residual fuel oil price in 2024?
California and Washington share the highest positive value at $19.96 per million Btu, followed by Oregon at $19.94.
Do the 0.00 records mean residual fuel oil was free in those states?
No. EIA’s public 2024 table displays a dash for those transportation price entries, so they are separated from the positive-price ranking rather than treated as real zero-dollar prices.
What was the lowest positive state value?
Louisiana had the lowest positive value at $6.10 per million Btu, followed by Missouri at $7.38.
Can the simple average of state prices be used as the U.S. price?
No. A national price should reflect consumption weights or use EIA’s national SEDS series; an unweighted average of state prices is only descriptive.
Related Articles
Green Map creates custom-edited map images using open geographic data sources such as geoBoundaries, Natural Earth, OpenStreetMap, and government open data. These maps are edited visual materials, not raw data files, and are provided for education, documents, presentations, and graphic reference.