The World Bank reports a 2024 value for fuel imports as a share of merchandise imports for 131 countries and separately reported economies. The indicator is narrower than the phrase “energy dependence” may suggest. It measures the value of commodities classified in SITC Revision 3 Section 3—mineral fuels, lubricants and related materials—as a percentage of the reporting economy’s total merchandise imports. It does not directly measure fuel consumption, domestic production, net energy imports, physical volumes, or the dollar amount of fuel imports.
Across the available observations, the median is 14.33% and the unweighted mean is 15.60%. Brunei Darussalam is the highest observation at 65.92%, followed by Burkina Faso at 41.15%, Nigeria at 37.96%, Myanmar at 36.24%, and Mauritania at 34.71%. At the low end, French Polynesia records 0.37%, Kuwait 0.56%, and Antigua and Barbuda 0.68%. The range is wide enough that the global map should be read as a distribution of import composition rather than a simple rich-versus-poor or producer-versus-importer pattern.
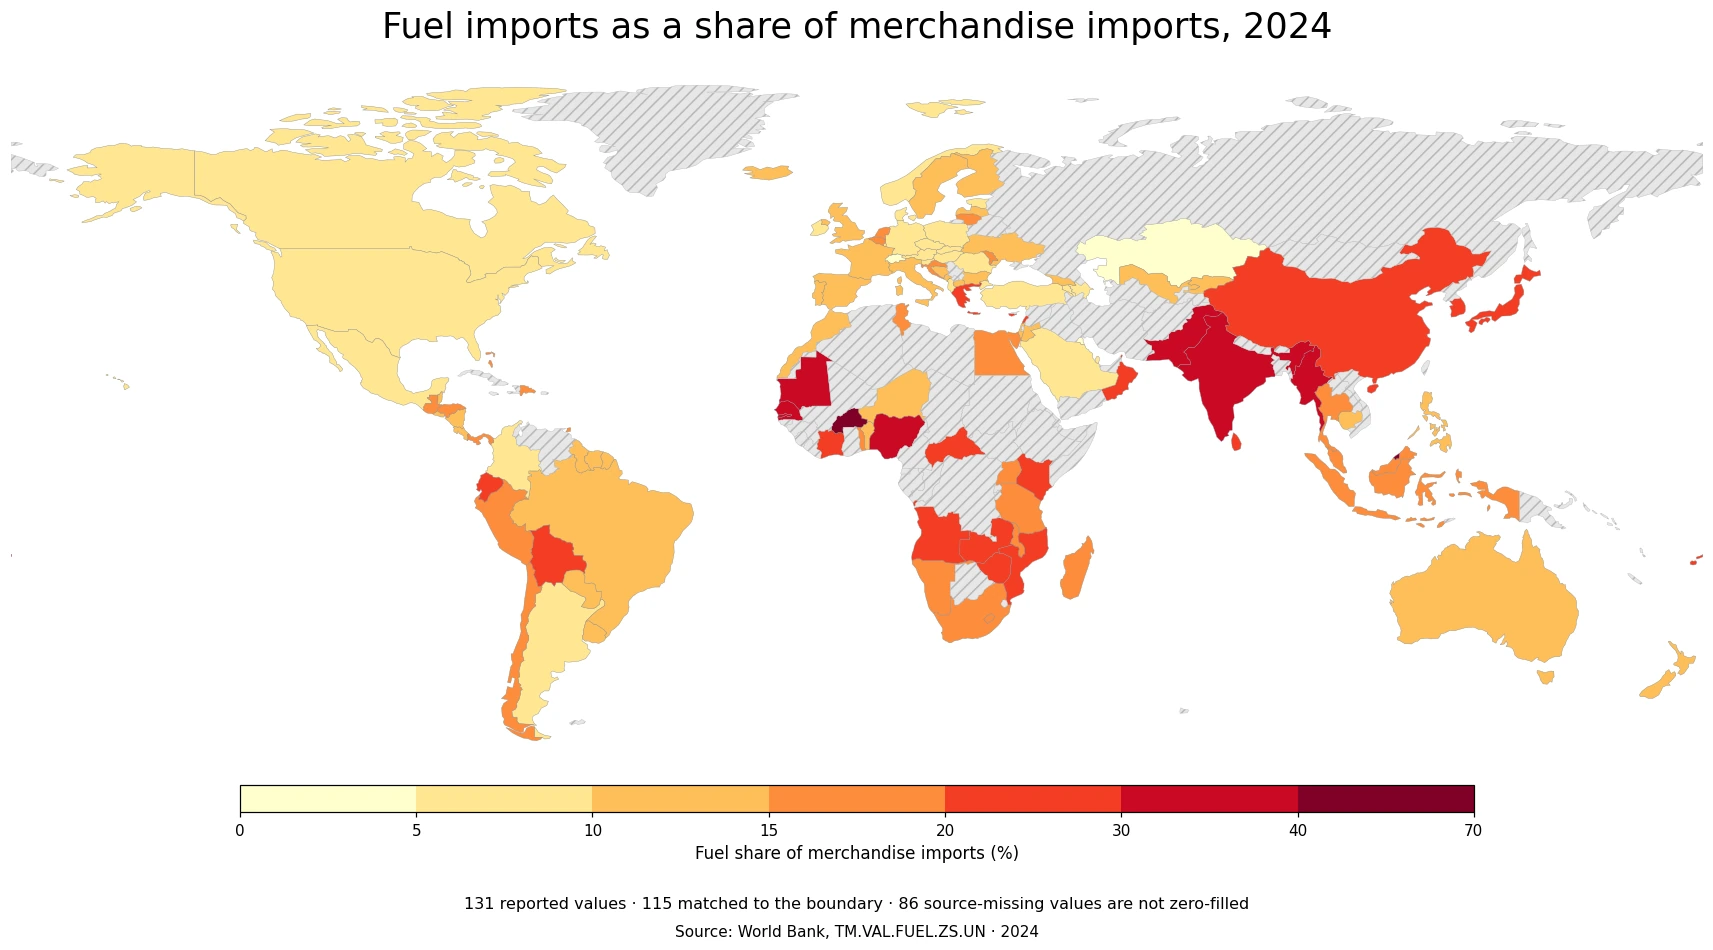
Table of Contents
The 10% to 20% band contains more than half of reported values
The largest part of the distribution is not at either extreme. There are 67 observations between 10% and 20%, compared with 24 between 5% and 10%, 23 between 20% and 30%, and 9 at 30% or more. Only 3 reported values are below 1%, while 5 fall between 1% and 5%. The first quartile is 10.14% and the third quartile is 19.91%, so half of the available economies lie within a range of roughly ten percentage points around the middle of the distribution.
There are 32 observations at or above 20% and 32 below 10%. Those two groups are equal in size, but they are geographically and economically diverse. High-share observations appear in parts of West Africa, South and Southeast Asia, and South America. The below-10% group contains several large North American and European importers as well as some hydrocarbon-producing economies. The indicator therefore cannot be reduced to one characteristic such as income level, resource endowment, or geographic region.
Brunei is a clear outlier, but the indicator is not net energy dependence
Brunei Darussalam stands at 65.92%, more than 24 percentage points above the second-highest observation. That result can look counterintuitive because Brunei is widely associated with hydrocarbon production and exports. The apparent paradox comes from what the indicator actually measures: the composition of merchandise imports. A fuel-producing economy can still import crude grades, refined petroleum products, or other fuels, and a relatively small total merchandise-import denominator can make those imports account for a large percentage.
The 65.92% figure should therefore not be translated into a statement that roughly two-thirds of Brunei’s energy supply is imported. Energy self-sufficiency requires data on domestic production, consumption, exports, imports, and often physical energy balances. This World Bank series uses trade values in the numerator and total merchandise-import value in the denominator. It is valuable for describing the import basket, but it answers a different question from an energy-balance statistic.
| Economy | Fuel imports as % of merchandise imports |
|---|---|
| Brunei Darussalam | 65.92% |
| Burkina Faso | 41.15% |
| Nigeria | 37.96% |
| Myanmar | 36.24% |
| Mauritania | 34.71% |
| Gambia, The | 31.74% |
| India | 31.54% |
| Pakistan | 31.53% |
| Senegal | 31.53% |
| Bolivia | 29.19% |
West Africa contains a visible cluster of high shares
Several West African economies are near the top of the 2024 distribution. Burkina Faso is at 41.15%, Nigeria at 37.96%, Mauritania at 34.71%, The Gambia at 31.74%, Senegal at 31.53%, and Cote d’Ivoire at 26.86%. That group creates one of the clearest high-share clusters on the map. Yet the pattern is not uniform across the region: Niger is at 12.80% and Benin at 13.65%, both much closer to the global median.
The map alone does not identify the cause of the cluster. SITC Section 3 includes multiple types of mineral fuels and related materials, and the indicator is calculated from trade values rather than physical quantities. A high share could reflect larger fuel volumes, higher fuel prices, a smaller denominator for other merchandise imports, or some combination of these effects. Distinguishing among them requires product-level trade data and a comparison of fuel-import value with the total import bill.
South and Southeast Asia show another group of elevated values
Myanmar records 36.24%, while India and Pakistan are both near 31.5%. Sri Lanka is at 21.52%, Indonesia 17.31%, Thailand 16.90%, Malaysia 16.34%, and the Philippines 14.97%. Even within a relatively connected part of Asia, the distance between the highest and lower-middle values is more than twenty percentage points. National import structures, refinery systems, domestic fuel supply, and the size of non-fuel imports can all affect the percentage.
India and Pakistan illustrate why a percentage ranking is not an import-value ranking. Their 2024 shares are almost identical, but that does not imply that the two economies imported the same amount of fuel. A percentage is the ratio of fuel imports to each economy’s own total merchandise imports. To compare absolute fuel purchases, the numerator would have to be examined directly, preferably with a common currency and consistent trade valuation.
Low shares among some oil producers do not prove energy self-sufficiency
Kuwait is at 0.56%, Bahrain at 2.59%, Saudi Arabia at 5.65%, and Qatar at 6.20%, while Oman is much higher at 23.88%. These contrasting values among Gulf economies show why a simple producer/non-producer label is insufficient. Countries can differ in refinery capacity, the mix of imported petroleum products, domestic demand, re-export activity, and the size and composition of total merchandise imports.
A low share can coexist with a meaningful absolute import bill. If an economy imports very large amounts of machinery, electronics, food, or other goods, fuels can represent a small fraction of the total even when fuel imports are substantial in dollar terms. The indicator is best treated as a composition measure. Claims about supply security, import dependence, or energy vulnerability need a separate denominator that is tied to energy use or domestic supply.
Europe spans from the mid-20s to low single digits
European observations are also widely dispersed. Greece is relatively high at 26.22%. The Netherlands is at 16.45%, Spain 13.39%, France 12.67%, Italy 12.66%, and the United Kingdom 10.11%. Germany is lower at 7.99%, Poland 7.59%, Norway 6.51%, and Switzerland 3.19%. A single European average would hide these differences in import composition and the role of fuels in each country’s merchandise trade.
North America is below 10% for all three large economies in the 2024 file: the United States is at 7.48%, Canada at 6.51%, and Mexico at 6.20%. Their low percentages should not be interpreted as evidence that fuel trade is economically unimportant. Large economies have very large denominators that include capital goods, intermediate goods, consumer products, and many other imports. The denominator effect can lower the fuel share even when the absolute fuel-import value is large.
South America also contains large neighboring differences
Bolivia is at 29.19% and Ecuador at 25.01%, while Chile is at 18.94%, Peru 16.41%, Brazil 13.20%, and Argentina 6.22%. These values show a broad spread within one continent. Resource endowment may be part of the context, but it does not determine the result on its own because the measure concerns imports, not production, and because the denominator includes every other merchandise-import category.
This is one reason a country map adds information beyond a regional summary. Neighboring economies can fall into different bands even when they share transport routes or commodity-market exposure. The map identifies where those differences occur, while the table and the underlying data are better for exact comparisons. Neither should be used to infer causation without additional evidence.
Because the series is value-based, fuel prices can move the percentage
The World Bank series is based on merchandise-trade values rather than tonnes, barrels, or energy content. If international fuel prices rise while imported quantities remain unchanged, the value of the fuel numerator can increase and the share can rise. If prices fall, the value share can decline even when physical volumes are stable or higher. A percentage based on trade values therefore answers a financial-composition question, not a direct question about the amount of energy crossing the border.
The denominator can move independently as well. If non-fuel merchandise imports grow rapidly, the fuel share may fall even when fuel imports increase. If non-fuel imports contract more sharply than fuel imports, the share may rise even when the fuel bill declines. Long-run analysis should therefore examine the numerator and denominator separately rather than attributing every percentage change to fuel demand.
The series definition matters: SITC Revision 3 Section 3 is the fuel boundary
The official indicator description defines fuels as the commodities in SITC Revision 3 Section 3, covering mineral fuels, lubricants and related materials. That classification boundary matters because it is not the same as an all-energy measure. Electricity, energy services, equipment used in the energy sector, or products classified elsewhere in merchandise trade are not automatically part of the numerator. Comparisons with a different trade classification or with customs categories need a careful concordance.
The denominator is merchandise imports, a goods concept. It is not total imports of goods and services and does not include the full current account. An economy with substantial service imports can still have the same fuel-import share of merchandise imports as another economy with very different service trade. Keeping the goods-only denominator explicit prevents the percentage from being mistaken for the fuel share of all foreign purchases.
Eighty-six missing observations are not 0% fuel shares
The comparison frame contains 217 countries and separately reported economies, but only 131 have a 2024 value in the verified World Bank series. The remaining 86 rows are preserved as source-missing observations. They are not converted to 0%, because doing so would invent evidence that fuels accounted for none of those economies’ merchandise imports. The mean, median, quartiles, and band counts in this article use only the reported values.
Coverage is therefore a meaningful limitation. The 131 observations span many regions, but they do not form a complete ranking of every economy in the World Bank country master. If missingness is concentrated in a particular set of territories or countries, the visible map can understate variation in that area. Any summary should state both the comparison year and the number of reported observations rather than presenting the map as if every economy had a 2024 value.
The geographic layer is slightly narrower than the numeric dataset
All 131 reported values remain in the numeric analysis, but the simplified Natural Earth boundary used for the map directly matches 115 of them, or 87.8%. Some small islands and city economies, including Antigua and Barbuda, Bahrain, Bermuda, Barbados, Cabo Verde, the Cayman Islands, Grenada, Hong Kong, Macao, Maldives, Malta, Mauritius, French Polynesia, Singapore, Seychelles, and Samoa, do not have a separate polygon in this low-resolution layer.
Those economies are not discarded from the statistics or ranking tables. Their absence is only a cartographic limitation of the simplified boundary file. On the map, a missing polygon or a source-missing observation should never be interpreted as a measured zero. Separating numeric coverage from map coverage is particularly important in global comparisons that include small island and territorial economies.
Several companion indicators can answer questions this percentage cannot
Absolute fuel-import value is the natural companion when the question is “who imports the most fuel in money terms?” Fuel exports can show whether an economy is simultaneously a major seller. Net energy imports, domestic energy production, and final energy consumption are better suited to questions about supply dependence. Product-level customs data can separate crude oil, refined petroleum, gas, coal, and other fuel categories, which is essential when the same headline percentage hides very different import baskets.
A time series is equally important. One 2024 observation cannot distinguish a structural pattern from a temporary year shaped by prices, inventories, refinery outages, or shifts in other merchandise imports. Comparing the same indicator over several years can show whether a high share persists, rises, or falls. Pairing that trend with physical-volume data is especially useful because it separates changes in energy quantities from changes in commodity prices.
Source and reading rule
The source is the World Bank World Development Indicators series TM.VAL.FUEL.ZS.UN, “Fuel imports (% of merchandise imports).” The official definition uses SITC Revision 3 Section 3 for mineral fuels, lubricants and related materials. This comparison uses the verified 2024 observations, excludes World Bank aggregate groups, and retains source-missing economies as missing rather than imputing values.
The most defensible reading is therefore simple: the percentage shows how much of each reporting economy’s merchandise-import value consisted of fuel commodities in 2024. High values mean fuels occupied a large place in the import basket; low values mean other merchandise categories occupied more of it. The series becomes misleading only when it is stretched into claims about energy consumption, self-sufficiency, physical import volumes, or absolute trade values that it was not designed to measure.
Frequently Asked Questions
Is the fuel-import share the same as energy import dependence?
No. It is the value of SITC Rev.3 Section 3 fuel imports divided by total merchandise imports. Energy dependence requires separate production, consumption, export, and import data.
Do the 86 missing 2024 observations mean a 0% fuel share?
No. They are source-missing observations. Missing data are not evidence that fuel imports represented zero percent of merchandise imports.
Does the highest percentage identify the largest fuel importer?
Not necessarily. The indicator is a ratio to each economy’s own merchandise imports. Absolute fuel-import value can produce a very different ranking.
Related Articles
Green Map creates custom-edited map images using open geographic data sources such as geoBoundaries, Natural Earth, OpenStreetMap, and government open data. These maps are edited visual materials, not raw data files, and are provided for education, documents, presentations, and graphic reference.