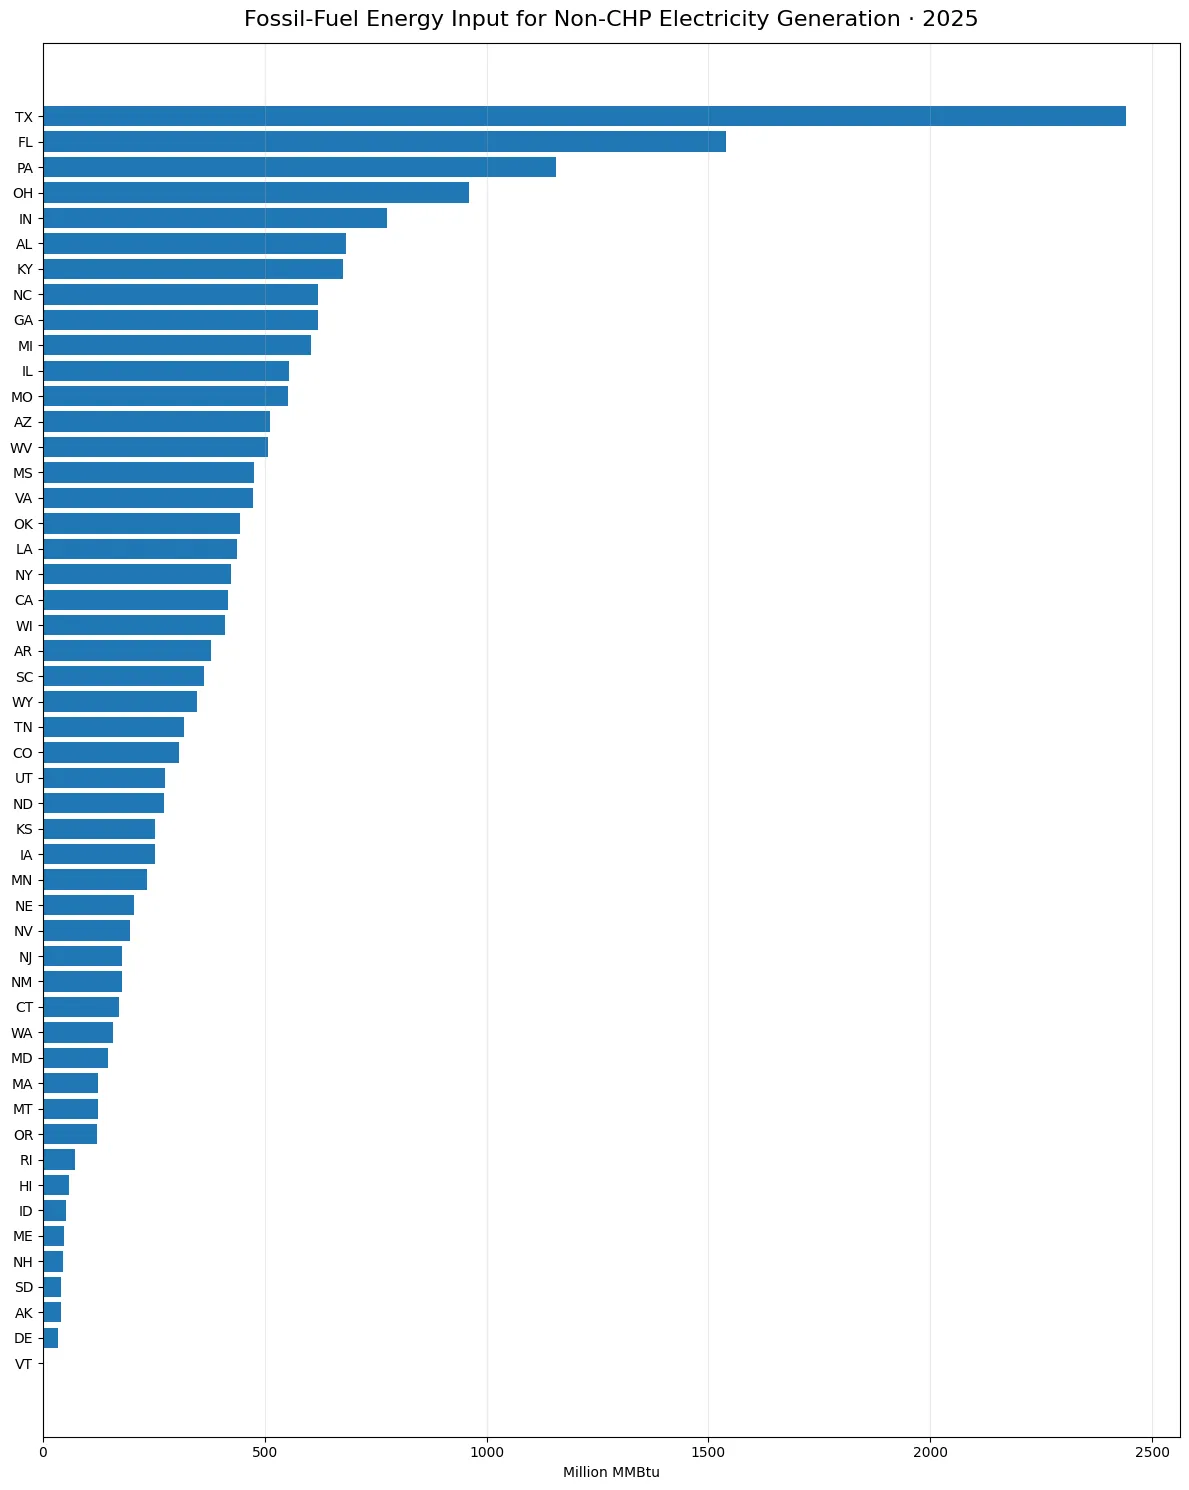
In 2025, Texas had the largest fossil-fuel energy input for electricity generation in the U.S. Electric Power Sector Non-CHP, at 2,440.900 million MMBtu. Florida followed with 1,538.841 million MMBtu and Pennsylvania with 1,157.186. The 50-state sum was 20,276.485 million MMBtu, so Texas represented 12.04% of the comparable state observations. This measure is fuel energy input, not electricity output in megawatt-hours.
The source is the U.S. Energy Information Administration electric power operational data. The comparison fixes the fuel facet at FOS, the sector at 90, the field at consumption-for-eg-btu, the year at 2025, and the unit at million MMBtu. All 50 states have positive published observations; there are no missing or zero values in this slice.
Table of Contents
What this EIA measure actually captures
FOS is the EIA fossil-fuels grouping, while sector 90 is Electric Power Sector Non-CHP. The field consumption-for-eg-btu measures the heat energy contained in fuels consumed for electricity generation. Because the unit is million MMBtu, fuels with different physical units can be placed on a common energy basis. The number does not represent barrels, short tons, cubic feet, generating capacity, or electricity delivered to customers.
The non-CHP boundary matters. Combined heat and power facilities are separated from this sector, and fuel use in industrial, commercial, residential, transportation, and other energy sectors is outside the scope. A high state value therefore means a large fossil-fuel energy input within this specific non-CHP electric-power category. It does not by itself describe all fossil-fuel use occurring in that state.
Texas led, followed by Florida and Pennsylvania
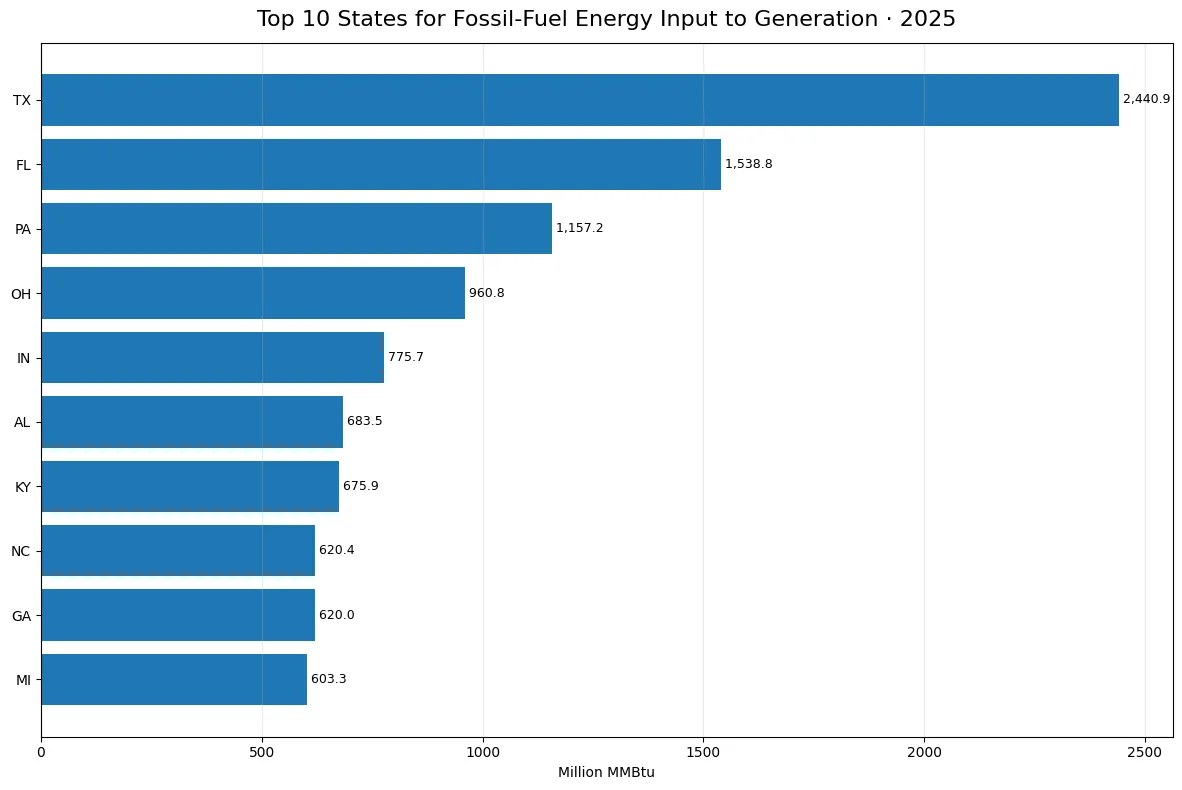
Texas recorded 2,440.900 million MMBtu, equal to 12.04% of the 50-state sum. Florida recorded 1,538.841 million MMBtu, or 7.59%, and Pennsylvania recorded 1,157.186 million MMBtu, or 5.71%. Together those three states accounted for 25.33%. The difference between Texas and Florida alone was 902.058 million MMBtu.
Ohio, Indiana, Alabama, Kentucky, North Carolina, Georgia, and Michigan completed the top ten. The ordering identifies where the absolute energy input was greatest under the same EIA definition. It should not be relabeled as a fossil-fuel generation share, a market share, or a share of total state energy use, because the denominator for those measures would be different.
Nearly half of the state total was in the top ten
The ten largest state observations represented 49.70% of the 50-state sum. That is a meaningful concentration, but it is not a pattern in which one or two states dominate the entire distribution. Texas alone was 12.04%, and the top three together were 25.33%. Large fossil-fuel electricity systems are spread across several regions and states rather than confined to a single location.
This data set does not identify why a state ranks high. Electricity demand, generating fleet composition, fuel mix, operating patterns, plant efficiency, weather, and interstate power flows can all matter. Those drivers require additional data. The safest conclusion here is descriptive: the published 2025 energy-input observations were larger in these states under the FOS, sector 90, consumption-for-eg-btu definition.
The mean is above the median
The mean across 50 states was 405.530 million MMBtu, while the median was 311.712. The first quartile was 149.323 and the third quartile was 511.284 million MMBtu. The mean being higher than the median reflects the influence of several large observations at the upper end. Using both statistics gives a better sense of a typical state than relying on the national average alone.
The smallest published value was 0.119 million MMBtu in Vermont. It is an actual positive observation, not a substitute for missing data. A very small number also does not mean that a state has no fossil-fuel generation of any kind; it applies only to the specified non-CHP sector, fossil-fuel grouping, year, field, and unit.
Why this differs from total-consumption-btu
EIA also publishes total-consumption-btu for the same fuel and sector dimensions. That field includes fuel energy used for electricity generation plus fuel used for useful thermal output. The current field, consumption-for-eg-btu, isolates electricity generation. The two measures can be very close in states where useful-thermal fuel use is small, but they are not definitionally interchangeable.
This distinction is especially important when similar articles or tables are compared. The year, fueltypeid, sectorid, field, and unit should all match before values are treated as the same series. A comparison that mixes sector 90 with sector 98, or FOS with a single petroleum product, changes the population being measured even when the titles look similar.
Fuel input and net generation answer different questions
Net generation is an output measure commonly expressed in megawatt-hours. Fuel consumption in BTU is an input measure. A plant fleet can use more or less fuel energy to produce a given amount of electricity depending on technology, efficiency, operating conditions, and fuel characteristics. For that reason, a state ranking first in fuel input does not have to hold exactly the same share of fossil-fuel net generation.
Combining the two kinds of data can support deeper analysis, but an efficiency calculation requires consistent boundaries and additional care. Gross versus net generation, plant type, fuel-specific heat content, self-use, and combined heat and power treatment can affect the result. This article therefore keeps the interpretation to the directly published state energy-input values rather than converting them into an efficiency ranking.
How to use the table and charts
The full-state chart shows the shape of the distribution and makes it easier to see how many states fall in the middle or lower ranges. The top-ten chart gives more visual separation among the largest observations. The table provides exact values and a calculated share of the 50-state sum. Those shares are useful for describing concentration within this series, but they are not percentages of U.S. electricity generation or total energy consumption.
Using more than one view also reduces the risk of overemphasizing the largest state. Texas is clearly first, yet the top-ten share shows that substantial fossil-fuel generation energy input also occurs across Florida, Pennsylvania, Ohio, Indiana, Alabama, Kentucky, North Carolina, Georgia, and Michigan. The national pattern is therefore concentrated but still broadly distributed.
Limits of a one-year state comparison
This is a 2025 annual cross-section. It cannot establish whether a state is increasing or decreasing its fossil-fuel input over time without prior-year observations. It also cannot identify which fossil fuel is responsible for the total because FOS combines multiple fossil-fuel categories. Trend analysis would require a time series, while fuel-composition analysis would require separate fuel facets under the same sector and field.
The measure should also not be treated as an environmental-impact score. Emissions depend on fuel type, combustion characteristics, plant efficiency, controls, operating conditions, and other factors. The energy-input values can be one ingredient in a broader analysis, but emissions or policy conclusions need their own verified data.
Key 2025 takeaways
The 50-state sum was 20,276.485 million MMBtu. Texas led with 2,440.900, Florida followed with 1,538.841, and Pennsylvania with 1,157.186. The top three represented 25.33% and the top ten 49.70%. The median state value was 311.712 million MMBtu, compared with a mean of 405.530.
The most important reading rule is to keep the measurement boundary intact: fossil fuels, Electric Power Sector Non-CHP, fuel consumed for electricity generation, 2025, million MMBtu. Within that boundary the state comparison is direct and consistent. Expanding the result to all fossil-fuel use, all electric-power sectors, or total electricity output would answer a different question.
| State | Code | Million MMBtu | Share of 50-state sum |
|---|---|---|---|
| Texas | TX | 2,440.900 | 12.04% |
| Florida | FL | 1,538.841 | 7.59% |
| Pennsylvania | PA | 1,157.186 | 5.71% |
| Ohio | OH | 960.797 | 4.74% |
| Indiana | IN | 775.719 | 3.83% |
| Alabama | AL | 683.477 | 3.37% |
| Kentucky | KY | 675.893 | 3.33% |
| North Carolina | NC | 620.444 | 3.06% |
| Georgia | GA | 619.964 | 3.06% |
| Michigan | MI | 603.337 | 2.98% |
A BTU-based series is particularly useful when the fossil-fuel group includes fuels that are normally sold in different physical units. Converting their energy content to a common thermal basis makes aggregation possible without pretending that one barrel, one short ton, and one unit of gas are physically equivalent. Even so, a common energy unit does not erase differences in generation technology or operating efficiency. The value remains an input quantity rather than an output or performance score.
When comparing related EIA pages, field names deserve as much attention as the headline. Consumption-for-eg-btu isolates generation fuel use, consumption-uto-btu isolates useful thermal output, and total-consumption-btu combines the two. Net-generation is a separate output field. Keeping these definitions distinct prevents two numbers that look almost identical from being treated as duplicates when they answer different questions.
The state shares in this article were calculated only to summarize the distribution of a single consistent series. They do not appear as a separate official EIA percentage field. Because every observation uses the same year, fuel group, sector, field, and unit, dividing each state value by the 50-state sum is a straightforward descriptive comparison. The percentage should always be read together with that denominator.
Frequently Asked Questions
Is this electricity generation measured in MWh?
No. It measures the energy content of fossil fuel consumed for electricity generation in million MMBtu.
Which state had the largest value in 2025?
Texas led with 2,440.900 million MMBtu, or 12.04% of the sum of the 50 state observations.
How is consumption-for-eg-btu different from total-consumption-btu?
Consumption-for-eg-btu isolates fuel used for electricity generation, while total-consumption-btu also includes fuel used for useful thermal output.
Are any state values missing or zero?
No. All 50 states have positive published values in this 2025 series.
Related Articles
Green Map creates custom-edited map images using open geographic data sources such as geoBoundaries, Natural Earth, OpenStreetMap, and government open data. These maps are edited visual materials, not raw data files, and are provided for education, documents, presentations, and graphic reference.