World Bank indicator SE.PRM.DURS reports the official number of grades or years in primary education. The 2025 master file contains 217 economies and territories, with 210 reported values and 7 source-missing rows. Values range from 4 to 8 years and the median is 6 years. Six years is by far the most common structure, appearing in 129 economies, or 61.4% of the reported total.
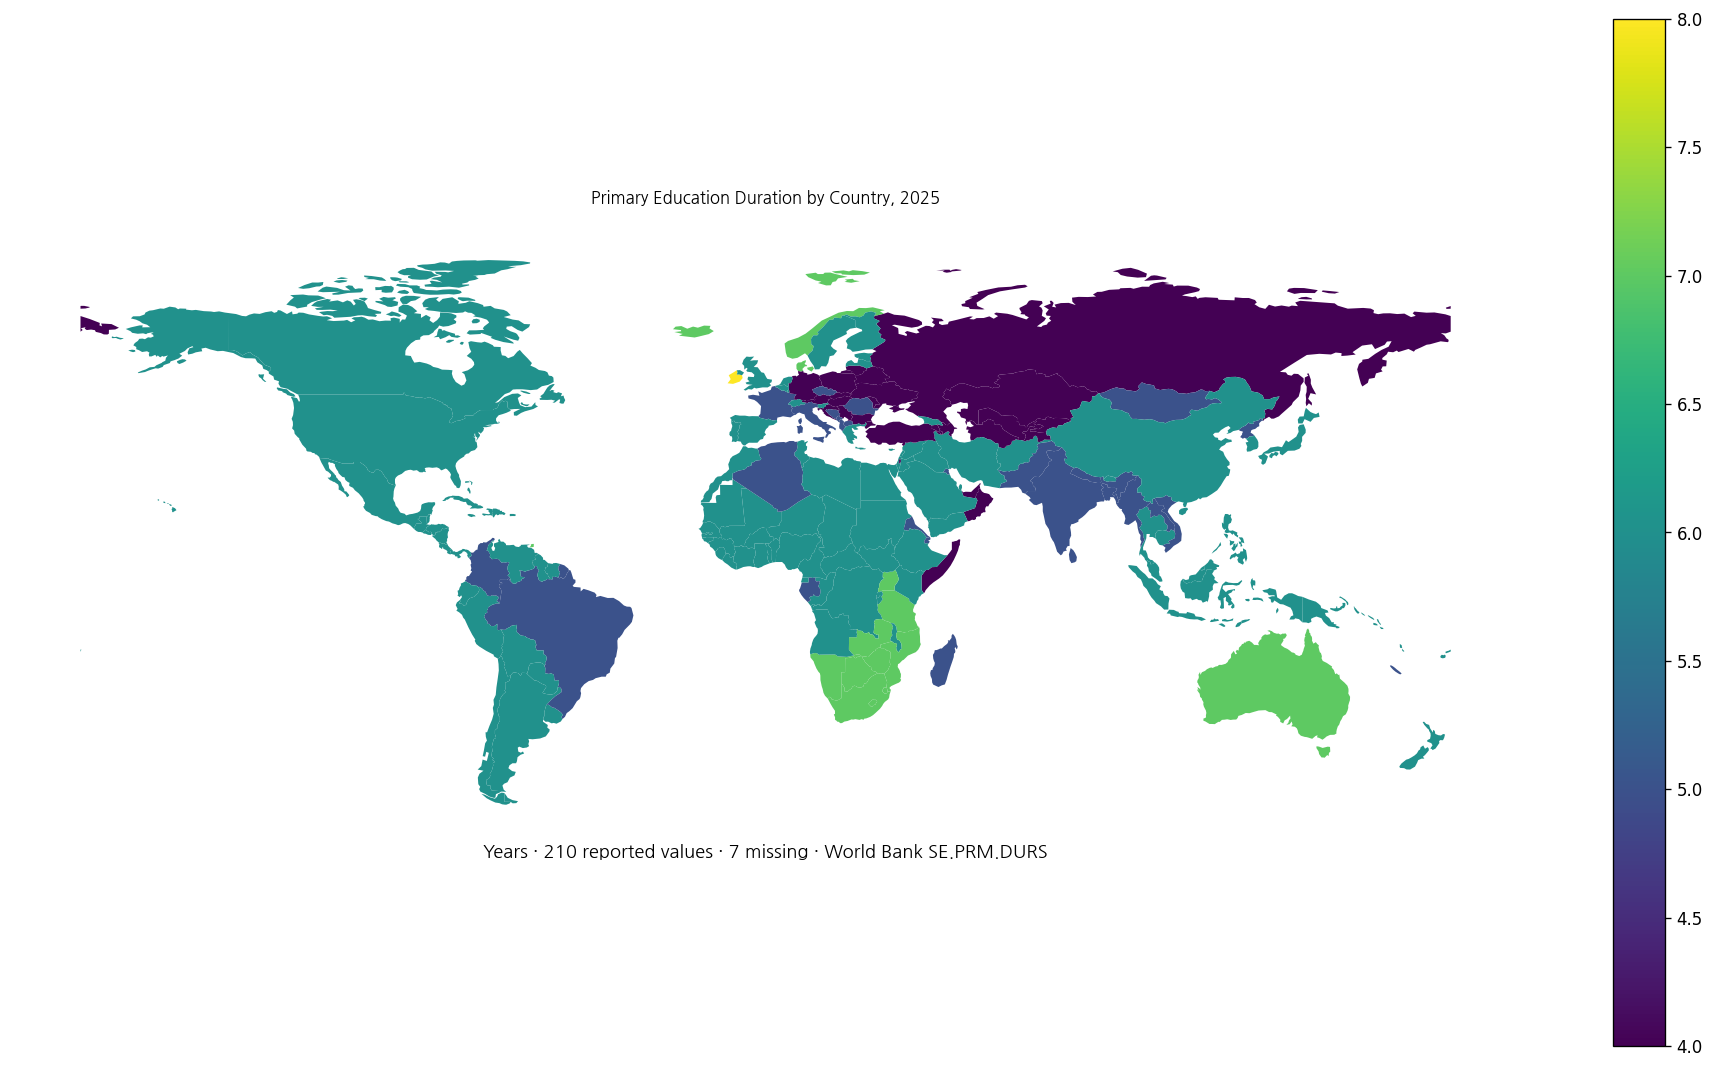
Table of Contents
What primary education duration measures
This indicator does not measure how many years an individual child actually remains in school. It reports how many grades are officially assigned to the primary stage of the education system. A six-year value means the formal primary stage is designed as six grades.
A pupil can spend more or fewer calendar years in that stage because of repetition, early entry, late entry, or other circumstances. The indicator is therefore a structural measure of the education system rather than an observed average time in school.
It is different from compulsory education duration
Compulsory education duration measures the total period during which schooling is legally required. Primary education duration measures only the length of the primary stage.
A country can have six years of primary education and ten or twelve years of compulsory schooling because compulsory education may extend into lower or upper secondary levels.
It is also different from preprimary duration
Preprimary education is a separate stage before primary school. Countries can have two or three years of preprimary education while organizing primary education into five, six, or seven years.
Comparing stage lengths separately helps show how education systems divide the years before secondary completion.
Six years is the dominant structure in 2025
Among the 210 reported economies, 129 have six years of primary education, accounting for 61.4%. Five years appears in 32 economies (15.2%), four years in 25 (11.9%), seven years in 22 (10.5%), and eight years in 2 (1.0%).
| Official primary duration | Economies/territories | Share of 210 |
|---|---|---|
| 4 years | 25 | 11.9% |
| 5 years | 32 | 15.2% |
| 6 years | 129 | 61.4% |
| 7 years | 22 | 10.5% |
| 8 years | 2 | 1.0% |
The mean is 5.73 years and the median 6. The first quartile is 5 and the third quartile 6 years, showing that the middle half is concentrated between five and six years.
Twenty-five economies report four years
The four-year group includes United Arab Emirates, Armenia, Austria, Azerbaijan, Bulgaria, Belarus, Germany, Croatia, Hungary, Kazakhstan, Kyrgyz Republic, Lithuania, Moldova, Oman, Poland, West Bank and Gaza, Russian Federation, Somalia, Fed. Rep., Serbia, Slovak Republic, Tajikistan, Turkmenistan, Turkiye, Ukraine, and Uzbekistan.
A four-year primary stage does not mean total schooling is shorter. The boundary between primary and lower secondary education is defined differently across systems.
Thirty-two economies report five years
The five-year group includes Albania, Bangladesh, Bosnia and Herzegovina, Brazil, Colombia, Comoros, Czechia, Djibouti, Algeria, Eritrea, France, Gabon, India, Italy, Kuwait, Lao PDR, Liechtenstein, Sri Lanka, Monaco, Madagascar, North Macedonia, Myanmar, Montenegro, Mongolia, New Caledonia, Nepal, Pakistan, Korea, Dem. People’s Rep., French Polynesia, Romania, San Marino, and Viet Nam.
Again, the number describes the primary stage rather than the whole education pathway. Secondary structure and compulsory-schooling rules need to be examined separately.
Six-year primary education is the most common arrangement
Six years appears in 129 economies, almost two-thirds of all reported values. It is the modal structure in the 2025 dataset.
That frequency should not be interpreted as evidence that six years is educationally superior. The indicator describes institutional design rather than effectiveness or learning quality.
Twenty-two economies report seven years
The seven-year group includes Antigua and Barbuda, Australia, Botswana, Dominica, Denmark, Grenada, Iceland, St. Kitts and Nevis, St. Lucia, Lesotho, Mozambique, Namibia, Norway, Eswatini, Trinidad and Tobago, Tanzania, Uganda, St. Vincent and the Grenadines, British Virgin Islands, South Africa, Zambia, and Zimbabwe.
A longer primary stage can shift the formal boundary with lower secondary school. The age at which primary education ends also depends on the official starting age.
Only Guam and Ireland report eight years
The eight-year category contains only Guam and Ireland in the 2025 reported data. That is about 1% of the 210 available values.
Eight years of primary education does not mean compulsory education ends after eight years. Secondary schooling can continue beyond that stage.
A longer primary stage does not automatically mean better learning
Duration is a structural property of the school system. Learning quality depends on curriculum, teaching, instructional time, school resources, family background, attendance, and many other factors.
A seven-year system cannot be assumed to produce stronger learning outcomes than a six-year system. Learning assessments and completion measures are needed for performance comparisons.
Duration is different from enrollment
Gross and net enrollment ratios measure participation in schooling. Primary duration measures how the system is organized. Two countries with six-year primary education can have very different enrollment rates.
The indicator therefore should not be used as a proxy for access, attendance, or the number of children out of school.
Starting age is needed to infer completion age
Knowing that primary education lasts six years is not enough to determine the official age at primary completion. A system starting primary school at age five ends at a different age from one starting at age seven.
For a fuller structural comparison, primary school starting age, primary duration, and the start of lower secondary education should be examined together.
Seven missing rows are not zero-year systems
Channel Islands, Faroe Islands, Greenland, Isle of Man, St. Martin (French part), Northern Mariana Islands, and Kosovo are marked `NA_SOURCE_MISSING` in the 2025 master data.
Replacing them with zero would falsely imply that no primary stage exists. The map and complete table therefore retain them as missing.
The map displays 168 of the 210 reported economies
The low-resolution world boundary file matches 168 of the 210 reported economies, about 80.0%. Several small islands and territories do not have polygons in the boundary file and remain available in the table.
Because the reported values are discrete integers from four to eight, the map is particularly useful for seeing how education-system structures vary spatially.
Complete 2025 list of 217 economies and territories
The table below preserves all 217 rows in the master data. The seven source-missing observations remain missing rather than being converted to zero.
| Economy/territory | Year | Primary education duration | Data status |
|---|---|---|---|
| Afghanistan | 2025 | 6 years | Reported |
| Albania | 2025 | 5 years | Reported |
| Algeria | 2025 | 5 years | Reported |
| American Samoa | 2025 | 6 years | Reported |
| Andorra | 2025 | 6 years | Reported |
| Angola | 2025 | 6 years | Reported |
| Antigua and Barbuda | 2025 | 7 years | Reported |
| Argentina | 2025 | 6 years | Reported |
| Armenia | 2025 | 4 years | Reported |
| Aruba | 2025 | 6 years | Reported |
| Australia | 2025 | 7 years | Reported |
| Austria | 2025 | 4 years | Reported |
| Azerbaijan | 2025 | 4 years | Reported |
| Bahamas, The | 2025 | 6 years | Reported |
| Bahrain | 2025 | 6 years | Reported |
| Bangladesh | 2025 | 5 years | Reported |
| Barbados | 2025 | 6 years | Reported |
| Belarus | 2025 | 4 years | Reported |
| Belgium | 2025 | 6 years | Reported |
| Belize | 2025 | 6 years | Reported |
| Benin | 2025 | 6 years | Reported |
| Bermuda | 2025 | 6 years | Reported |
| Bhutan | 2025 | 6 years | Reported |
| Bolivia | 2025 | 6 years | Reported |
| Bosnia and Herzegovina | 2025 | 5 years | Reported |
| Botswana | 2025 | 7 years | Reported |
| Brazil | 2025 | 5 years | Reported |
| British Virgin Islands | 2025 | 7 years | Reported |
| Brunei Darussalam | 2025 | 6 years | Reported |
| Bulgaria | 2025 | 4 years | Reported |
| Burkina Faso | 2025 | 6 years | Reported |
| Burundi | 2025 | 6 years | Reported |
| Cabo Verde | 2025 | 6 years | Reported |
| Cambodia | 2025 | 6 years | Reported |
| Cameroon | 2025 | 6 years | Reported |
| Canada | 2025 | 6 years | Reported |
| Cayman Islands | 2025 | 6 years | Reported |
| Central African Republic | 2025 | 6 years | Reported |
| Chad | 2025 | 6 years | Reported |
| Channel Islands | 2025 | No source value | No source value |
| Chile | 2025 | 6 years | Reported |
| China | 2025 | 6 years | Reported |
| Colombia | 2025 | 5 years | Reported |
| Comoros | 2025 | 5 years | Reported |
| Congo, Dem. Rep. | 2025 | 6 years | Reported |
| Congo, Rep. | 2025 | 6 years | Reported |
| Costa Rica | 2025 | 6 years | Reported |
| Cote d’Ivoire | 2025 | 6 years | Reported |
| Croatia | 2025 | 4 years | Reported |
| Cuba | 2025 | 6 years | Reported |
| Curacao | 2025 | 6 years | Reported |
| Cyprus | 2025 | 6 years | Reported |
| Czechia | 2025 | 5 years | Reported |
| Denmark | 2025 | 7 years | Reported |
| Djibouti | 2025 | 5 years | Reported |
| Dominica | 2025 | 7 years | Reported |
| Dominican Republic | 2025 | 6 years | Reported |
| Ecuador | 2025 | 6 years | Reported |
| Egypt, Arab Rep. | 2025 | 6 years | Reported |
| El Salvador | 2025 | 6 years | Reported |
| Equatorial Guinea | 2025 | 6 years | Reported |
| Eritrea | 2025 | 5 years | Reported |
| Estonia | 2025 | 6 years | Reported |
| Eswatini | 2025 | 7 years | Reported |
| Ethiopia | 2025 | 6 years | Reported |
| Faroe Islands | 2025 | No source value | No source value |
| Fiji | 2025 | 6 years | Reported |
| Finland | 2025 | 6 years | Reported |
| France | 2025 | 5 years | Reported |
| French Polynesia | 2025 | 5 years | Reported |
| Gabon | 2025 | 5 years | Reported |
| Gambia, The | 2025 | 6 years | Reported |
| Georgia | 2025 | 6 years | Reported |
| Germany | 2025 | 4 years | Reported |
| Ghana | 2025 | 6 years | Reported |
| Gibraltar | 2025 | 6 years | Reported |
| Greece | 2025 | 6 years | Reported |
| Greenland | 2025 | No source value | No source value |
| Grenada | 2025 | 7 years | Reported |
| Guam | 2025 | 8 years | Reported |
| Guatemala | 2025 | 6 years | Reported |
| Guinea | 2025 | 6 years | Reported |
| Guinea-Bissau | 2025 | 6 years | Reported |
| Guyana | 2025 | 6 years | Reported |
| Haiti | 2025 | 6 years | Reported |
| Honduras | 2025 | 6 years | Reported |
| Hong Kong SAR, China | 2025 | 6 years | Reported |
| Hungary | 2025 | 4 years | Reported |
| Iceland | 2025 | 7 years | Reported |
| India | 2025 | 5 years | Reported |
| Indonesia | 2025 | 6 years | Reported |
| Iran, Islamic Rep. | 2025 | 6 years | Reported |
| Iraq | 2025 | 6 years | Reported |
| Ireland | 2025 | 8 years | Reported |
| Isle of Man | 2025 | No source value | No source value |
| Israel | 2025 | 6 years | Reported |
| Italy | 2025 | 5 years | Reported |
| Jamaica | 2025 | 6 years | Reported |
| Japan | 2025 | 6 years | Reported |
| Jordan | 2025 | 6 years | Reported |
| Kazakhstan | 2025 | 4 years | Reported |
| Kenya | 2025 | 6 years | Reported |
| Kiribati | 2025 | 6 years | Reported |
| Korea, Dem. People’s Rep. | 2025 | 5 years | Reported |
| Korea, Rep. | 2025 | 6 years | Reported |
| Kosovo | 2025 | No source value | No source value |
| Kuwait | 2025 | 5 years | Reported |
| Kyrgyz Republic | 2025 | 4 years | Reported |
| Lao PDR | 2025 | 5 years | Reported |
| Latvia | 2025 | 6 years | Reported |
| Lebanon | 2025 | 6 years | Reported |
| Lesotho | 2025 | 7 years | Reported |
| Liberia | 2025 | 6 years | Reported |
| Libya | 2025 | 6 years | Reported |
| Liechtenstein | 2025 | 5 years | Reported |
| Lithuania | 2025 | 4 years | Reported |
| Luxembourg | 2025 | 6 years | Reported |
| Macao SAR, China | 2025 | 6 years | Reported |
| Madagascar | 2025 | 5 years | Reported |
| Malawi | 2025 | 6 years | Reported |
| Malaysia | 2025 | 6 years | Reported |
| Maldives | 2025 | 6 years | Reported |
| Mali | 2025 | 6 years | Reported |
| Malta | 2025 | 6 years | Reported |
| Marshall Islands | 2025 | 6 years | Reported |
| Mauritania | 2025 | 6 years | Reported |
| Mauritius | 2025 | 6 years | Reported |
| Mexico | 2025 | 6 years | Reported |
| Micronesia, Fed. Sts. | 2025 | 6 years | Reported |
| Moldova | 2025 | 4 years | Reported |
| Monaco | 2025 | 5 years | Reported |
| Mongolia | 2025 | 5 years | Reported |
| Montenegro | 2025 | 5 years | Reported |
| Morocco | 2025 | 6 years | Reported |
| Mozambique | 2025 | 7 years | Reported |
| Myanmar | 2025 | 5 years | Reported |
| Namibia | 2025 | 7 years | Reported |
| Naoero | 2025 | 6 years | Reported |
| Nepal | 2025 | 5 years | Reported |
| Netherlands | 2025 | 6 years | Reported |
| New Caledonia | 2025 | 5 years | Reported |
| New Zealand | 2025 | 6 years | Reported |
| Nicaragua | 2025 | 6 years | Reported |
| Niger | 2025 | 6 years | Reported |
| Nigeria | 2025 | 6 years | Reported |
| North Macedonia | 2025 | 5 years | Reported |
| Northern Mariana Islands | 2025 | No source value | No source value |
| Norway | 2025 | 7 years | Reported |
| Oman | 2025 | 4 years | Reported |
| Pakistan | 2025 | 5 years | Reported |
| Palau | 2025 | 6 years | Reported |
| Panama | 2025 | 6 years | Reported |
| Papua New Guinea | 2025 | 6 years | Reported |
| Paraguay | 2025 | 6 years | Reported |
| Peru | 2025 | 6 years | Reported |
| Philippines | 2025 | 6 years | Reported |
| Poland | 2025 | 4 years | Reported |
| Portugal | 2025 | 6 years | Reported |
| Puerto Rico (US) | 2025 | 6 years | Reported |
| Qatar | 2025 | 6 years | Reported |
| Romania | 2025 | 5 years | Reported |
| Russian Federation | 2025 | 4 years | Reported |
| Rwanda | 2025 | 6 years | Reported |
| Samoa | 2025 | 6 years | Reported |
| San Marino | 2025 | 5 years | Reported |
| Sao Tome and Principe | 2025 | 6 years | Reported |
| Saudi Arabia | 2025 | 6 years | Reported |
| Senegal | 2025 | 6 years | Reported |
| Serbia | 2025 | 4 years | Reported |
| Seychelles | 2025 | 6 years | Reported |
| Sierra Leone | 2025 | 6 years | Reported |
| Singapore | 2025 | 6 years | Reported |
| Sint Maarten (Dutch part) | 2025 | 6 years | Reported |
| Slovak Republic | 2025 | 4 years | Reported |
| Slovenia | 2025 | 6 years | Reported |
| Solomon Islands | 2025 | 6 years | Reported |
| Somalia, Fed. Rep. | 2025 | 4 years | Reported |
| South Africa | 2025 | 7 years | Reported |
| South Sudan | 2025 | 6 years | Reported |
| Spain | 2025 | 6 years | Reported |
| Sri Lanka | 2025 | 5 years | Reported |
| St. Kitts and Nevis | 2025 | 7 years | Reported |
| St. Lucia | 2025 | 7 years | Reported |
| St. Martin (French part) | 2025 | No source value | No source value |
| St. Vincent and the Grenadines | 2025 | 7 years | Reported |
| Sudan | 2025 | 6 years | Reported |
| Suriname | 2025 | 6 years | Reported |
| Sweden | 2025 | 6 years | Reported |
| Switzerland | 2025 | 6 years | Reported |
| Syrian Arab Republic | 2025 | 6 years | Reported |
| Tajikistan | 2025 | 4 years | Reported |
| Tanzania | 2025 | 7 years | Reported |
| Thailand | 2025 | 6 years | Reported |
| Timor-Leste | 2025 | 6 years | Reported |
| Togo | 2025 | 6 years | Reported |
| Tonga | 2025 | 6 years | Reported |
| Trinidad and Tobago | 2025 | 7 years | Reported |
| Tunisia | 2025 | 6 years | Reported |
| Turkiye | 2025 | 4 years | Reported |
| Turkmenistan | 2025 | 4 years | Reported |
| Turks and Caicos Islands | 2025 | 6 years | Reported |
| Tuvalu | 2025 | 6 years | Reported |
| Uganda | 2025 | 7 years | Reported |
| Ukraine | 2025 | 4 years | Reported |
| United Arab Emirates | 2025 | 4 years | Reported |
| United Kingdom | 2025 | 6 years | Reported |
| United States | 2025 | 6 years | Reported |
| Uruguay | 2025 | 6 years | Reported |
| Uzbekistan | 2025 | 4 years | Reported |
| Vanuatu | 2025 | 6 years | Reported |
| Venezuela, RB | 2025 | 6 years | Reported |
| Viet Nam | 2025 | 5 years | Reported |
| Virgin Islands (U.S.) | 2025 | 6 years | Reported |
| West Bank and Gaza | 2025 | 4 years | Reported |
| Yemen, Rep. | 2025 | 6 years | Reported |
| Zambia | 2025 | 7 years | Reported |
| Zimbabwe | 2025 | 7 years | Reported |
How to interpret the comparison
First, duration means the official number of grades in primary education, not individual time spent in school. Second, it differs from compulsory education duration. Third, preprimary and secondary stage lengths are separate. Fourth, more years do not automatically mean higher education quality.
Fifth, duration is different from enrollment and completion rates. Sixth, the seven missing rows must not be treated as zero. Starting age and the structure of the next education stage provide important context.
Source and calculation
The source is World Bank World Development Indicators SE.PRM.DURS, Primary education, duration (years). Distribution statistics use the 210 numeric observations in the 2025 master file, while all seven source-missing rows are preserved.
Frequently Asked Questions
Does six years of primary education mean every pupil spends exactly six years in primary school?
No. It means the primary stage is officially structured as six grades; actual time can differ because of repetition, entry age, and other factors.
Is primary education duration the same as compulsory education duration?
No. Primary duration covers only the primary stage, while compulsory education can extend across several education levels.
What is the most common primary education duration in 2025?
Six years is most common, reported by 129 economies, or 61.4% of the 210 available values.
Related Articles
Green Map creates custom-edited map images using open geographic data sources such as geoBoundaries, Natural Earth, OpenStreetMap, and government open data. These maps are edited visual materials, not raw data files, and are provided for education, documents, presentations, and graphic reference.